


Childhood undernutrition is a major public health problem and accounts for an increased risk of morbidity, mortality and cognitive dysfunction among children under 5 years of age(Reference Bhutta, Berkley and Bandsma1,Reference Black, Allen and Bhutta2) . It remains an important public health issue globally, with 21·3 % of the world’s children experiencing stunting, 6·9 % wasting and 5·6 % overweight in 2019(3). These global averages, however, can obscure different regional trends. As an example: from 2001 to 2019, global prevalence of stunting declined from 32·4 % to 21·3 %; this substantial decline was certainly reflected in Asia (from 37·8 % to 21·8 %)(3). Previous studies(Reference Black, Allen and Bhutta2,Reference Bhutta, Ahmed and Black4–Reference Ruel and Alderman9) have provided insights on global burden of undernutrition and helped raise awareness about the significance of early nutrition in the health of children with the evidence on the importance of enhancing nutrition-specific and nutrition-sensitive programmes for the prevention of undernutrition. Different nutritional promotion programmes, evidence-based interventions and policy commitments worldwide have contributed to a global reduction in undernutrition. However, undernutrition continues to be prevalent in low-and middle-income countries and large disparities persist between developed and developing countries(7), affecting millions of children(Reference Bhutta, Berkley and Bandsma1,Reference Black, Allen and Bhutta2,Reference Black, Victora and Walker10) . South Asia reported the highest prevalence of stunting (31·7 %) and wasting (14·3 %) and had 55·9 million children with stunting in 2019(3).
Data on childhood undernutrition from Nepal show both the incredible progress this country has made and how much more work needs to be done to fully address childhood undernutrition. Nepal alone reduced stunting from 57·2 % to 35·8 % during 2001–2016(11), which is so far the fastest recorded reduction in stunting in the world over the past two decades(11,Reference Headey and Hoddinott12) , in spite of the previous 10 years of civil war (1996–2006) and political instability until 2011(Reference Headey and Hoddinott12,Reference Cunningham, Headey and Singh13) . Despite these remarkable improvements, undernutrition remains unacceptably high in Nepal, with a stunting prevalence reported at 36 %, wasting at 10 % and underweight at 27 % in 2016(11). However, prevalences widely vary based on place of residence, development regions, ecological zones and socio-economic groups in Nepal. Relying only on overall national trends may mask widening socio-economic inequalities and alarmingly high prevalence of undernutrition(11,Reference Angdembe, Dulal and Bhattarai14,Reference Nepali, Simkhada and Davies15) . While national statistics can be helpful, a stratified analysis is important in evaluating group variations within a country and is essential in informing policy designs for more focused programmes.
To improve the nutritional wellbeing of its population, the Government of Nepal (GoN) has initiated multiple national nutritional programmes under the Department of Health Services and has developed a coordinated approach with relevant sectors and stakeholders(16). Since its membership to the Scaling Up Nutrition (SUN) movement in 2011, Nepal has adopted the Multi-Sector Nutrition Plan (MSNP) in 2012, which builds upon past efforts to specifically reduce maternal and child malnutrition(16,Reference Devkota, Adhikari and Upreti17) . The GoN is devoted to achieving internationally agreed World Health Assembly’s (WHA) global nutrition targets by 2025 and Goal 2 of Sustainable Development Goals (SDG) on zero hunger by 2030(16). The global nutritional targets aim to reduce the number of stunted children under 5 years of age by 40 % and childhood wasting to less than 5 % by 2025(18). Similarly, the target under SDG 2.2 includes ending all forms of malnutrition by 2030, including achieving, by 2025, the internationally agreed targets on stunting and wasting in children under 5 years of age, and addresses the nutritional needs of adolescent girls, pregnant and lactating women, and older persons(19). In this context, GoN has set a target of lowering the prevalence of stunting to 24 % by 2025 and to 15 % by 2030, and reducing wasting to less than 5 % by 2025 and to 4 % by 2030(16). In addition, GoN has set a national target of reducing underweight to 15 % by 2025 and to 10 % by 2030(16).
Monitoring the progress of nutritional status with projections in different socio-demographic and economic groups help policymakers understand the achievements and challenges faced in different population subgroups. This will be helpful in formulating programmes for the prevention of nutrition-related problems and designing strategies to meet WHA nutritional targets by 2025 and SDG by 2030. Three types of undernutrition (stunting, wasting and underweight) are used holistically to assess childhood nutritional status reflecting different biological processes and are essential in tailoring different interventions(Reference Black, Allen and Bhutta2,Reference Akhade20,21) . Stunting, a sign of chronic undernutrition, is caused by long-term insufficient nutrient intake and repeated infections, whereas wasting is a measure of acute undernutrition as the result of acute food shortage or illness(Reference Black, Allen and Bhutta2,21) . Underweight, on the other hand, occurs when children fail to reach an expected weight for their age, either due to acute undernutrition, chronic undernutrition or both(21). A few published reports have considered all three types of undernutrition(Reference Headey and Hoddinott12,22,23) ; however, most of the scientific journal articles have analysed undernutrition trends focusing only on stunting(Reference Cunningham, Headey and Singh13–Reference Nepali, Simkhada and Davies15,Reference Devkota, Adhikari and Upreti17) and wasting(Reference Cunningham, Headey and Singh13). Therefore, there is a strong need for empirical studies to use all three types of undernutrition (i.e. stunting, wasting and underweight) together to understand current undernutrition trends and make accurate projections of future trends. This is essential not only for designing future programmes but also in assessing if the GoN can meet its nutritional targets.
This study focuses on two main objectives: (1) analysis of the disaggregated trends of undernutrition among different socio-demographic and economic subgroups of children under 5 years of age and (2) forecast prevalence of stunting and wasting to inform progress towards achieving nutritional targets of WHA by 2025 and SDG by 2030 and national targets for underweight during the same time frame.
Methods
Study design
The present study is a secondary analysis of the data from four rounds of Nepal Demographic and Health Survey (NDHS) conducted in 2001, 2006, 2011 and 2016 to analyse trends in childhood undernutrition. NDHS is a nationally representative, cross-sectional survey on varieties of demographic, health and nutrition information conducted every 5 years since 1996. The survey followed a two-stage and three-stage stratified cluster random sampling design. More details about the sampling method for all surveys, data collection, topics and procedures can be obtained from NDHS reports(11,22–24) .
Description of datasets
The children and household member datasets from four NDHS were merged and pooled together to track anthropometric measures and to evaluate undernutrition trends of children under 5 years. For the 2001 survey datasets, separate files of height-weight recode and wealth recode were merged with children and household member datasets before they were pooled together with other survey years. The study population included a total of 39 175 households with a response rate of 99·6 % (2001), 96·6 % (2006), 99·4 % (2011) and 98·5 % (2016)(11,22–24) . This study included 16 613 children under 5 years of age as a sample for the analysis (Table 1).
Table 1 Information on four Nepal Demographic and Health Surveys included in data analysis

Measurements and variables
Child anthropometric measurements (i.e. weight and height) were obtained for those aged 6–59 months in all four surveys. Weight was measured while lightly dressed with lightweight seca infant scales with a digital display (seca model 878) with a precision of ±100 gram, designed and supplied by UNICEF. Similarly, height was measured with a measuring board (Shorr Boards) with precision to 1 millimetre. The recumbent length was measured for children younger than 24 months, and standing height was measured for older children above 24 months(11,22–24) .
Anthropometric measurements were used to generate information on prevalence of undernutrition (stunting, wasting and underweight). Stunting is defined as height-for-age z score that is 2 sd or less, underweight is defined as weight-for-age z score under 2 sd or less, and wasting is defined as weight-for-height z score under 2 sd or less(25). The z scores (height-for-age z score, weight-for-age z score and weight-for-height z score) are calculated using software based on the WHO Anthro program version 3.2.2 (WHO, 2011) and the macros for statistical packages. The WHO 2006 flags were used for cleaning and excluding cases with z scores beyond specified lower or upper cut-offs for each type of undernutrition(Reference Croft, Aileen and Courtney26).
An ecological framework(Reference Gregson, Foerster and Orr27) with two levels including individual- and community-level characteristics was used to explore nutritional status. The explanatory variables representing individual-level analyses were child age, sex of children, mother’s education (no education, primary, secondary and higher) and wealth index. The wealth index has five categories (poorest, poorer, medium, richer and richest) and was developed using a principal component analysis to combine information on the household’s ownership of different assets or access to substantial goods. Explanatory variables representing community-level analyses include place of residence (rural/urban), ecological zones (Mountain, Hill and Terai) and development regions (eastern, central, western, mid-western and far-western). Development regions in Nepal are regional administrative units divided for balanced and proportionate development. All categories within each explanatory variable were used as categorised in NDHS(11,22–24) .
Statistical analysis
Descriptive, logistic regressions and forecast analyses were performed. Prevalence and CI were calculated through the descriptive analyses. A binary logistic regression was used to test the significance of trends (Wald Chi-Squared test) over time. An autoregressive integrated moving average model was used to forecast the prevalence of undernutrition until 2030 based on the past prevalence in 2001, 2006, 2011 and 2016.
The assumptions used in the autoregressive integrated moving average model for forecasting are that it uses past data to estimate future events assuming that the time series follows linear and normal distribution, and the data remain stable stationary. A model that shows stationary is the one that shows constancy to the data over time(Reference Brockwell and Davis28,Reference Ho and Xie29) . The model is written in the form of autoregressive integrated moving average (p, d and q) where p is the order of the autoregressive process, d is the order of the data stationary and q is the order of the moving average process. The model with p, d, q (0, 0, 0) was used as the best-fit model in our study for forecasting. Further, three indicators were used to access the model fit including root mean square error, mean absolute percentage error and mean absolute error. The findings in this study showed that the selected autoregressive integrated moving average model captured the dynamics in the series and produced forecasted values that had minimal forecast errors when compared with the actual undernutrition status in the validation period.
Data analyses were performed in Statistical Package for Social Sciences (SPSS) version 23 (IBM Corp). All analyses were stratified by sex. The present analysis considers P ≤ 0·05 as statistically significant. The DHS sampling design includes both under- and oversampling; therefore, to adjust the survey design effect, all analyses were performed by applying sample weights provided by DHS(Reference Croft, Aileen and Courtney26).
Results
After excluding 822 children with missing values for anthropometric measurements, the number of children included in the analysis for the study from 2001 to 2016 is 16 606 for stunting, 16 602 for wasting and 16 613 for underweight. Children mean age in all NDHS surveys was 30 months (1·6 sd). On average, sampled children were 102 males per every 100 females (Table 1).
National nutritional trends in children
Nationally, all three undernutrition indicators improved during the study period. The prevalence of stunting decreased from 57·2 % to 35·8 % (P < 0·001), underweight from 42·7 % to 27 % (P < 0·001) and wasting from 11·2 % to 9·7 % (P < 0·05) among children 0–59 months of age (Fig. 1). Both males and females at the national level experienced decline in the prevalence of stunting and underweight (P < 0·001). However, the declining trend for wasting was statistically significant only for males (P = 0·022) (see online supplementary material, Supplemental Tables 1–3).

Fig. 1 Trends in undernutrition at the national level, 2001–2016. ![]() Stunting;
Stunting; ![]() Wasting;
Wasting; ![]() Underweight
Underweight
Detailed trends in stunting (height-for-age)
Sex-stratified analysis showed a decline in the stunting trend for all age groups (P < 0·05) except in 0–5-month-old male children (P = 0·133). The largest decrease (30 percentage points) was in the 36–47-month age group in both males and females throughout the 15-year period. The lowest decline of the prevalence of stunting in female children (7·4 percentage points) and the highest decline in male children (19·3 percentage points) were observed within the same group whose mothers received higher levels of education during the 15-year period. Similarly, the prevalence of stunting in 2016 was the highest in the poorest quintile (49·2 %). Stunting prevalence in rural females was reduced by almost double (18·3 percentage points) compared to urban females (8·6 percentage points) during the study period.
When separated by ecological zones, stunting prevalence decreased in all zones and for both sexes (P ≤ 0·001). Stunting prevalence in females in Hill decreased by 29·4 percentage points from 2001 to 2016. The prevalence of stunting in 2016 was the highest (46·9 %) in male children living in Mountain. Furthermore, the highest improvement was found in the far-western region with a reduction of 25·7 percentage points among males during the study period (see online supplementary material, Supplemental Table 1).
Detailed trends in wasting (weight-for-height)
A declining trend (P < 0·001) for wasting was found only for males aged 12–23 months. The highest reduction in wasting prevalence (3·8 percentage points) during the study period was found among females aged 12–23 months. Sex-stratified wasting trends by mother’s education were not statistically significant for any groups. The highest decrease in wasting prevalence was in male children whose mothers had primary education, which had decreased by 3·2 percentage points from 2001 to 2016. The highest decrease in wasting prevalence was observed in males in the middle quintile (decrease by 5·4 percentage points), while it increased by 2·8 percentage points among female children in the same wealth quintile from 2001 to 2016.
Rural areas showed no significant trend in decline in wasting from 2001 to 2016 (P = 0·494). The overall prevalence of wasting among urban males and females is almost similar in 2001 and 2016, with fluctuating trends in different survey years. When analysing wasting trends by ecological zone, declining trends in wasting prevalence were only found in those living in Terai (P ≤ 0·05). However, the prevalence of wasting in females living in Terai (12·7 %) was more than double compared to females living in Mountain (5·9 %) and Hill (6·3 %) in 2016. The highest decline in wasting was among females living in the central region (6·3 percentage points) from 2001 to 2016 (see online supplementary material, Supplemental Table 2).
Detailed trends in underweight (weight-for-age)
During the study period, maximum decline in underweight prevalence (23 percentage points) was observed among females aged 36–47 months. Trends in underweight vary based on maternal education, although generally, results suggest that underweight prevalence decreased as the mother’s educational level increased. However, it is worth noting that the maximum decrease in underweight prevalence (12·7 percentage points) was experienced by female children whose mothers had no education during the study period.
Declining trends in underweight prevalence over 15 years were statistically significant (P < 0·001) in all wealth quintiles with the highest decrease observed in the poorest quintile from 51·8 % to 32·9 %. Results show that both sexes experienced a decline in underweight prevalence (P < 0·05) in all ecological zones. From 2001 to 2016, the prevalence of underweight among females was reduced by 22·9 percentage points in Hill and by 14·2 percentage points in Mountain. The highest decrease in underweight prevalence was among female children in the central region (20·6 percentage points) in the same period (see online supplementary material, Supplemental Table 3).
Forecast of prevalence for child undernutrition
Figure 2 shows that the national prevalence of all three metrics will decline by 2030. Stunting prevalence will decline nationally to 21·6 % in 2025 and to 14·3 % in 2030. Similarly, underweight prevalence will decline to 15·5 % in 2025 and to 9·8 % in 2030, and wasting prevalence will decline to 9 % in 2025 and to 8·4 % in 2030.
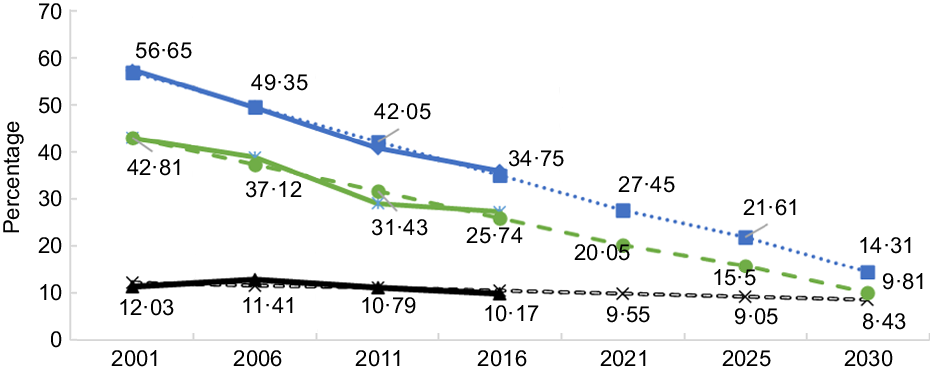
Fig. 2 Forecast of prevalence for child undernutrition. ![]() Actual stunting;
Actual stunting; ![]() predicted stunting;
predicted stunting; ![]() actual wasting;
actual wasting; ![]() predicted wasting;
predicted wasting; ![]() actual underweight;
actual underweight; ![]() predicted underweight
predicted underweight
Stratifying the analysis by region showed that the prevalence of stunting in the mid-western region will be 30·7 % in 2025 and 24 % in 2030, while in the far-western region stunting is expected to be 23 % in 2025 and 16 % in 2030. Unfortunately, the trends for wasting prevalence in all development regions are expected to be higher than nutrition targets in 2025 and 2030. The underweight prevalence will remain high for the eastern region (18·1 % and 14·4 %) and the mid-western region (20·3 % and 14·7 %) both in 2025 and 2030 (Fig. 3).

Fig. 3 Forecast of undernutrition by development region. ![]() Stunting actual;
Stunting actual; ![]() underweight actual;
underweight actual; ![]() wasting actual;
wasting actual; ![]() stunting predicted;
stunting predicted; ![]() underweight predicted;
underweight predicted; ![]() wasting predicted
wasting predicted
When sorting by ecological zones, forecast results show that the prevalence of stunting will reach target levels in the Hill, where stunting is expected to be 16·2 % in 2025 and 7·1 % in 2030. The Terai is likely to achieve the stunting target for 2025 with a prevalence of 23·8 %. Similarly, targets for underweight will only be reached in the Hill, where underweight prevalence is expected to be 6·4 % in 2025 and no underweight cases in 2030. However, the targets for wasting will not be achieved in any of the ecological zones (Fig. 4).

Fig. 4 Forecast of undernutrition by ecological zones. ![]() Stunting actual;
Stunting actual; ![]() underweight actual;
underweight actual; ![]() wasting actual;
wasting actual; ![]() stunting predicted;
stunting predicted; ![]() underweight predicted;
underweight predicted; ![]() wasting predicted
wasting predicted
Discussion
The undernutrition trend analysis stratified by socio-demographic, economic and child characteristics from 2001 to 2016 showed that Nepal has made remarkable progress in reducing undernutrition, especially in regard to stunting and underweight. Nepal’s progress in fighting undernutrition over this period can largely be attributed to increased access to health care, increased maternal education, improved sanitation and increased household wealth(Reference Headey and Hoddinott12,Reference Cunningham, Headey and Singh13,Reference Headey, Hoddinott and Park30) . However, our trend analysis also showed that there is still considerable room for improvement and a need for more effective programmes and inter-sectoral coordination(Reference Headey and Hoddinott12) to achieve nutritional targets of WHA 2025 and SDG 2030.
At the national level, childhood undernutrition, as measured by stunting and underweight, decreased significantly. From 2001 to 2016, stunting prevalence decreased by 21·4 percentage points and underweight prevalence decreased by 15·7 percentage points. Projections based on these results suggest that stunting prevalence will be 21·6 % in 2025 and 14·3 % in 2030. Similarly, wasting prevalence will be 9 % in 2025 and 8·4 % in 2030. Based on the above findings, Nepal appears on track to achieve the WHA’s nutrition targets for stunting but unlikely to achieve the targets for wasting (Fig. 2).
Although much progress has been made at reducing the prevalence of undernutrition at the national level, analysis showed that national average masks disparities across socio-economic groups, developmental regions, ecological zones and places of residence. The results suggest that rural areas have experienced remarkable reductions in undernutrition prevalence compared to urban areas. Nevertheless, undernutrition prevalence in rural areas remains higher than national averages. Stunting in rural areas was 4·4 percentage points higher than the national average and 10·2 percentage points higher than urban areas in 2016 (see online supplementary material, Supplemental Table 1). Similarly, the underweight prevalence in rural areas is 7·7 percentage points higher than in urban areas and 4·1 percentage points higher than the national average (see online supplementary material, Supplemental Table 3). Wasting in children has seen less improvement and more fluctuating trends in both urban and rural areas among both sexes (see online supplementary material, Supplemental Table 2). These findings contrast with trend studies in Peru, where improvements in stunting, wasting and underweight were found to be higher in urban areas(Reference Loret de Mola, Quispe and Valle31,Reference Urke, Mittelmark and Valdivia32) . The huge urban–rural disparities in Peru despite different national-level social programmes and policy enhancement in the reduction of malnutrition is due to the challenges faced in implementing these programmes in rural areas until the mid-2000s due to internal conflict(Reference Loret de Mola, Quispe and Valle31). A similar study conducted in Ghana(Reference Amugsi, Mittelmark and Lartey33) reported statistically significant declining underweight trends for both males and females, and declining stunting and wasting trends only among males. However, our results showed statistically significant declining trends for stunting and underweight in both males and females. The difference in findings might be related to variation in culture, socio-economic status and care practices of children in both countries(Reference Frempong and Annim34,Reference Raj, McDougal and Silverman35) .
The undernutrition prevalence varied depending on the ecological zone. Stunting in Mountain was higher than the national average by almost 11 percentage points in 2016, while wasting and underweight were high among children in Terai (Figs. 1 and 4). Stunting was reduced by 19·5 percentage points in Mountain and by 27·5 percentage points in Hill from 2001 to 2016, but the prevalence of stunting was 46·8 % in Mountain in 2016, which remains unacceptably high compared to national and global estimates(7). Another recent study examining ecological variations of stunting in Nepal found similar results of the highest prevalence of stunting in Mountain across all four survey years(Reference Nepali, Simkhada and Davies15). The wasting prevalence in female children living in Terai was 3 percentage points higher than national averages and was more than double the prevalence found in female children living in Hill and Mountain in 2016. The underweight prevalence in Hill was below the national average. Hill is likely to achieve WHA’s and national targets for stunting by 2025 and 2030, but Mountain is unlikely to achieve either stunting or wasting targets, and Terai is unlikely to meet proposed targets for wasting (Fig, 4). In fact, Terai would need to reduce the current wasting prevalence by half in order to reach WHA 2025 and national targets.
While comparing the prevalence of undernutrition among different development regions, the central and far-western regions achieved the highest and similar declining trends in undernutrition compared to other three regions. The reduced prevalence in Nepal’s central region is likely because the region has better access to basic resources such as health facilities and schools, especially compared to the far-western region(16,36) . However, reduced undernutrition prevalence in the far-western region can likely be attributed to active poverty alleviation government programmes, including Poverty Alleviation Fund, geographically targeted health and employment programmes, and targeted programmes for poorer and marginalised sections of the population(37). The mid-western region has the highest levels of poverty and was highly affected during 1996–2006 by Maoist insurgency(Reference Devkota and Van Teijlingen38). This region has the highest prevalence of stunting (42 %) and underweight (29·1 %) which was 6 percentage points and 2 percentage points above the national average in 2016. The wasting prevalence was highest in the eastern region at 13·1 %, which was 3·4 percentage points above the national average. The projection suggests that the mid-western region will not be able to achieve WHA 2025 and SDG 2030 nutritional targets on stunting and wasting. Therefore, in order to meet the global and national nutritional targets, the GoN must provide additional resources to target-focused programmes in the mid-western region along with Mountain and Terai. In particular, programmes targeting wasting in all ecological zones and regions need to be prioritised by GoN, otherwise, these areas are unlikely to meet national targets. Our findings on regionally based inequalities in child undernutrition are consistent with other studies(Reference Nepali, Simkhada and Davies15,Reference Amugsi, Mittelmark and Lartey33,Reference Bredenkamp, Buisman and Van de Poel39) .
Our analysis showed that undernutrition prevalence decreased with improved levels of mothers’ education (see online supplementary material, Supplemental Tables 1–3). Previous studies(Reference Bhutta, Das and Rizvi5,Reference Headey and Hoddinott12,Reference Nepali, Simkhada and Davies15,Reference Urke, Mittelmark and Valdivia32,Reference Meshram, Arlappa and Balakrishna40,Reference Sahu, Kumar and Bhat41) have also reported a similar finding between mother’s education and undernutrition. The improvement in literacy rate among women from 28 % in 2001(22) to 66·7 % in 2016(11) might have contributed to lowering undernutrition among the children. The findings of our study also showed that the decrease in the prevalence of undernutrition was correlated with improved levels of wealth quintile. The stunting prevalence in the poorest quintile was high by 13·4 percentage points compared to the national prevalence of stunting in 2016. Moreover, the stunting gap between the poorest and the richest households seemed to have increased over time: in 2001, the stunting prevalence among the poorest quintile was only 1·5 times as high as the richest quintile, while in 2016, this gap increased to 3 times. Similarly, the wealth gap in the underweight prevalence between the poorest and richest quintiles increased from two times in 2001 to three times in 2016. However, during the period of 15 years, the poorest quintile also experienced a large decline in all three types of undernutrition. These results are consistent with other studies(Reference Angdembe, Dulal and Bhattarai14,Reference Bredenkamp, Buisman and Van de Poel39,Reference Meshram, Arlappa and Balakrishna40) . The decline in the stunting and underweight prevalence among the poorest and poorer quintiles may be related to the economic growth of the country since 1995/96, in which poverty declined from 42 % in 1995/96 to 25 % in 2010, food inadequacy reduced from 31 % in 1999/2001 to 19 % in 2011/13, and education improved for those in the poorest quintile(36,Reference Uematsu, Shidiq and Tiwari42) .
Stunting and underweight were more prevalent among older children (aged 24–35 months). However, the prevalence of wasting was high in children aged 6–11 months compared to other age groups. Previous studies(Reference Sahu, Kumar and Bhat41,Reference Das and Gulshan43,Reference Endris, Asefa and Dube44) have reported an increased risk of undernutrition with an increase in the age of the child. The reason could be attributed to late introduction of low nutritional quality supplementary food to the child, unfulfilment of optimal food requirements of the child, and illnesses such as diarrhoea, acute respiratory infections and intestinal parasites to name a few(Reference Meshram, Arlappa and Balakrishna40,Reference Endris, Asefa and Dube44–Reference LaBeaud, Singer and McKibben47) .
Nepal’s improvements in childhood undernutrition might be influenced by a wide range of policies, programmes and projects dedicated to improve the health and nutritional status of mothers and young children conducted by the government with the support of various donor organisations, and other non-governmental organisations at the national and local levels(16,48,49) . The National Nutrition Policy guides nutrition strategic and programmatic direction within the health sector and MSNP focus on nutrition-specific and nutrition-sensitive programmes. Relevant programmes focused on children’s growth, promotion of breast-feeding and improving complementary feeding practices. Similarly, capacity enhancement of community and health workers for screening and management of acute malnutrition along with supportive supervision, regular monitoring and behaviour change communication initiatives in nutrition are noteworthy interventions(16,48,49) . These interventions may have contributed to the improvement of nutrition behaviours, feeding practices, decrease in micronutrient deficiencies and reduction in undernutrition among the children under 5 years of age in Nepal(16,48) . Moreover, increased economic growth, standards of living, accessibility to development and communication infrastructures, and decreased poverty contributed to the reduction of undernutrition rates(37,Reference Uematsu, Shidiq and Tiwari42) . This economic growth is attributed to different programmes such as the Agriculture Support Programme, creation of Poverty Alleviation Fund, and integrated rural development programme(37).
The sheer number of specific sectors and organisations that are working to reduce undernutrition highlights the importance of effective multi-sectoral nutritional sensitive strategies together with nutrition-specific interventions(Reference Ruel and Alderman9). In addition, to achieve global nutrition targets, the GoN should strengthen and scale up nationwide nutrition programmes such as Maternal, Infant and Young Children Nutrition programme, micronutrient powder distribution linked with Infant and Young Child Feeding (IYCF), and MSNP-II Phase (2018-2022)(16).
The study has some limitations. It is based on the cross-sectional nature; hence, the results only suggest associations rather than causal inference. Moreover, the sample in subgroups analysis may not be representative due to a decrease in the power of statistical testing for trends as the sampling frame in this study was done on children 6–59 months old. Despite these limitations, the strength of this study is that it is based on a nationally representative survey collected over four rounds (2001–2016) with a large sample size and an average response rate of 98 %. NDHS used the same standardised data collection tools, and surveys were conducted by the same organisation for all four rounds, which helps keep the data consistent and accurate.
Conclusion
The study showed a notable decline in undernutrition, especially on stunting and underweight over the last 15 years in Nepal. However, substantial inequalities exist across socio-economic groups, development regions, ecological zones and places of residence. Moreover, Nepal is likely to achieve the global and national nutritional targets for stunting but unlikely to reach both targets related to wasting. The study provides scientific evidence useful for policymakers, planners and practitioners to understand the achievements and challenges faced by different subgroups. The need of multi-sectoral efforts, high political commitment and additional resources with targeted and focused programmes for different subgroups to meet the global and national nutritional targets is recommended.
Acknowledgements
Acknowledgements: The researchers would like to thank the DHS Program for providing access to the data for this study. The authors would like to thank all involved in the data collection and all the participant mothers and children of NDHS. We are also grateful to Jan Reinhardt, Basanta Raj Adhikari and Joseph Balikuddembe for insights to this manuscript. Financial support: None. Conflict of interest: None. Authorship: SPA designed the study, conducted statistical analysis, interpreted findings and discussion and wrote the first draft of the manuscript. HZ, RPA and SST supported in designing the study and result interpretation. RY, KZ and QW helped discuss the results. All the authors contributed to revision and approval of the final version of the manuscript. Ethics of human subject participation: This study analysis was based on secondary data and original research did not violate any ethics procedure; hence, it was exempted from the ethical approval process for further analysis and publication. Datasets were accessed through DHS programme upon written request with a clear explanation of the purpose of data use.
Supplementary material
For supplementary material accompanying this paper visit https://doi.org/10.1017/S1368980021000240


