


Overweight and obesity are increasing in prevalence, representing a growing public health problem worldwide. According to WHO estimates, more than 50 % of the adult population in the WHO European Region is overweight and more than 20 % is clinically obese( 1 ). Data from the National Health Survey in 2013 show that 56·3 % of the adult population in Serbia (≥20 years old) is overweight, subdivided as 35·1 % pre-obese (BMI=25·0–29·9 kg/m2) and 21·2 % obese (BMI≥30·0 kg/m2)( 2 ). Obesity, and in particular abdominal obesity, predisposes people to a series of risk factors for chronic non-communicable diseases. It is often associated with conditions such as dyslipidaemia, arterial hypertension, insulin resistance and diabetes, which contribute to the occurrence of cardio- and cerebrovascular events( Reference Wyatt, Winters and Dubbert 3 , Reference James, Jackson-Leach and Mhurchu 4 ). These chronic non-communicable diseases account for the highest burden of disease in Serbia( Reference Atanaskovic-Markovic, Bjegovic and Jankovic 5 ).
Different anthropometric methods are used for the assessment of excess body fat. BMI is an index widely used to diagnose obesity and to identify patients at increased risk of adiposity-related adverse health outcomes. Guidelines generally suggest that those within the normal range of BMI do not need to lose weight, so normal-weight individuals sometimes pay little or no attention to their diet and other lifestyle habits. However, BMI does not distinguish between lean and fat mass accumulation( Reference Heymsfeld, Scherzer and Pietrobelli 6 , Reference Gomez-Ambrosi, Silva and Galofre 7 ) and data from a number of studies indicate that BMI often provides a false diagnosis of body fatness( Reference Gomez-Ambrosi, Silva and Galofre 7 , Reference Heo, Faith and Pietrobelli 8 ). The importance of the distribution of body fat in determining health risks of obesity was suggested more than half a century ago and gained convincing evidence in the early 1990s( Reference Ashwell 9 ).
Indices of abdominal obesity are better discriminators of cardiometabolic risk factors than BMI, as shown by many studies( Reference Lee, Huxley and Wildman 10 , Reference Ashwell, Gunn and Gibson 11 ). Waist circumference (WC) is an alternative to BMI for indicating not only obesity risk but also obesity-related disease risk( 12 – Reference Jansen, Katzmarzyk and Ross 14 ), and when coupled with BMI predicts health risk better than BMI alone( Reference Arden, Katzmarzyk and Jansen 15 ). It is used to determine centralized distribution of adipose tissue, but there are differences in body composition between different age groups and races which makes it difficult to define universal cut-off points( Reference Browning, Hsieh and Ashwell 16 ). Waist-to-height ratio (WHtR) is another proxy of central obesity that corrects WC for the height of an individual since WC may over- or underestimate risk for tall or short individuals with similar WC( Reference Browning, Hsieh and Ashwell 16 ). As shown in several studies, WHtR may identify metabolic risk among individuals defined as healthy according to BMI or WC( Reference Srinivasan, Wang and Chen 17 , Reference Li, Chen and Chang 18 ).
So far, studies have not yet been conducted in Serbia to compare anthropometric measures in the determination of obesity. Therefore the aim of the present study was to compare different indicators of obesity in the Serbian adult population.
Methods
Study population
Data for the present study were obtained from the 2013 National Health Survey that was carried out by the Ministry of Health of Serbia and the Institute of Public Health of Serbia ‘Dr Milan Jovanovic Batut’. The study population included adults aged ≥20 years, permanent residents of the Republic of Serbia. Exclusion criteria were age <20 years, persons who lived in collective households and/or institutions, residents of Kosovo and Metohia region (under the UN Mission) and persons who were mentally unable to participate in the survey. Participants with missing data for the required variables were not included in the data analysis.
Sampling design
The National Health Survey 2013 was performed in line with the EUROSTAT recommendations for performance of the European Health Interview Survey (EHIS wave 2 methodological manual)( 19 ). A stratified, two-stage, national-representative random sampling approach was used for the selection of the survey sample. The 2011 Serbian Population Census framework was used for the selection of clusters. Census enumeration areas were defined as primary sampling units and were selected from each of the sampling domains by using systematic probability-proportional-to-size sampling procedures, based on the estimated sizes of the enumeration areas from the 2011 census. The first stage of sampling was completed by selecting the required number of enumeration areas from each of the four regions, from urban and rural areas separately. Four regions were identified in the sample as main strata: Vojvodina, Belgrade, Sumadija and West Serbia, and East and South Serbia. By further division on urban/rural areas a total of eight strata were obtained.
A total of 670 census enumeration areas within each region with probability proportional to size were selected during the first stage. Since the sample frame (2011 census) was not up to date, household lists in all the selected enumeration areas were updated prior to selection of households. Households were selected using a simple random sampling without replacement. The number of households selected in each selected enumeration area was ten, plus three backup households. Backup households were interviewed only if some of the first ten households were not found. If a household refused to be interviewed, a backup household was not contacted. A sample of 6700 households was selected and the household response rate was 64·4 %. All members of the chosen households aged ≥20 years were included. Out of 12 606 adults ≥20 years old in the selected households, 12 460 were interviewed, which yielded a response rate of 98·8 %.
Instruments and variables
Data sources were questionnaires created according to the European Health Interview Survey questionnaire (EHIS questionnaire)( 20 ). Three questionnaires were used: one was a self-administered questionnaire for the population above 15 years of age; the other two, a questionnaire for subjects above 15 years of age and a household questionnaire, were filled by the interviewers. Variables included sociodemographic characteristics (age, sex, region, education, marital status, employment status, type of settlement) and objective findings (weight, height, WC). Participants’ age was categorized into three groups: 20–44, 45–64 and ≥65 years. Marital status was defined in two categories: married/living with partner and living without partner (including unmarried, divorced or widowed); and type of settlement also in two categories (urban and rural). Educational level was defined in three categories: primary or lower (≤8 years), secondary or middle (9–12 years) and post-secondary or high (>12 years, including university and post-university education). Survey participants were divided into three groups according to employment status: employed, inactive (i.e. economically inactive: students, disabled persons, pensioners, housewives) and unemployed.
Measurements
Measurements of weight, height and WC were performed using standard procedures described elsewhere( 21 ). BMI was calculated by dividing body weight by height squared (kg/m2) and categorized according to the WHO criteria: BMI<18·50 kg/m2 was considered as underweight, BMI=18·50–24·99 kg/m2 as normal weight, BMI=25·00–29·99 kg/m2 as overweight and BMI≥30·00 kg/m2 as obesity( 21 ). Abdominal obesity was determined according to WC values. Participants were divided into three groups according to WC value: (i) ≤94 cm for men and ≤80 cm for women; (ii) 94·1–101·9 cm for men and 80·1–87·9 cm for women, considered as overweight; and (iii) ≥102 cm for men and ≥88 cm for women, considered as obese( 12 , Reference Lean, Han and Morrison 22 ). WHtR was calculated as WC (cm) divided by height (cm). The cut-off point of WHtR for discriminating associated risk in a number of different populations is set at 0·5 for both sexes and different ethnic groups( Reference Browning, Hsieh and Ashwell 16 , Reference Ashwell and Hsieh 23 ). WHtR groups were created with the following corresponding value ranges: (i) ≤0·40; (ii) 0·41–0·50; (iii) 0·51–0·60; and (iv) ≥0·61, which represent underweight, normal weight, overweight and obese, respectively( Reference Ashwell, Gunn and Gibson 11 ).
Ethical approval
Approval for the study was obtained from the ethical review boards of all participating institutions: Institute of Public Health of Serbia and Faculty of Medicine, University of Belgrade. All respondents were informed about the purpose of the study and gave written consent to participate.
Statistical analysis
Statistical analyses were carried out on 12 460 participants who had data on BMI. Continuous variables were described with means and standard deviations, categorical variables with frequencies and percentages. Prevalence rates with appropriate 95 % confidence intervals were estimated for the core study outcomes, namely six categories of BMI, three categories of WC and four categories of WHtR, according to BMI, separately for male and female participants. All reported age-adjusted estimates and their 95 % confidence intervals were weighted using probability-sampling weights calculated to reflect the underlying population of inhabitants in the Republic of Serbia in 2013. Variance estimates and confidence intervals reported account for the impact on precision of stratification and sampling weights, using Taylor-series linearization techniques for complex samples. The χ 2 test, Student’s t test, the Mann–Whitney U test, and one-way ANOVA or ANCOVA with post hoc Bonferroni tests were used where appropriate. Pearson’s linear correlation coefficient and linear regression analysis were applied in order to analyse the relationships between BMI, WC and WHtR.
All statistical analyses were performed using the statistical software packages IBM SPSS Statistics Version 21·0 and STATA version 11·1, with the complex sampling design taken into account. Statistical significance was set at two-sided P<0·05.
Results
The study population comprised 12 460 participants, 6007 (48·2 %) men and 6453 (51·8 %) women with a mean age of 48·8 years (Table 1). Participants were more frequently from urban areas (60·2 %), with middle formal education (57·5 %) and married or living with a partner (65·2 %). Out of them 37·2 % were employed, 29·0 % were inactive and 33·8 % were unemployed. According to BMI, 2·4 % were underweight, 36·4 % overweight and 22·4 % obese. When WC and WHtR were used as the measures of adiposity, 22·5 % and 42·8 % respectively were overweight, and 39·8 % and 25·3 % respectively were obese. Men and women differed significantly in all variables observed. Overweight was more frequent in men and obesity in women regardless of adiposity measure used (BMI, WC or WHtR; Table 1).
Table 1 Demographic and anthropometric characteristics, by sex, among adults (n 12 460) aged ≥20 years, Republic of Serbia, 2013
WC, waist circumference; WHtR, waist-to-height ratio
* According to the χ 2 test, Student’s t test or the Mann–Whitney U test, where appropriate.
† Unmarried, divorced or widowed.
‡ Economically inactive (students, disabled persons, pensioners, housewives).
Height, weight, WC and WHtR according to BMI categories are presented in Table 2 for men and in Table 3 for women. Higher means of age were observed for higher BMI categories. The same was true for mean values of weight, WC and WHtR.
Table 2 Height, weight, WC and WHtR according to BMI category adjusted for age among men (n 6007) aged ≥20 years, Republic of Serbia, 2013

WC, waist circumference; WHtR, waist-to-height ratio.
* According to the χ 2 test or ANOVA/ANCOVA where appropriate.
Table 3 Height, weight, WC and WHtR according to BMI category adjusted for age among women (n 6453) aged ≥20 years, Republic of Serbia, 2013
WC, waist circumference; WHtR, waist-to-height ratio.
* According to the χ 2 test or ANOVA/ANCOVA where appropriate.
Correlations between BMI, WC and WHtR were strong (Fig. 1). However, of those who were overweight and obese according to WC, 19·6 % and 3·0 % of men respectively and 56·3 % and 12·2 % of women respectively were in the group with normal BMI. Among those who were overweight and obese according to WHtR, 27·4 % and 1·0 % of men respectively and 34·8 % and 4·0 % of women respectively were in the group with normal BMI. Also, 30·7 % of men with WC≤94 cm and 20·4 % with WHtR of 0·41–0·50, as well as 9·3 % of women with WC≤80 cm and 13·2 % with WHtR of 0·41–0·50, were overweight according to BMI (Tables 2 and 3).
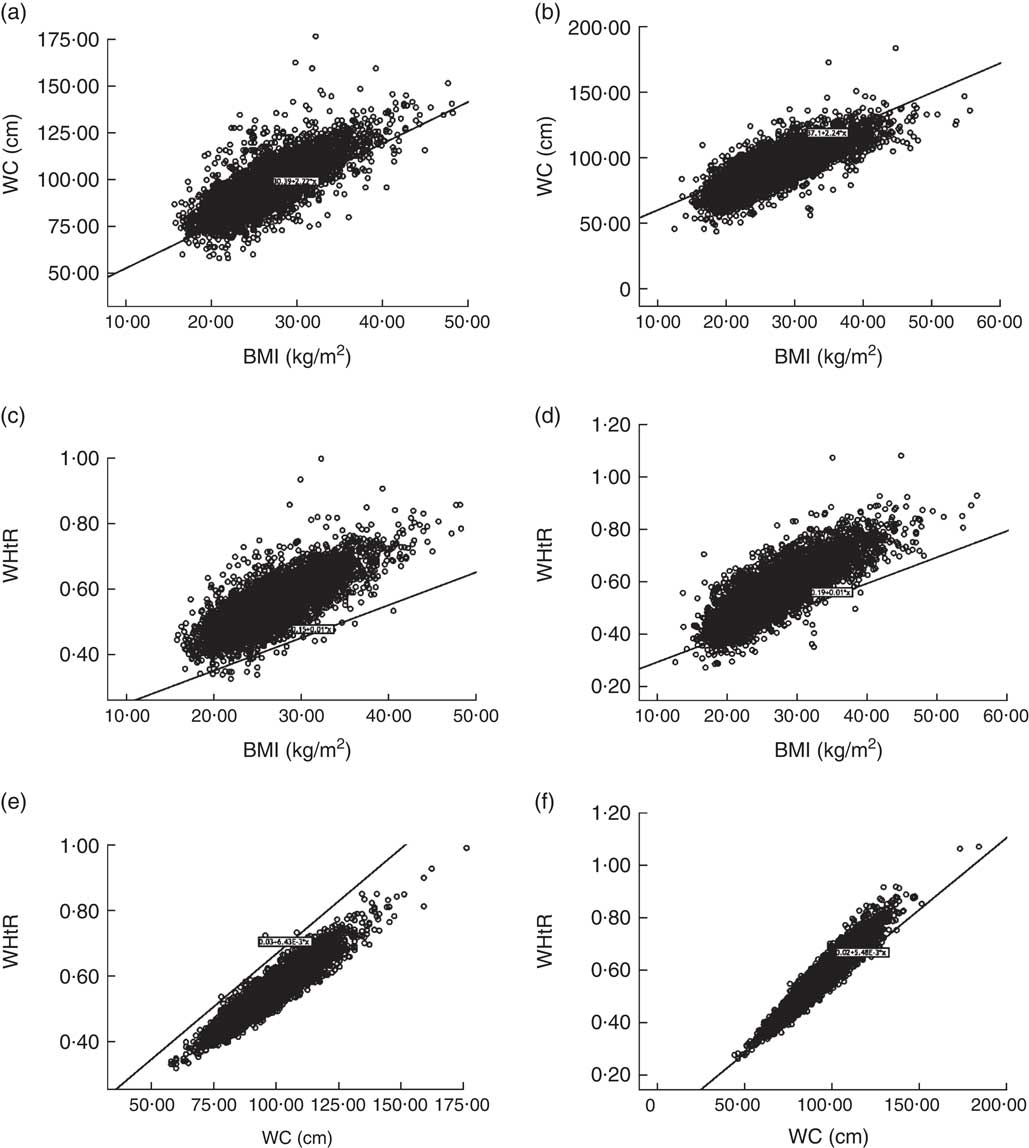
Fig. 1 Correlation between BMI, waist circumference (WC) and waist-to-height ratio (WHtR), by sex, among adults (n 12 460) aged ≥20 years, Republic of Serbia, 2013: (a) WC v. BMI in men (R 2=0·688, y=30·39+2·22x); (b) WC v. BMI in women (R 2=0·605, y=37·10+2·24x); (c) WHtR v. BMI in men (R 2=0·709, y=0·15+0·01x); (d) WHtR v. BMI in women (R 2=0·617, y=0·19+0·01x); (e) WHtR v. WC in men (R 2=0·933, y=0·03+6·43×10–3 x); (f) WHtR v. WC in women (R 2=0·877, y=0·02+5·48×10–3 x)
Discrepancies between BMI, WC and WHtR in the assessment of overweight and obesity were also evident when the age-specific prevalence of adiposity was evaluated (Fig. 2).
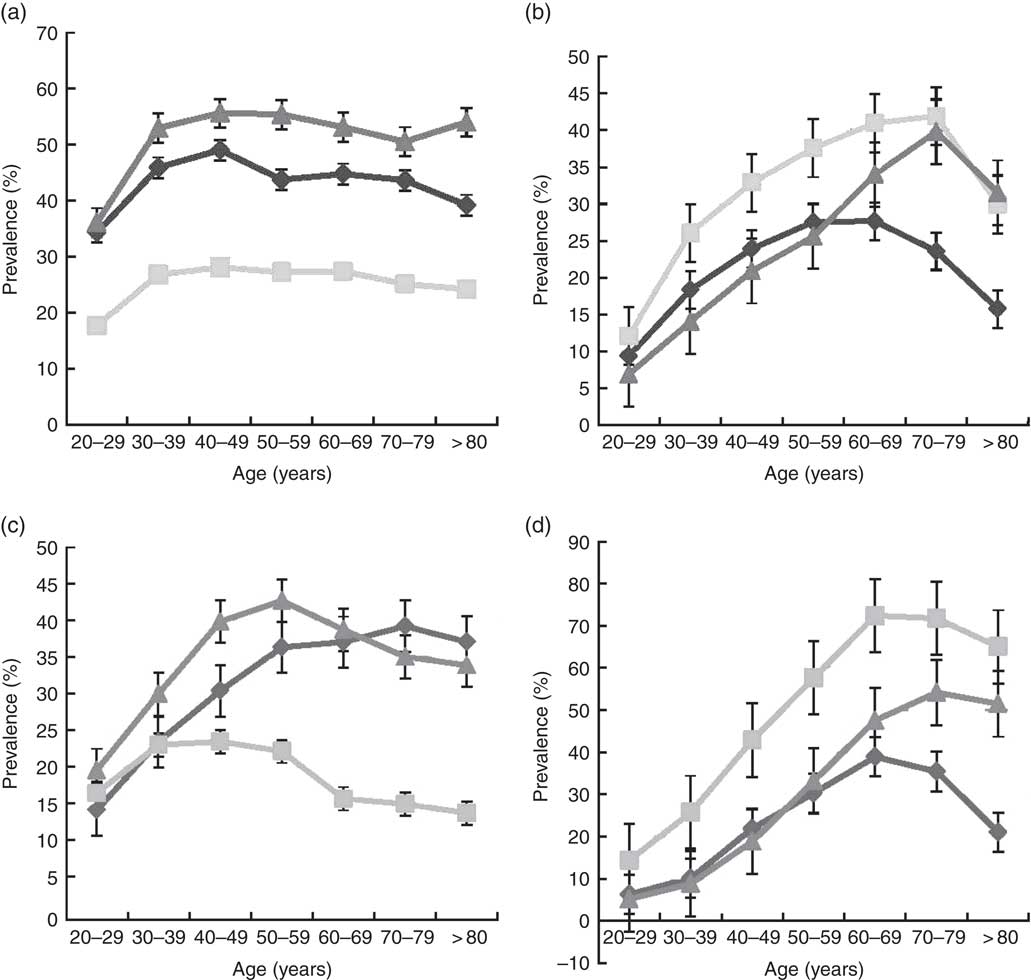
Fig. 2 Age-specific prevalence of overweight and obesity according to criteria based on BMI (![]() ), waist circumference (WC;
), waist circumference (WC; ![]() ) and waist-to-height ratio (WHtR;
) and waist-to-height ratio (WHtR; ![]() ), by sex, among adults (n 12 460) aged ≥20 years, Republic of Serbia, 2013: (a) overweight prevalence among men; (b) obesity prevalence among men; (c) overweight prevalence among women; (d) obesity prevalence among women. Values are means with their standard errors indicated by vertical bars
), by sex, among adults (n 12 460) aged ≥20 years, Republic of Serbia, 2013: (a) overweight prevalence among men; (b) obesity prevalence among men; (c) overweight prevalence among women; (d) obesity prevalence among women. Values are means with their standard errors indicated by vertical bars
Discussion
Given the public health importance of overweight and obesity and their associated health risks, recent research emphasizes the importance of developing methods and criteria to establish an accurate diagnosis( Reference Krakauer and Krakauer 24 ). Therefore there is growing interest in the investigation of different anthropometric and body shape measures to detect general and abdominal obesity. In the present study, in spite of strong correlations between BMI, WC and WHtR, substantial discrepancies between these three measures in the assessment of overweight and obesity were found, especially in some age groups. When BMI and WHtR were used as measures, in both sexes the prevalence of overweight and obesity was similar in those aged <60 years. In older individuals the prevalence of obesity was higher when expressed by WHtR than by BMI. There are suggestions that in older people (≥60 years) BMI is not a proper indicator of obesity( Reference Kyle, Genton and Hans 25 ). In both sexes the prevalence of overweight was the lowest and the prevalence of obesity was the highest when assessed by WC. We did not try other cut-offs for WC, but it might be that its cut-offs should be reconsidered.
BMI is the most widely used indicator of obesity worldwide. According to BMI values, in our study 58·8 % of adults aged ≥20 years were overweight and 22·3 % were generally obese. But BMI has limitations in estimating obesity for some individuals and does not reflect fat distribution in the body( Reference Heymsfeld, Scherzer and Pietrobelli 6 , Reference Gomez-Ambrosi, Silva and Galofre 7 ). Moreover, different studies have proved increased health risks associated with central obesity( Reference Zhu, Wang and Heshka 13 , Reference Arden, Katzmarzyk and Jansen 15 ), consequently resulting in the development of various methods for measuring central adiposity( Reference Song, Jousilahti and Stehouwer 26 ).
WC is generally recommended as the most informative index for abdominal fat distribution and is widely used. We found that mean WC increased with the increase of BMI in both men and women as was found in other surveys( Reference Kamadjeu, Edwards and Atanga 27 , Reference Chinedu, Ogunlana and Azuh 28 ).
Our results show that central type of obesity determined by WC was verified in 31·2 % of men and 48·0 % of women in Serbia. Results from the study of Fu et al. in a Chinese population suggest that 22·2 % of men and 28·1 % of women were generally obese with 65·99 % of men and 65·97 % of women having central obesity( Reference Fu, Luo and Ye 29 ). Among those within the normal range according to BMI there are persons with the incorrect distribution of fat. In the present study, out of those who were overweight and obese according to WC, 19·6 % and 3·0 % respectively, in men, and 56·3 % and 12·2 % respectively, in women, were in the group with normal BMI. Also, 30·7 % among men with WC≤94 cm and 9·3 % among women with WC≤80·0 cm were overweight according to BMI. Krakauer and Krakauer found that cut-offs for large WC are relevant only in the overweight BMI category, while in the category of BMI<25·0 kg/m2 over 90 % were under the cut-off and 90 % of those with BMI above 30·0 kg/m2 were above the cut-off( Reference Krakauer and Krakauer 30 ). In a Brazilian study 32 % of women had WC between 80·0 and 87·9 cm, and 42 % had WC≥88 cm( Reference Rezende, Rosado and Ribeiro 31 ). Among males, 23·9 % had WC between 94 and 101·9 cm, and 22·2 % had WC≥102 cm( Reference Rezende, Rosado and Ribeiro 31 ). Normal-weight men and women with increased WC values are of particular interest due to increased associated health risks of cardiometabolic abnormalities. However, within each BMI category men and women with high WC values are at greater health risk than those with normal WC values( Reference Fu, Luo and Ye 29 ), so the former are in need of health education( Reference Andreenko, Mladenova and Akabaliev 32 ).
In our population, among those who were overweight and obese according to WHtR, 27·4 % and 1·0 % of men respectively and 34·8 % and 4·0 % of women respectively were in the group with normal BMI. At the same time, 20·4 % of men and 13·2 % of women with WHtR of 0·41–0·50 were overweight according to BMI. The study by Andreenko et al. showed that both men and women with normal weight according to BMI values also had normal WHtR values( Reference Andreenko, Mladenova and Akabaliev 32 ). In the present study 77·0 % of men and 81·5 % of women with WHtR values of 0·41–0·50 had normal BMI. Ashwell and Gibson showed that 30 % of men with normal weight according to BMI had WHtR >0·5, while this was the case in 26 % of normal-weight women according to BMI( Reference Ashwell and Gibson 33 ). However, according to the same authors one in ten of the total population and more than 25 % of the normal-weight population according to BMI value had WHtR >0·5 and are at risk due to having central fat distribution( Reference Ashwell and Gibson 33 ). Data from a number of studies have demonstrated that WHtR is superior in identifying cardiometabolic abnormalities to BMI( Reference Lean, Han and Morrison 22 , Reference Ashwell and Hsieh 23 , Reference Andreenko, Mladenova and Akabaliev 32 , Reference Ashwell and Gibson 33 ). A Korean study showed that WHtR has the best predictive value for evaluating the metabolic risk factors compared with BMI or WC alone among individuals with normal BMI and WC( Reference Park and Kim 34 ).
The strength of our study is its representative sample with a high number of participants, as well as the fact that data were not self-reported but were obtained by measurements of body weight, height and WC. The main limitation of the study is that we used only one cut-off for WC, although it is known that it depends on some population characteristics and cannot be universal( Reference Browning, Hsieh and Ashwell 16 ). In addition, overweight and obesity assessed by the three different measures were not related to the diseases for which they are considered to be the risk factors. Furthermore, the study did not include persons who lived in collective households and/or institutions, residents of Kosovo and Metohia region (under the UN Mission) and persons who were mentally unable to participate in the survey.
Conclusion
In the present study discrepancies between BMI, WC and WHtR in the assessment of overweight and obesity were found. Which of these anthropometric measures should be used, or whether two or all three of them should be applied, depends on their associations with cardiovascular or some other disease of interest.
Acknowledgements
Financial support: This research received no specific grant from any funding agency in the public, commercial or not-for-profit sectors. The authors declare that this research received no support in financial or other manner. Conflict of interest: The authors declare that they have no competing interests. Authorship: M.Ž.M. and J.M.G.R. designed and conducted the research. M.Ž.M., J.M.G.R. and J.M.M. analysed data. J.M.G.R. and H.D.V. wrote the paper. N.D.V., M.I.N. and J.M.M. provided feedback on the paper. M.Ž.M., J.M.G.R., H.D.V. and J.M.M. had primary responsibility for the final content. All authors have read and approved the final manuscript. Ethics of human subject participation: The study was approved by the ethical review boards of all participating institutions: Institute of Public Health of Serbia and Faculty of Medicine, University of Belgrade. All respondents were informed about the purpose of the study and gave written consent to participate.


