


Nonalcoholic fatty liver disease (NAFLD), defined as fat accumulation in the liver in people without considerable alcohol intake, is the leading liver complication globally and is one of the main reasons for liver transplant, cirrhosis and hepatocellular carcinoma(Reference Salehi-Sahlabadi, Sadat and Beigrezaei1). The prevalence of NAFLD is growing globally, with an incidence of about 25 % and 30 % in Asian and Western countries, respectively(Reference Vernon, Baranova and Younossi2,Reference Fan, Kim and Wong3) . NAFLD is toughly linked to obesity, metabolic syndrome, insulin resistance, type 2 diabetes mellitus, hypertension and increased risk of mortality(Reference Machado and Cortez-Pinto4). Thus, it is critical to recognise its risk factors and develop effective preventive approaches against NAFLD.
Postprandial hyperglycaemia and hyperinsulinaemia play key roles in the development of NAFLD(Reference Manchanayake, Chitturi and Nolan5,Reference Hashiba, Ono and Hyogo6) . Among dietary components, carbohydrates have a central role in postprandial hyperglycaemia and thus are the chief stimulus for insulin secretion(Reference Sadeghi, Hasani and Mozaffari-Khosravi7). It has been identified that a diet with a high dietary glycaemic index (GI) and glycaemic load (GL), as indicators of carbohydrate quality and quantity, may be associated with an increased risk of NAFLD(Reference Mager, Iñiguez and Gilmour8). Nevertheless, postprandial insulin concentrations are not always proportionate to blood glucose levels, and other dietary factors, including some amino acids, fructose and certain fatty acids can influence the insulinogenic impacts of foods(Reference Teymoori, Farhadnejad and Moslehi9). Certain foods with high amounts of fat and protein might induce a significant insulin release, despite a minor increase in glucose concentrations(Reference Holt, Miller and Petocz10). Therefore, GI and GL have inadequate capacity for precise evaluation of insulin responses of all dietary components(Reference Anjom-Shoae, Shayanfar and Mohammad-Shirazi11). Recently, dietary insulin index (DII) and dietary insulin load (DIL) have been developed for this purpose. The DII measures the amount of postprandial insulin secretion after consumption of each food in comparison with an isoenergetic portion of a reference food (white bread or glucose). DIL is calculated by multiplying the DII of each food by its energy content and the consumption frequency(Reference Mirmiran, Esfandiari and Bahadoran12). Unlike glycaemic scores, insulin indices are calculated according to the calorie contents of food items and directly evaluate the postprandial insulin secretion in response to the composite meals irrespective of the macronutrient compositions of diet, even for carbohydrate-free food items, providing an accurate tool to explore diet–disease relationships because insulin index is directly based on insulin response(Reference Teymoori, Farhadnejad and Mirmiran13).
Epidemiological studies have revealed that adherence to a diet with a high DII and DIL is related to metabolic disorders, such as metabolic syndrome(Reference Sadeghi, Hasani and Mozaffari-Khosravi7), insulin resistance(Reference Mirmiran, Esfandiari and Bahadoran12), hyperlipidaemia(Reference Nimptsch, Brand-Miller and Franz14), obesity(Reference Anjom-Shoae, Keshteli and Sadeghi15) and inflammation(Reference Mozaffari, Namazi and Larijani16). Despite this, evidence regarding the relations of DII and DIL to NAFLD is very rare. Therefore, the present study aimed to explore the relations of DII and DIL to NAFLD among a large population of Iranian adults.
Methods and materials
Participants
A total of 3158 subjects, aged 40·57 ± 8·25 years, were included in this cross-sectional study. From April 2016 to December 2019, participants were randomly selected with the use of a convenience sampling approach among patients referred to a university-affiliated nutrition counselling centre in Tehran, Iran. The inclusion criteria were age ≥18 years and no history of considerable alcohol consumption (< 20 g/d for females and < 30 g/d for males). Individuals were excluded in case of the presence of diseases, such as diabetes mellitus, thyroid disorders, hepatic disease, malignancy and consumption of blood sugar/lipid lowering or chemotherapy drugs, which affect metabolic status. Individuals who used dietary supplements or followed a weight loss diet during the last 3 months were also excluded. A written informed consent was obtained from all participants. The study protocol was based on the Helsinki Declaration and was approved by the Ethics Committee of Fasa University of Medical Sciences (IR.FUMS.REC. 1396·230).
Demographic, anthropometric and clinical measurements
Demographic data such as age, sex, education, disease history, as well as drug use and smoking were obtained using a self-administer questionnaire. The height of participants was determined using a stadiometer with a precision of 0·1 cm. Weight was measured by a digital scale with a precision of 0·1 kg (Seca 767, Japan). BMI was calculated as weight (kg)/square of height (m2). Waist circumference (WC) was assessed by measuring the midway area between the iliac crest and the lower edge of the lowest rib. Moreover, the level of physical activity was assessed using a validated version of the International Physical Activity Questionnaire and reported as the metabolic equivalent per day (MET/day)(Reference Moghaddam, Aghdam and Jafarabadi17).
For all participants, 10 ml of peripheral blood was obtained after 12 h of overnight fasting. The blood samples were centrifuged at 2500 rpm for 6–8 min to separate serum. Serum fasting blood glucose (FBS), fasting insulin, alanine aminotransferase (ALT), gamma-glutamyl transferase, aspartate aminotransferase, TAG, HDL and total cholesterol (TC) were assessed by an enzymatic approach with the use of the Pars Azmoon Commercial kits. The concentration of LDL was estimated using the Friedewald formula(Reference Scharnagl, Nauck and Wieland18). Homeostasis model assessment formula for insulin resistance (HOMA-IR: (FBS (mg/dl) × fasting insulin (mU/ml))/405) and homeostasis model assessment formula for β-cell function (HOMA-B%: (360 × fasting insulin (mU/ml))/FBS (mg/dl) - 63) were used to evaluate insulin resistance and beta cell activity, respectively(Reference Moameri, Akbarzade and Khamisi19). After 15 min of rest, systolic blood pressure and diastolic blood pressure were assessed twice (sphygmomanometer, mercury, ALPK1, Japan), with a 15-minute interval, and the mean of the two measurements was recorded as the blood pressure of the subjects.
The diagnosis of NAFLD was based on the fatty liver index (FLI), as described previously(Reference Bedogni, Bellentani and Miglioli20) using the following formula:
 $$\eqalign{ & {\rm{FLI}} = {\rm{ }}\left( {{{\rm{e}}^{(0.953 \times {\rm{ln}}\left( {{\rm{TG}}} \right) + 0.139 \times {\rm{BMI}} + 0.718 \times {\rm{ln}}\left( {{\rm{GGT}}} \right) + 0.053 \times {\rm{WC}}-15.745)}}} \right)/ \cr & \,\,\,\,\,\,\,\,\,\,\,\,\,\left( {1 + {{\rm{e}}^{(0.953 \times {\rm{l n}}\left( {{\rm{TG}}} \right) + 0.139 \times {\rm{BMI}} + 0.718 \times {\rm{ln}}\left( {{\rm{GGT}}} \right) + 0.053 \times {\rm{WC}}-15.745)}}} \right) \cr & \,\,\,\,\,\,\,\,\,\,\,\,\,\,\,\,\, \times 100 \cr} $$
Then, the confirmation of a gastroenterologist using a fibroscan was required to consider patients as NAFLD. The FLI score of lower than < 30 was defined as a normal liver, the scores of 30–59 were considered as having intermediate FLI and the score of ≥ 60 was considered as the cut-off point of having NAFLD(Reference Bedogni, Bellentani and Miglioli20).
Dietary assessment and the calculation of DIL and DII
The common food intake of subjects over the previous year was evaluated with the use of a validated 168-item FFQ(Reference Esfahani, Asghari and Mirmiran21). An expert dietitian completed FFQ and asked the participants to report the frequency of intake (daily, weekly or monthly) and amount of intake according to standard portion sizes of food items based on the household measures usually used by Iranians through a face-to-face interview. Then, portion sizes of food items were converted to grams/day. The daily intakes of energy and nutrients were computed with the use of the United States Department of Agriculture database using the Nutritionist IV software modified for the Iranian food. The test procedure of DII is provided by the study of Brand-Miller et al. (Reference Holt, Miller and Petocz10). Briefly, DII is defined as the incremental insulin AUC over 2 h following the ingestion of a 1000-kJ portion of the food item divided by the AUC after intake of a 1000-kJ portion of the reference food (glucose). In the present study, DII for fifty-nine food items available in the FFQ (see online supplementary material, Supplemental Table S1) was obtained based on the DII from studies by Sadeghi et al. (Reference Sadeghi, Hasani and Mozaffari-Khosravi7), Bao et al. (Reference Bao, Atkinson and Petocz22) and Bell et al. (Reference Bell, Petocz and Colagiuri23). To compute DII of the diet, we first calculated DIL of the diet. The insulin load of each food item was computed by multiplying the insulin index of that food item by energy content and the frequency of the consumption of that food item: (insulin index of that food × kilocalories per serving × servings per day). Then, insulin loads of all food items were summed up to obtain the DIL of the whole diet. Each unit of DIL represents the equivalent insulin response generated by 1 kcal of glucose. The DII for the whole diet, which is the weighted mean of insulin index values for each of the component foods, was computed as DIL/total energy intake(Reference Sadeghi, Hasani and Mozaffari-Khosravi7,Reference Holt, Miller and Petocz10) .
Statistical analysis
The normality of data was measured using the Kolmogorov–Smirnov test and data followed a normal distribution. The participants were categorised according to the DII and DIL quartiles. The one-way ANOVA and I 2 tests were applied to examine the difference in quantitative and qualitative variables among the DII and DIL quartiles, respectively. Data were presented as mean ± sd or frequency (percent) for quantitative and categorical variables, respectively. The binary logistic regression analysis was used to calculate the OR and 95 % CI for the links of DII and DIL to the risk of NAFLD according to the three models. Model 1 was a crude model without an adjustment for the covariates; model 2 was controlled for sex, dietary energy intake and age; model 3 included covariates adjusted for in model 2 plus smoking status, level of education and physical activity and model 4 included covariates adjusted for in model 3 plus BMI. All statistical tests were carried out with the use of SPSS (version 23) and P values <0·05 were considered as statistically significant.
Results
Among 3158 people (46·7 % male) participating in this study, a total of 943 (29·9 %) individuals (21·59 % in males and 33·74 % in females) were diagnosed to have NAFLD. The scores of DII and DIL ranged from 35·93 to 126·92 and 372·02 to 1302·15, respectively. The mean ages of NAFLD patients and healthy subjects were 42·26 ± 8·19 and 39·86 ± 8·17, respectively. The mean BMI was 27·35 ± 3·85 in healthy individuals and 28·14 ± 3·96 in NAFLD patients. The mean DII and DIL were 78·21 ± 19·75 and 784·06 ± 192·35, respectively. The basic characteristics of participants across quartiles of DII and DIL are presented in Tables 1 and 2, respectively. Subjects in the higher quartiles of DII and DIL had a higher prevalence for NAFLD and had higher age, energy intake, weight, height, BMI, waist circumference, FBS, fasting insulin, HOMA-IR, HOMA-B, LDL, TAG, TC, systolic blood pressure, diastolic blood pressure and liver enzymes (ALT, AST, GGT) but lower levels of physical activity, HDL and frequency of females (P < 0·05). Subjects with higher scores for DII and DIL had significantly higher intakes of energy and refined grains but consumed lower amounts of whole grains, legumes, processed meats, nuts, dairies, vegetables, fruits and red meat (P < 0·001) (see online supplementary material, Supplemental Table S2). Among different food groups, based on the Pearson’s correlation coefficient, refined grains had the highest positive correlation with DII (r = 0·51, P < 0·001) and DIL (r = 0·26, P < 0·001), while fruits and dairies had the highest negative correlation with DII (r = –0·52, P < 0·001) and DIL (r = –0·23, P < 0·001) (see online supplementary material, Supplemental Table S3).
Table 1 Demographic characteristics of participants across quartiles of dietary insulin index

Data are presented as mean ± sd or frequency (percent).
* Obtained from the one-way ANOVA or Chi-squared tests, where appropriate.
NAFLD, non-alcoholic fatty liver disease; FBS, fasting blood glucose; HOMA-IR, homeostatic model assessment for insulin resistance; HOMA-B, homeostatic model assessment for β-cell function; LDL, low-density lipoprotein; HDL, high-density lipoprotein; TC, total cholesterol; SBP, systolic blood pressure; DBP, diastolic blood pressure; ALT, alanine transaminase; AST, aspartate transaminase; GGT, gamma-glutamyltransferase.
Table 2 Demographic characteristics of participants across quartiles of dietary insulin load

Data are presented as mean ± sd or frequency (percent).
* Obtained from the one-way ANOVA or Chi-squared tests, where appropriate.
NAFLD, non-alcoholic fatty liver disease; FBS, fasting blood glucose; HOMA-IR, homeostatic model assessment for insulin resistance; HOMA-B, homeostatic model assessment for β-cell function; LDL, low-density lipoprotein; HDL, high-density lipoprotein; TC, total cholesterol; SBP, systolic blood pressure; DBP, diastolic blood pressure; ALT, alanine transaminase; AST, aspartate transaminase; GGT, gamma-glutamyltransferase.
Multivariable-adjusted odds ratios and corresponding 95 % CI for NAFLD among quartiles of DII and DIL for the total population, females and males are reported in Table 3. After controlling the analysis for the potential covariates, including sex, age, dietary energy intake, BMI, smoking status, physical activity and education levels, a significant direct relationship was found between DII (OR: 2·43, 95 % CI = 1·75, 3·37; P-trend = ≤0·001) and DIL (OR: 1·87, 95 % CI = 1·33, 2·63; P-trend ≤0·001) with the risk of NAFLD in people with the highest adherence, compared with those in the lowest quartile. In the subgroup analysis by sex, DII was a significant predictor for NAFLD in males (OR: 2·74, 95 % CI = 1·75, 4·31; P-trend = ≤0·001) and females (OR: 2·26, 95 % CI = 1·39, 3·69; P-trend = 0·005). A significant relationship was also detected between DIL and NAFLD for females (OR: 2·90, 95 % CI = 1·70, 4·93; P-trend ≤0·001). For males, the association of DIL with NAFLD disappeared in the fully adjusted model (OR: 1·33, 95 % CI = 0·84, 2·10; P-trend = 0·13), but it was significant when adjusted for age, sex and daily energy intake (OR: 1·75, 95 % CI = 1·18, 2·59; P-trend = 0·001) (Table 3).
Table 3 Logistic regression analysis for the association of dietary insulin index and dietary insulin load with the risk of NAFLD in the whole population (N 3158), males (N 1476) and females (N 1682)
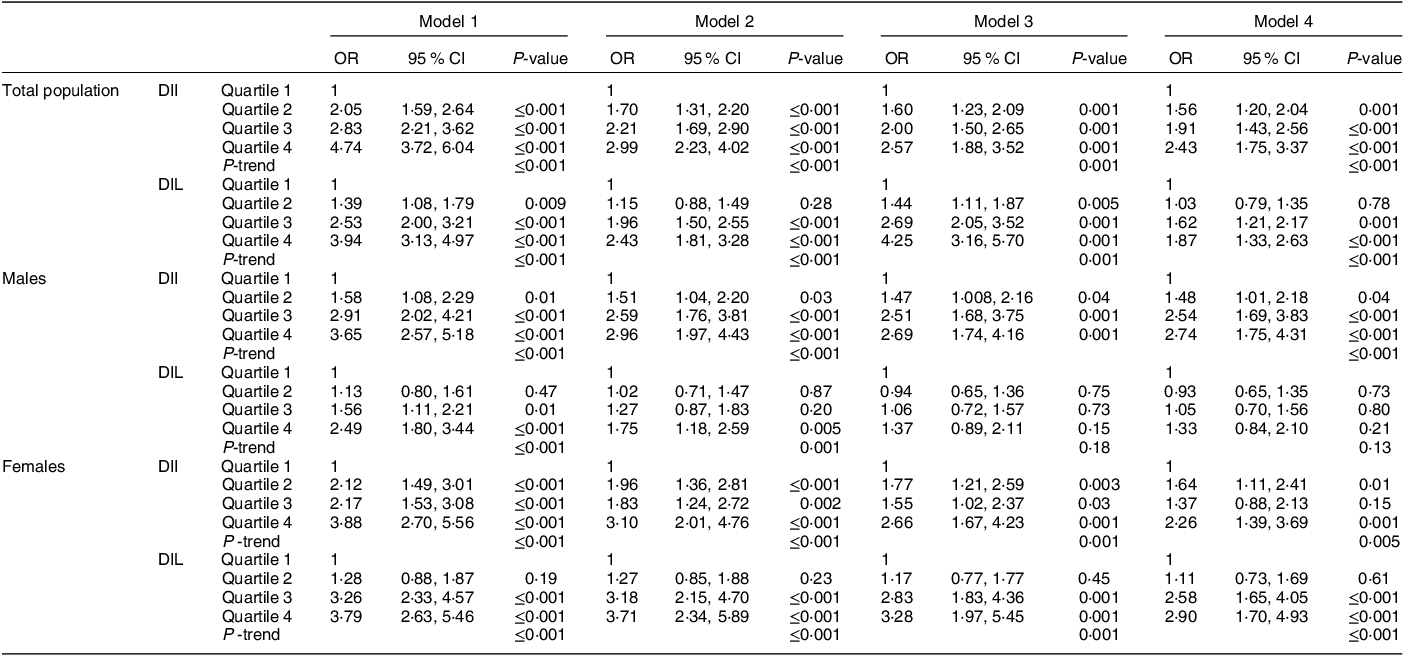
NAFLD, non-alcoholic fatty liver disease; DII, dietary insulin index; DIL, dietary insulin load.
Model 1: crude analysis.
Model 2: adjusted for age, gender and daily energy intake.
Model 3: additional adjustment for smoking, level of education and physical activity.
Model 4: additional adjustment for BMI.
Discussion
The present study was carried out to explore the associations of DII and DIL to the odds of NAFLD. The results revealed that adherence to a diet with a high DII was positively related to a greater risk of NAFLD in men and women. Moreover, DIL was directly linked to NAFLD in women, although no significant relationship was found for DIL in men.
In line with the present study, a case–control study by Fatahi et al. on 369 adults (200 healthy and 169 NAFLD people)(Reference Fatahi, Sohouli and Rayi24), as the only available evidence in this area of research, reported that having a diet with a higher DII is related to increased risk of NAFLD after controlling the potential covariates. The study by Fatahi et al. (Reference Fatahi, Sohouli and Rayi24) was limited by its low sample size and lack of subgroup analysis based on the gender of participants. Moreover, the relation of DIL to NAFLD was not investigated in the Fatahi et al. (Reference Fatahi, Sohouli and Rayi24) study. In this line, recent studies have identified that higher DII and DIL are the predictors of unfavourable metabolic changes associated with NAFLD, such as metabolic syndrome(Reference Sadeghi, Hasani and Mozaffari-Khosravi7), diabetes(Reference Teymoori, Farhadnejad and Moslehi9), obesity(Reference Anjom-Shoae, Namazi and Ayati25), increased serum TAG and reduced serum levels of HDL(Reference Nimptsch, Brand-Miller and Franz14). There are some mechanisms explaining the relations of DII and DIL to the odds of NAFLD. Food items with high insulinemic potential are quickly absorbed and transformed into glucose, resulting in a quick elevation in circulating insulin and glucose and then a quick reduction in glucose excursion(Reference Sadeghi, Hasani and Mozaffari-Khosravi7). This rapid reduction in circulating glucose may decrease satiety and trigger hunger, resulting in excessive energy consumption(Reference Sadeghi, Hasani and Mozaffari-Khosravi7), which is linked to greater odds for NAFLD(Reference Harrison and Day26). A diet with a high DII and DIL is closely associated with hyperinsulinaemia, which is a potential contributor to inflammation(Reference Zhang, Wellberg and Kopp27), oxidative stress(Reference Kyselova, Zourek and Rusavy28) and the accumulation of TAG in hepatocytes(Reference Mishra, Yadav and Gupta29). DII has been recognised as a risk factor for insulin resistance (IR)(Reference Mirmiran, Esfandiari and Bahadoran12), resulting in dysregulation in glucose metabolism and increased release of free fatty acids through dysregulated lipolysis that further accentuates the impairment in insulin signalling. Under such metabolic changes, increased circulating glucose due to IR could be converted to fat, which ultimately accumulates in the liver, predisposing people to the development of NAFLD(Reference Fatahi, Sohouli and Rayi24). Moreover, IR increases the levels of liver enzymes(Reference Bonnet, Ducluzeau and Gastaldelli30) and increases inflammation(Reference Shimobayashi, Albert and Woelnerhanssen31) and oxidative stress(Reference Shimobayashi, Albert and Woelnerhanssen31), playing a role in the development of NAFLD.
In this study, the significant direct relationship between NAFLD and DIL was identified in females but not in males. The underlying mechanism for this sex difference in the association is unclear; nevertheless, it may be explained by the impact of gonadal hormones on body fat storage, appetite and the metabolism of lipids(Reference Palmisano, Zhu and Eckel32–Reference Lovejoy, Sainsbury and Group34). Fat accumulation in the liver could be influenced by gonadal steroids; lower testosterone concentration is related to increased risk of NAFLD in males and lower risk of NAFLD in females(Reference Jaruvongvanich, Sanguankeo and Riangwiwat35). While there is no direct evidence showing how testosterone concentration can affect the association between DII and NAFLD risk, diets with high DII may affect serum concentration of testosterone; it has been suggested that higher serum testosterone concentration in women is associated with insulin resistance(Reference Patel, Ratcliffe and Reilly36), which is closely associated with NAFLD. Future studies are required to explore the underlying mechanisms for the possible effect of testosterone on the relation of DII to NAFLD risk. Moreover, the difference in circulating adipokines, such as leptin and adiponectin among females and males may be involved in this sex disparity(Reference Sadeghi, Hasani and Mozaffari-Khosravi7,Reference Rosenbaum and Leibel37,Reference Christen, Trompet and Noordam38) . Evidence has suggested that men and women have different patterns in adipokine secretion due to their differences in fat distribution(Reference Karastergiou, Smith and Greenberg39). For example, serum leptin levels are about two times higher in women than in men even when controlling for BMI(Reference Hickey, Israel and Gardiner40). Adipokines play a key role in the regulation of steatosis and NAFLD(Reference Jarrar, Baranova and Collantes41). Diets with high DIL affect NAFLD through hyperinsulinaemia(Reference Mishra, Yadav and Gupta42). On the other side, higher concentrations of insulin induce leptin secretion(Reference Kolaczynski, Nyce and Considine43). Hyperleptinemia, or persistently high levels of leptin, has been associated with the development of NAFLD(Reference Jiménez-Cortegana, García-Galey and Tami44). Accordingly, higher diets with DIL may result in a greater increase in leptin levels in women than in men, thereby increasing their odds of NAFLD.
In the current study, the mean DII and DIL values were 78·21 ± 19·75 and 784·06 ± 192·35, respectively. In the Nurses’ Health Study on 28 909 from 11 U.S. states, the mean DII (44·40) was lower than the present study, but the mean value for DIL was 702·66, which was comparable with our study(Reference Prescott, Bao and Viswanathan45). The mean of DII and DIL (DII: 51·7 ± 6·5; DIL: 235·8 ± 90·2) of participants in the study by Teymoori et al. were relatively lower compared with our study(Reference Teymoori, Farhadnejad and Mirmiran13). In a study in Afghanistan by Amiry et al., the median DII was 50·75(Reference Amiry, Barekzai and Aminianfar46); in contrast, the median value of DIL in the population of Afghanistan was 143 792·5(Reference Amiry, Barekzai and Aminianfar46), which is greater than that seen in the present study. This difference might be due to differences in dietary patterns, type and the number of food items used to calculate DIL, as well as the method used to compute DIL/DII in various studies. Moreover, differences in the type of dietary assessment method may be another reason for differences in the DIL values in various studies.
This is the largest study investigating the link of DII and DIL to NAFLD. The relatively large sample size, the use of a validated FFQ for the assessment of food intake, a sex-stratified analysis and the use of sensitive diagnostic factors such as FLI and fibroscan and confirming the diagnosis of NAFLD by a gastroenterologist are among the strengths of this study. Furthermore, the participants were selected by random sampling of subjects who were referred to nutrition centres, minimising the likelihood of selection bias. Some limitations of the current study should be taken into consideration. First, because of the cross-sectional nature of this study, causality is not inferable, and it is unclear whether DIL and DII change the odds of NAFLD or the disease affects dietary preferences. Thus, prospective investigations are required to confirm our results. Second, despite adjustments for potential covariates, the residual effects of unmeasured/unknown covariates may affect the results. Third, the FFQ is prone to potential reporting biases, such as recall bias, which may influence the findings. Finally, since the DII values for several foods in the FFQ were not available in the database, the DII of similar food items were used for items that were not available in the reference list. Accordingly, additional DII testing is needed to confirm our results.
In conclusion, this study revealed that greater adherence to a diet with a high DII and DIL might be linked to a higher risk of NAFLD in women. In addition, DII was also positively related to increased odds of NAFLD in men. The results of the current study might be useful for healthcare providers to design appropriate preventive measures for people at risk of NAFLD. Additional research, in particular with a prospective cohort design, is required to establish these conclusions.
Acknowledgements
The authors appreciate all the people who patiently contributed to this study.
Financial support
The study was financially supported by Fasa University of Medical Sciences, Fasa, Iran (IR.FUMS.REC. 1396·230).
Conflict of interest
There are no conflicts of interest.
Authorship
Conceptualization: A.M., S.A. Methodology: S.O., R.H., S.A., T.R. Software: A.M., S.A. Data curation: T.R., R.H., S.A. Writing (original draft): A.M., S.A. Writing (review and editing): R.H., S.O. All authors read and approved the final manuscript.
Ethics of human subject participation
This study was conducted according to the guidelines laid down in the Declaration of Helsinki, and the protocol of the study was Ethics Committee of Fasa University of Medical Sciences, Fasa, Iran (IR.FUMS.REC. 1396·230). Written informed consent was obtained from all participants.
Supplementary material
For supplementary material accompanying this paper visit https://doi.org/10.1017/S1368980024001149


 Open access