


Goitre is a common clinical disorder during childhood and adolescenceReference Dreimane and Varma1. The World Health Organization (WHO) established the criteria for determining goitre prevalence in 1960Reference Perez, Scrimshaw and Munoz2, and revised and simplified these in 1994. Goitre was defined as any enlarged thyroid gland that is palpable and/or visible3. Palpation used to be the only method available for defining thyroid volume, but now ultrasonography is considered the most reliable method for the estimation of thyroid volumeReference Delange4. Goitre prevalence in school-aged children is one of the main indicators of iodine deficiency in a populationReference Zimmermann, Hess, Adou, Toresanni, Wegmuller and Hurrell5. In areas of mild iodine deficiency, ultrasound is preferable to physical examinationReference Busnardo, Nacamulli, Frigato, Vianello-Dri, De Vido and Mian6; however, because portable ultrasound equipment is not always readily available, especially in developing countries, palpation may be the only method for goitre detection.
Protein–energy malnutrition (PEM) is characterised not only by energy deficit due to reduced intake of all macronutrients, but also by deficits in many micronutrientsReference Schuftan, Ramalingaswami and Levinson7. If an increased goitre rate in childhood indicates iodine deficiency disorders (IDD), which is a micronutrient malnutritionReference Zimmermann, Hess, Adou, Toresanni, Wegmuller and Hurrell5, it should be associated with generalised PEM. Additionally, similar to PEM, goitre prevalence is higher among children of low socio-economic statusReference Joshi, Mishra, Bhatnagar, Singh, Garg and Chopra8, Reference de Onis, Blossner, Borghi, Morris and Frongillo9. Child malnutrition is an important indicator for monitoring progressReference de Onis, Blossner, Borghi, Morris and Frongillo9. In addition, normalisation of the goitre rate probably indicates the disappearance of IDD as a public health problemReference Zimmermann, Hess, Adou, Toresanni, Wegmuller and Hurrell5. In the present study we evaluated growth parameters, socio-economic status and palpable goitre rate of prepubertal and pubertal children attending primary schools in an urban area of Turkey. Therefore, we planned to determine the relative contribution of nutrition, assessed by anthropometric indices, and socio-economic status on the rate of goitre detection by clinical evaluation in schoolchildren.
Study design and methods
Setting, sample selection and participants
This study was undertaken among schoolchildren from the province of Manisa, situated in the west of Turkey. Manisa is located in an area of mountains although it is close to the sea (approximately 50 km). Sampling was carried out in different stages to guarantee representativeness of the whole geographic area. The study was carried out in state primary schools. Schools were chosen from high and moderate socio-economic regions, slum and village areas. One primary school from each of the four different socio-economic levels was chosen at random for participation in the study. Eight classes were selected from each school. Children present in all 32 classes were included in the study group, which consisted of 1018 children. Students in state schools who come from various socio-economic backgrounds reflect Manisa's population better than the students in private schools. Permission was obtained from the Ministry of Education before commencing the study.
Data collection
First we identified sociodemographic features of the students. A questionnaire was administered to the children. Education and occupation of the parents were asked of each child and the answers were confirmed by the school directors. Clinical examination for goitre was performed by an expert endocrinologist using the traditional recommended method of palpation. Grading of goitre was done according to the criteria recommended by Perez et al. (0, thyroid not palpable; IA, thyroid palpable and larger than the distal phalanx of the subject's thumb; IB, goitre palpable and visible only with full neck extension; II, visible goitre with the neck in normal position)Reference Perez, Scrimshaw and Munoz2. Weight was measured to the nearest 0.5 kg using a balance beam scale and height was measured to the nearest 0.1 cm with a manual height board. Body mass index (BMI; kg m− 2) was used as an index of relative weight. Weight-for-height (W/H) was calculated. Height and weight standard deviation scores (Z-scores) were calculated according to Turkish national standards, BMI Z-scores were calculated according to international standards. W/H Z-score was not calculated because the standards are given for up to 5 years of age.
The nutritional status of children was evaluated according to height and weight Z-scores. Z-score deficits (below minus two standard deviations, < –2SD) indicate the presence of two indicators of PEM: stunting and underweight. A low height-for-age Z-score (HAZ) ( < –2SD) indicates stunting (stunted growth) and reflects failure to reach linear growth potential as a result of suboptimal health and/or nutritional conditions. A low weight-for-age Z-score (WAZ) ( < –2SD) is considered to indicate underweight in the absence of significant wasting10–Reference de Onis and Blüssner12. In addition, BMI values less than 15 kg m− 2 indicate total body fat content below 5% of body weight. That BMI is an important index of being thin was interpreted in children over 10 years of ageReference Brahmbhatt, Brahmbhatt and Boyages13.
Categorisation of socio-economic status according to the Hollingshead index was based on the occupation and education of parentsReference Hollingshead14. Socio-economic level was classified according to five educational categories and five occupational categories. A score of 0 was given to the lowest level of education and occupation and a score of 4 was given to the highest. Hollingshead scoring was modified according to national Turkish standards. Four socio-economic classes were identified ranging from lowest to highest on the basis of the sum of scores.
Statistical analysis
Data are presented as percentages, percentiles, means and Z-scores. Hypothesis contrast of continuous variables was made by the t-test for two comparisons. For qualitative variables, association was measured by the chi-square test. The Kruskal–Wallis test, Mann–Whitney U-test, one-way analysis of variance and Bonferroni analysis were used for comparisons between different socio-economic groups. Logistic regression was used to evaluate the association between anthropometric indices, socio-economic status and goitre detected by palpation.
Results
Mean age of the children was 11.19 ± 1.30 years (range 5.8–16.8 years). Fifty-one per cent (519) of the children were male, 49% female. According to education and occupational level of their parents, students were included in very low (21.7%), low (22.8%), middle (21.6%) or high (33.9%) socio-economic status categories.
Frequency of goitre detected by palpation was 8.0% (81). Grading revealed that 67.9% (55) of these were grade IA, 29.6% (24) were IB and only 2.5% (2) were grade II. We detected palpable goitre in 8.6% of girls, 7.3% of boys. Goitre was more common in girls but not significantly so (P = 0.488).
HAZ and WAZ of children who had goitre were not significantly different from those of children who did not have goitre (P>0.05). However, BMI Z-score and W/H were significantly lower in children who had goitre by palpation than in children without goitre (P < 0.05) (Table 1). Anthropometric evaluation of the children revealed that 7.5% were stunted, 4.1% were underweight. Rate of goitre detection by palpation was higher in patients who were stunted and underweight, but the difference was not statistically significant (P>0.05) (Table 2).
Table 1 Anthropometric indices of the total population and children with and without palpable goitre
SD – standard deviation; HAZ – height-for-age Z-score; WAZ – weight-for-age Z-score; BMI – body mass index; W/H – weight-for-height.
* Student's t-test, significance defined as P < 0.05.
Table 2 Frequencies of stunting, underweight and wasting among children with and without palpable goitre
HAZ – height-for-age Z-score; WAZ – weight-for-age Z-score; BMI – body mass index.
* Chi-square test, significance defined as P < 0.05.
The rate of detection of palpable goitre was significantly higher in children with low socio-economic status (P < 0.05) (Fig. 1) (χ2 for trend = 5.714, P = 0.016, odds ratio (OR) = 1.78). Evaluation of all children revealed that the frequency of stunting was significantly higher in children with low and very low socio-economic status (P = 0.0001). Similarly, the frequency of underweight was significantly higher in these children (P = 0.0004, OR = 3.1). Underweight (BMI < 15 kg m− 2) was significantly more frequent in children with low socio-economic status than in children with middle and high socio-economic status (P = 0.007) (Fig. 2).
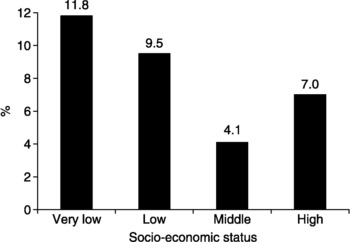
Fig. 1 Goitre rate in children according to socio-economic status. Frequency of palpable goitre was significantly higher in children with low socio-economic status (P = 0.001)
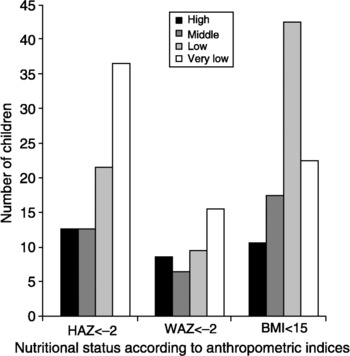
Fig. 2 Distribution of children who were stunted, underweight and wasted according to socio-economic status. Stunting (height-for-age Z-score (HAZ) < –2) was significantly higher in children with very low socio-economic status; thinness (wasting) (body mass index (BMI) < 15 kg m–2) was significantly higher in children with low socio-economic status; and underweight (weight-for-age Z-score (WAZ) < –2) was generally uncommon but significantly higher in children with very low socio-economic status
Among children with palpable goitre, HAZ and BMI Z-scores did not change according to socio-economic status but WAZ values were significantly higher in children with high socio-economic status (P = 0.008 and 0.001, respectively). All anthropometric indices in children without palpable goitre differed significantly between those with high and very low socio-economic status (Table 3). The frequency of stunting or underweight did not differ significantly according to socio-economic status in children with palpable goitre (P>0.05). Similar to the whole population, among children without palpable goitre being stunted and underweight was significantly more common in those with low and very low socio-economic status (P < 0.0001 and 0.0126 respectively, OR = 3.03). The frequency of being underweight according to BMI was significantly different between children with different socio-economic status (P < 0.0001) (Table 4).
Table 3 Anthropometric indices among children with and without palpable goitre according to socio-economic status
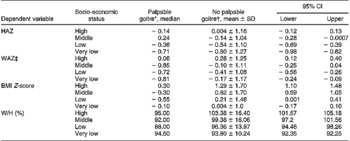
SD – standard deviation; CI – confidence interval; HAZ – height-for-age Z-score; WAZ – weight-for-age Z-score; BMI – body mass index; W/H – weight-for-height.
* Kruskal–Wallis test.
† One-way analysis of variance.
‡ Mann–Whitney U-test, P = 0.001.
Table 4 Frequency of palpable goitre in children who are stunted, underweight or wasted and in children with normal nutritional status according to socio-economic status
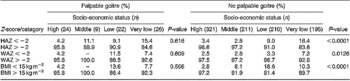
HAZ – height-for-age Z-score; WAZ – weight-for-age Z-score; BMI – body mass index.
According to the results of logistic regression analysis, the most important parameters affecting the rate of palpable goitre were identified as BMI Z-score, WAZ, W/H and socio-economic status. Socio-economic status was the most important determinant of palpable goitre detection (B = 0.517, P = 0.040). Evaluation of parameters that determine socio-economic status revealed that the rate of goitre was higher in children with a father who had low educational level (χ2 = 5.374, P = 0.020) and in children whose father was occupied in a low-income job (χ2 = 4.633, P = 0.031).
Discussion
We did not assess IDD and goitre prevalence in this study but evaluated the rate of goitre detected by palpation in primary-school children of an urban area, revealing that 8% of these children had goitre. Most children who had palpable goitre were grade 1A, similar to the results obtained in areas of mild IDD in a previous studyReference Zimmerman, Saad, Hess, Torresani and Chaoki15. In agreement with the results of Brahmbhatt et al.Reference Brahmbhatt, Brahmbhatt and Boyages16, we did not find gender differences in the frequency of goitre determined by palpation. Our study was performed in a city in the Aegean region in the west of Turkey. Children included in this study constituted a general sample of the child population of the city. The rates of stunting and underweight were 7.5% and 4.1%, respectively. In a study carried out by the Ministry of Health, stunting and underweight rates were 6.6% and 0.8% respectively in children below 5 years of age living in the Aegean region in 200317. There are no data on stunting and underweight prevalences among schoolchildren in Turkey. Global prevalences of stunting and underweight in 1990–2000 were reported to decline from 34 to 27% and from 27 to 22%, respectively, by de Onis et al.Reference de Onis, Blossner, Borghi, Morris and Frongillo9. The rates in our study are too low to compare with the values obtained in other developing countries.
Values of HAZ and WAZ were not significantly different between children with and without goitre. On the other hand, BMI Z-score and W/H were significantly lower in children with goitre than in children without goitre. This led us to interpret that children with goitre were thinner and that their nutritional status was worse. Adults also show a very high prevalence of PEM, as evidenced by the prevalence of low BMI (a critical situation) in the population18. Brahmbhatt et al. reported that thyroid volumes were higher in schoolchildren with malnutrition defined by low BMI. The mechanism of goitre in the setting of PEM is probably multifactorial. Iodine absorption decreases in children with PEMReference Brahmbhatt, Brahmbhatt and Boyages13. Moreover, iodine concentration in the thyroid gland decreases due to depressed iodide clearance and uptakeReference Ingenbleek and Beckers19, Reference Ingenbleek and Beckers20. Thus PEM may cause thyroid hyperplasia and further reduce the circulating levels of thyroid hormone. Moreover, PEM may contribute directly to goitrogenesis through the lack of substrate availability, particularly essential amino acids such as tyrosineReference Gaitan, Mayoral and Gaitan21. Even mild PEM is reported to have detrimental effects on thyroid homeostasis in iodine-deficient areasReference Centanni, Miani, Vermiglio, Cannettieri, Sanna and Moretti22.
Goitre detection rate was highest in children with low and especially very low socio-economic status. The most important factor in goitre detection by palpation was socio-economic status. Also, rates of stunting and underweight were significantly higher in children with very low socio-economic status compared with the other children. Similarly, in studies performed in other countries, the frequency of goitre and malnutrition was found to be higher in children with low socio-economic statusReference Joshi, Mishra, Bhatnagar, Singh, Garg and Chopra8, Reference Stone23, Reference Knudsen, Bülow, Laurberg, Ovesen, Perrild and Jorgensen24. Rate of goitre detection was slightly higher in the stunted and underweight children with moderate socio-economic status. This may be a reflection of nutritional problems during the pre-school period due to the mother working and the child being cared for by a babysitter.
Although anthropometric indices differed between children with low and very low socio-economic status in the whole study population and in children without palpable goitre, in children with palpable goitre only WAZ differed according to low or very low socio-economic status. In a study from Malaysia, the coexistence of malnutrition and iodine deficiency was more common in areas of low socio-economic status; however, unlike in our study, the most commonly encountered nutritional deficiency was stunting and not underweightReference Wan Nazaimoon, Osman, Wu and Khalid25. We found that the frequency of stunting and underweight among children without goitre was higher in those with low socio-economic status. On the other hand, the frequency of nutritional disorders among children with goitre did not change with socio-economic status. This may be explained by the inadequate nutrition of children with goitre independent of socio-economic status.
We found that low educational level of the father and father's occupation in a low-income job increased the rate of goitre; however, monthly income of the families was not questioned in this study. Goitre being more common in children whose fathers had low-income jobs can be interpreted that the role of economic factors is more important than the role of social factors in goitre frequencyReference Hakeem26.
In summary, BMI and W/H were lower in children who had goitre on palpation. However, the rate of palpable goitre in stunted and underweight children was not significantly higher than in children with normal nutritional status. Moreover, rates of palpable goitre and nutritional deficiencies were higher in children with low and very low socio-economic status. In children who did not have goitre, all anthropometric indices were lower in those who had low and very low socio-economic status, but in children with palpable goitre only WAZ was lower. Among children without goitre, the frequency of being stunted and underweight was higher in those with low socio-economic status, but the frequency of nutritional disorders did not change according to socio-economic status among children with goitre. The high rate of goitre in children whose father had low educational level and whose father was occupied in a low-income job revealed the importance of economic factors in the development of goitre.
In conclusion, children detected to have goitre were thinner, but frequency of palpable goitre was not significantly increased in children with nutritional disorders. Both palpable goitre and nutritional disorders were encountered more commonly in the setting of low socio-economic status. Among children with palpable goitre, WAZ was lower in the ones with low socio-economic status. However, the frequency of nutritional disorders in children with palpable goitre did not change according to socio-economic status. Economic status was the most important factor influencing the frequency of goitre.


