


Breast cancer is the most common cancer among women worldwide. International variation of breast cancer incidence suggests that the large geographic heterogeneity of breast cancer incidence might be explained by variation in dietary patterns( Reference Yang, Ren and Fu 1 ). The impact of diet, and particularly dietary fat, on breast cancer risk has been extensively studied( Reference Lof and Weiderpass 2 ). However, the results for dietary fat have been inconsistent and its role in the aetiology of breast cancer remains controversial( Reference Willett 3 , Reference Thiebaut, Kipnis and Schatzkin 4 ).
n-6 PUFA, particularly linoleic acid (18:2n-6; cis, cis-9,12-octadecadienoic acid), are found in abundance in Western diets( Reference Willett 5 ). The major dietary sources of linoleic acid are vegetable oils, nuts, seeds, meat and eggs. Manufactured foods containing soyabean oil as a primary ingredient will be rich in linoleic acid. The role of linoleic acid in cancer remains somewhat unclear. A review of animal experiments suggested that while linoleic acid may not have a large effect on tumour initiation for many types of cancer, it can highly influence tumour progression and growth( Reference Welsch 6 ). In the case of breast cancer, high-fat diets rich in linoleic acid increase carcinogenesis and enhance tumour progression( Reference Rose 7 ). Human studies have also identified a series of signalling events initiated by the linoleic acid-induced up-regulation of cyclooxygenase activity and prostaglandin E2, characterizing key proteins and signalling events involved in its enhancement of cell growth in breast cancer( Reference Mouradian, Kikawa and Johnson 8 ).
Considering that studies vary by design – for example, with some using FFQ whereas others directly measure plasma levels – this variation may result in inconsistent results since FFQ represent a subjective measurement over time, which reflects intake of the food or nutrient. Plasma level is therefore a better reflection of exposure at a specific point in time. Therefore, it is necessary to quantitatively ascertain the association between both dietary linoleic acid intake and serum linoleic acid level and the risk of breast cancer by means of meta-analysis. Prospective cohort studies are assumed to provide better evidence than case–control studies, since they are not biased by recall of past dietary habits after breast cancer has been diagnosed.
Thus, available data from prospective studies of adult females (premenopausal, postmenopausal or combined) across different countries were pooled to summarize the relationship between linoleic acid and the risk of breast cancer for the highest v. lowest categories, to estimate the potential dose–response trend and to conduct a stratified analysis for exploring the probable source of heterogeneity.
Methods
Search strategy
A literature search was performed using the databases of PubMed and EMBASE up to November 2014 by two investigators, using the following search terms: ‘linoleic acid’ and ‘breast cancer’ without restrictions. Moreover, we also reviewed the reference lists from retrieved articles to search for further relevant studies. Two investigators independently reviewed all identified studies, and studies were included if they met the following criteria: (i) a prospective design; (ii) the exposure of interest was dietary linoleic acid intake or level of serum linoleic acid; (iii) the outcome of interest was breast cancer; (iv) multivariate-adjusted relative risk (RR) with 95 % CI was provided; and (v) for dose–response analysis, the number of cases and participants or person-years for each category of linoleic acid intake or level of serum linoleic acid were also provided (or data were available to calculate them). If data were duplicated in more than one study, the study with the largest number of cases was included.
Data extraction
The following data were collected from all studies: the first author’s name, country where the study was performed, participant age at baseline, sample size, duration of follow-up, number of cases, variables adjusted for in the analysis, as well as multivariate-adjusted RR and 95 % CI for the highest v. lowest categories of dietary linoleic acid and serum linoleic acid or for each category of dietary linoleic acid and serum linoleic acid. For studies that reported results from various covariate analyses, we abstracted the estimates based on the model that included the most potential confounders. For linoleic acid intake, we used g/d as a standard measure, and the median value of each category was extracted as reported in the original studies. When the lowest category was open-ended, we set the lower boundary to 0; when the highest category was open-ended, we assumed the values as 1·2 times the lower bound. The study quality was assessed using the nine-star Newcastle–Ottawa Scale( Reference Wells, Shea and O’Connell 9 ), which mainly contains selection domain (zero to four stars), comparability domain (zero to two stars) and exposure or outcomes domain (zero to three stars).
Statistical analysis
The pooled measure was calculated as the inverse variance-weighted mean of the natural logarithm of RR with 95 % CI to assess the strength of the association between dietary linoleic acid and serum linoleic acid and breast cancer risk. The I 2 statistic was used to assess heterogeneity, with I 2 values of 0, 25, 50 and 75 % representing no, low, moderate and high heterogeneity, respectively( Reference Higgins, Thompson and Deeks 10 ). The fixed-effect model was used as the pooling method if moderate or lower heterogeneity (I 2<50 %) was found; otherwise (I 2>50 %), the random-effect model was adopted that considers both within-study and between-study variation. Meta-regression with restricted maximum likelihood estimation was performed to assess the potentially important covariates that might exert substantial impact on between-study heterogeneity. A sensitivity analysis was performed with one study removed at a time to assess whether the results could have been affected markedly by a single study. Publication bias was evaluated using the Egger regression asymmetry test.
In the dose–response analysis, random-effects dose–response meta-analysis was conducted with the between-study heterogeneity taken into account to examine a potential non-linear relationship. This was done by modelling linoleic acid consumption using restricted cubic splines with three knots at fixed percentiles of 5 %, 50 % and 95 % of the distribution( Reference Desquilbet and Mariotti 11 ). First, generalized least squares taking into account the correlation within each set of published RR( Reference Greenland and Longnecker 12 , Reference Orsini, Bellocco and Greenland 13 ) was used to estimate a restricted cubic spline model( Reference Desquilbet and Mariotti 11 , Reference Bagnardi, Zambon and Quatto 14 ) with the two spline transformations (three knots minus one). Second, bivariate random-effect meta-regression with restricted maximum likelihood estimation( Reference White 15 ) was used to combine the two regression coefficients. A P value for non-linearity was calculated by testing the null hypothesis that the coefficient of the second spline was equal to zero.
All statistical analyses were performed with the statistical software package STATA version 13. All reported probabilities (P values) were two-sided, with P<0·05 considered statistically significant.
Results
Study characteristics
The study identification and selection progression are summarized in Fig. 1. After screening by two reviewers independently according to the inclusion criteria, eight prospective cohort studies( Reference Murff, Shu and Li 16 – Reference Willett, Hunter and Stampfer 23 ) and four prospective nested case–control studies were included( Reference Chajes, Thiebaut and Rotival 24 – Reference Wirfalt, Vessby and Mattisson 27 ). Among the twelve studies, two studies reported two separate outcomes (premenopausal and postmenopausal); thus there were fourteen outcomes included in the meta-analysis. Two studies provided data on premenopausal( Reference Rissanen, Knekt and Jarvinen 22 , Reference Saadatian-Elahi, Toniolo and Ferrari 25 ), eight studies on postmenopausal( Reference Park, Kolonel and Henderson 17 , Reference Sczaniecka, Brasky and Lampe 18 , Reference Voorrips, Brants and Kardinaal 20 – Reference Rissanen, Knekt and Jarvinen 22 , Reference Saadatian-Elahi, Toniolo and Ferrari 25 – Reference Wirfalt, Vessby and Mattisson 27 ) and four studies provided data on combined pre- and postmenopausal women( Reference Murff, Shu and Li 16 , Reference Thiebaut, Chajes and Gerber 19 , Reference Willett, Hunter and Stampfer 23 , Reference Chajes, Thiebaut and Rotival 24 ). Five studies( Reference Park, Kolonel and Henderson 17 , Reference Sczaniecka, Brasky and Lampe 18 , Reference Willett, Hunter and Stampfer 23 , Reference Saadatian-Elahi, Toniolo and Ferrari 25 , Reference Takata, King and Neuhouser 26 ) with six outcomes were conducted in the USA, six studies( Reference Thiebaut, Chajes and Gerber 19 – Reference Rissanen, Knekt and Jarvinen 22 , Reference Chajes, Thiebaut and Rotival 24 , Reference Wirfalt, Vessby and Mattisson 27 ) with seven outcomes in Europe and one( Reference Murff, Shu and Li 16 ) in Asia. The maximum follow-up duration ranged from 4·3 to 12 years. All studies included met quality criteria, ranging from six to eight stars. Detailed information on the studies is shown in Table 1.
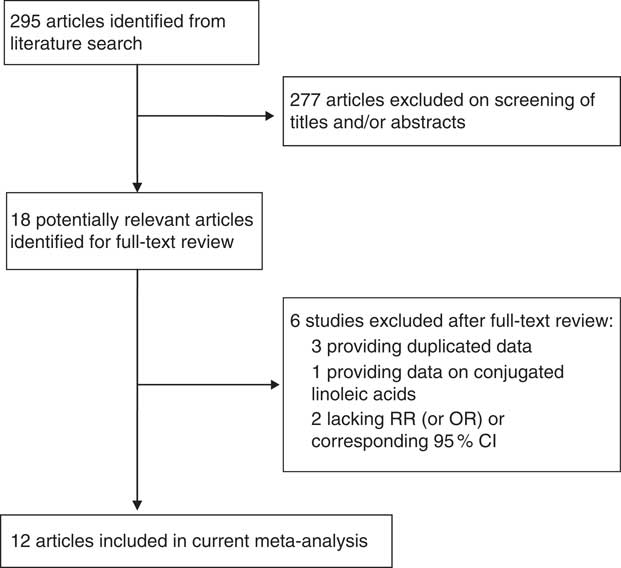
Fig. 1 Flow diagram of study selection (RR, relative risk)
Table 1 Characteristics of prospective studies on linoleic acid and incidence of breast cancer

SWHS, Shanghai Women’s Health Study; PC, prospective cohort study; VITAL, VITamins And Lifestyle; E3N, Etude Epidémiologique auprès de femmes de la Mutuelle Générale de l’Education Nationale; NLCS, Netherland Cohort Study; NHS, Nurses’ Health Study; EPIC, European Prospective Investigation into Cancer and Nutrition; NCC, nested case–control study; ORDET, prospective study of hormones, diet, and prediagnostic breast cancer; NYUWHS, New York University Women’s Health Study; Post, postmenopausal; Pre, premenopausal; TEI, total energy intake; BC, breast cancer; HRT, hormone replacement therapy; PA, physical activity; NSAID, non-steroidal anti-inflammatory drugs.
Quantitative synthesis
Results of pooled analysis are summarized in detail in Table 2. Fourteen independent prospective studies reported the association between linoleic acid and risk of breast cancer, involving 10 410 cases and 358 955 adult females (premenopausal, postmenopausal or combined) across different countries. The pooled RR (95 % CI) of breast cancer for the highest v. lowest categories of linoleic acid was 0·98 (0·93, 1·04) (Fig. 2), and no significant between-study heterogeneity was found (I 2=17·80 %). For dietary linoleic acid intake, six separate results( Reference Murff, Shu and Li 16 – Reference Voorrips, Brants and Kardinaal 20 , Reference Willett, Hunter and Stampfer 23 ) were included; the pooled RR (95 % CI) was 0·99 (0·92, 1·06) and no between-study heterogeneity was found (I 2=0·00 %). For serum linoleic acid level, eight separate outcomes( Reference Pala, Krogh and Muti 21 , Reference Rissanen, Knekt and Jarvinen 22 , Reference Chajes, Thiebaut and Rotival 24 – Reference Wirfalt, Vessby and Mattisson 27 ) were included; the pooled RR (95 % CI) was 0·98 (0·88, 1·08) and moderate between-study heterogeneity was found (I 2=40·90 %; Fig. 2).
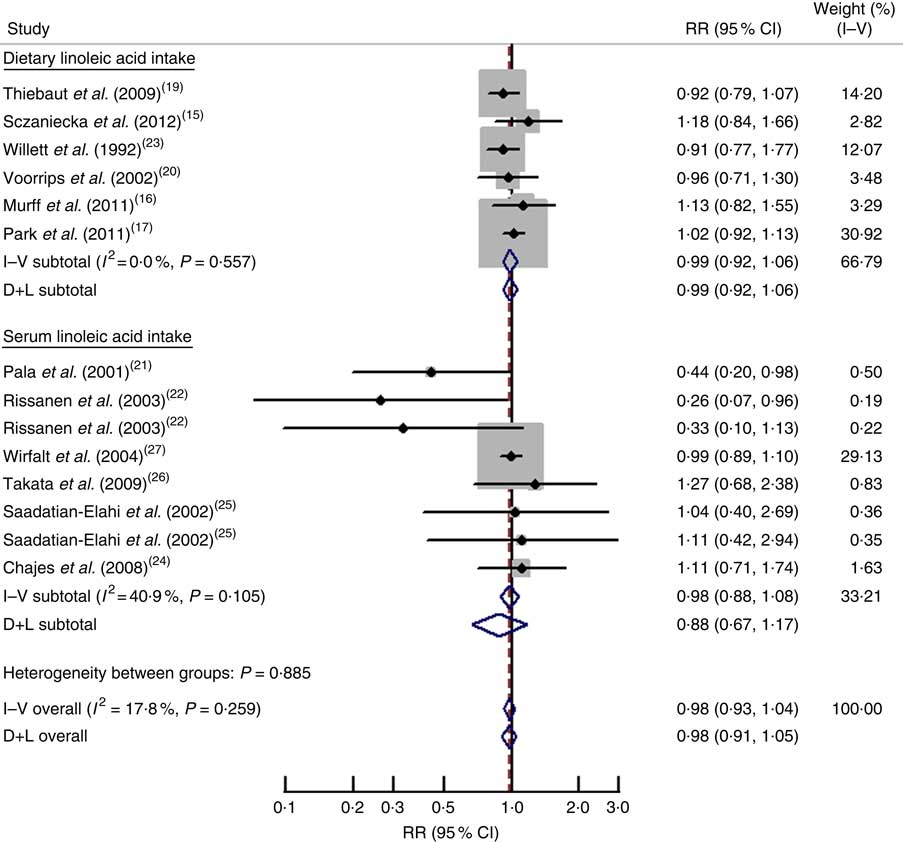
Fig. 2 Forest plot for the pooled relative risk (RR) from prospective studies of linoleic acid and breast cancer risk. The study-specific RR and 95 % CI are represented by the black dot and horizontal line, respectively; the area of the grey square is proportional to the specific-study weight to the overall meta-analysis. The centre of the open diamond presents the pooled RR and its width represents the pooled 95 % CI. D+L denotes the random-effect model; I–V denotes the fixed-effect model
Table 2 Subgroup analysis of prospective studies of linoleic acid and breast cancer risk for highest v. lowest category of linoleic acid

RR, relative risk.
* P value for heterogeneity within subgroup.
† P value for heterogeneity between subgroups with a meta-regression analysis.
Dose–response analysis
Three studies( Reference Murff, Shu and Li 16 , Reference Sczaniecka, Brasky and Lampe 18 , Reference Willett, Hunter and Stampfer 23 ) reporting dietary linoleic acid intake were eligible for the dose–response analysis. The departure from linear relationship was not significant (P non-linearity=0·43). The RR (95 % CI) of breast cancer was 0·97 (0·91, 1·04), 0·95 (0·85, 1·07), 0·96 (0·86, 1·07), 0·98 (0·87, 1·10) and 0·99 (0·85, 1·14) for linoleic acid intake of 5, 10, 15, 20 and 25 g/d, respectively (Fig. 3). The risk of breast cancer decreased by 1 % (RR=0·99; 95 % CI 0·93, 1·05) for every 10 g/d increment in linoleic acid intake.
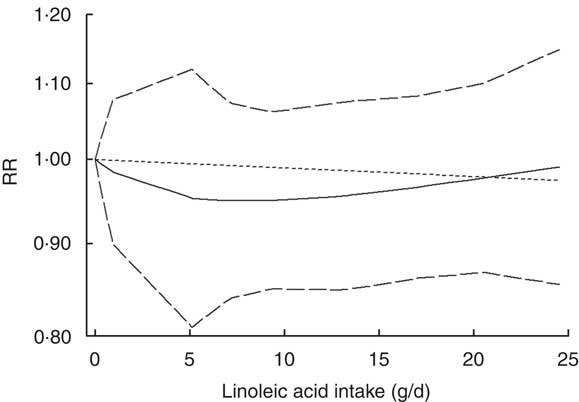
Fig. 3 Non-linear dose–response relationship between linoleic acid and breast cancer risk in prospective studies assessed by a restricted cubic spline model with three knots. ——— represents the relative risk (RR), — — — — — represent the 95 % CI and - - - - - represents the linear trend
Subgroup analysis
Meta-regression and subgroup analysis was performed to explore the probable source of heterogeneity (Table 2). Although the association of increased linoleic acid with reduced risk of breast cancer among premenopausal women from two studies (pooled RR=0·64; 95 % CI 0·20, 2·09) was more evident than that among postmenopausal women from eight studies (pooled RR=1·01; 95 % CI 0·94, 1·08), results of meta-regression did not show a significant difference between the two populations. When stratified by the adjustment for potential confounders, meta-regression did not show a significant difference between estimates adjusted and those not adjusted for specific covariates.
Sensitivity analysis and publication bias
Sensitivity analysis suggested that no individual study had excessive influence on the above-mentioned pooled effect. The Egger test showed no evidence of significant publication bias for the analysis between breast cancer incidence and linoleic acid (P=0·26).
Discussion
Findings from the current of prospective studies indicated that both dietary linoleic acid intake and serum linoleic acid level were associated with decreased risk of breast cancer, although none of the associations were statistically significant. The linear dose–response relationship showed that risk of breast cancer decreased by 1 % (RR=0·99; 95 % CI 0·93, 1·05) for every 10 g/d increment in linoleic acid intake.
Research on the possible mechanism of linoleic acid related to breast cancer shows a remarkable diversity. Meta-analyses of mouse mammary tumour models have suggested that n-6 PUFA such as linoleic acid have a tumour-promoting effect( Reference Fay, Freedman and Clifford 28 , Reference Rose 29 ). A potential mechanism behind the cancer-promoting effects of n-6 PUFA is through the production of pro-inflammatory eicosanoids such as prostaglandin E2, which promotes angiogenesis and hinders apoptosis( Reference Murff, Shu and Li 16 ). However, in another murine mammary gland adenocarcinoma model, a diet rich in n-6 PUFA did not behave as a tumour promoter; on the contrary, the reverse was the case( Reference Munoz, Piegari and Guzman 30 ). Additional studies are needed to determine the exact role of linoleic acid in the aetiology of breast cancer.
The present meta-analysis has important implications for further studies on linoleic acid and breast cancer risk. First, in the subgroup analysis, six of the studies included were conducted with Americans, seven studies were conducted with Europeans and only one study was conducted with Asians. Considering the underlying disease–effect unconformity across different geographical locations, more studies deserve to be conducted in other populations. Second, linoleic acid is obtained mainly from vegetables and vegetable oils; it cannot be excluded that serum linoleic acid level is simply a marker of high intake of vegetables or a healthier diet, and thus the current finding might be due to residual confounding( Reference Rissanen, Knekt and Jarvinen 22 ). Third, because n-6 PUFA and n-3 PUFA compete as enzyme substrates and within membrane phospholipids, it has been suggested that an analytical approach focusing on a single fatty acid at a time may be insufficient( Reference Bougnoux, Giraudeau and Couet 31 ). Further research is needed to study the effect of n-6 PUFA and n-3 PUFA simultaneously.
Meta-analyses of observational studies are susceptible to methodological and confounding biases inherent in the original studies. Therefore, there are several limitations to consider in our study. First, although prospective studies are more superior to retrospective case–control studies with regard to elucidating causal relationships, selection bias from study populations might be still unavoidable. Second, the association of increased linoleic acid with reduced risk of breast cancer among premenopausal women (RR=0·64; 95 % CI 0·20, 2·09) was more evident than that among postmenopausal women (RR=1·01; 95 % CI 0·94, 1·08); however, relatively limited data were included in the subgroup analysis and neither of the associations was statistically significant. Third, any measurement error and resulting misclassification would most likely lead to an attenuation of the true association. Finally, the observed inverse association between dietary linoleic acid intake and breast cancer risk might be affected by unmeasured or residual confounding. Persons with higher linoleic acid exposures may have higher levels of physical activity, lower prevalence of overweight/obesity, and lower intakes of alcohol and dietary fat. Many, but not all, of the studies included in the meta-analysis adjusted for these and other potential confounders.
Conclusion
In conclusion, compared with previous studies, the results of the current meta-analysis suggest that linoleic acid is associated with decreased risk of breast cancer, although none of the associations were statistically significant. These findings could have public health implications with regard to prevention of breast cancer through dietary and lifestyle interventions. Further studies are warranted to confirm the results and clarify the underlying mechanism.
Acknowledgements
Financial support: This research received no specific grant from any finding agency in the public, commercial or not-for-profit sectors. Conflict of interest: None. Authorship: Y.Z. conceived the study design; Y.Z., T.W., S.Z. and W.L. searched and selected the articles, extracted, analysed and interpreted the data; Y.Z. and Q.M. drafted the manuscript. All authors read and approved the final version of the manuscript. Ethics of human subject participation: Not applicable.


