


Meat production and consumption have a large impact on human health and the environment(Reference Burkholder, Rajaram and Sabaté1–Reference Westhoek, Lesschen and Rood4). Evidence from epidemiological studies suggests that opting for more plant-based over meat-based diets would have a positive effect on human longevity and decrease the risk for several modern lifestyle diseases such as diabetes type 2, CVD, obesity and some types of cancer(Reference Burkholder, Rajaram and Sabaté1,Reference Battaglia Richi, Baumer and Conrad5–Reference Appleby, Thorogood and Key7) . Additionally, the adoption of such diets would substantially reduce the environmental burden caused by the production of animal proteins(Reference Aiking2–Reference Westhoek, Lesschen and Rood4) and the animal suffering caused by many common practices in livestock production(Reference de Jonge, van der Lans and van Trijp8,Reference Rothgerber9) . Increased awareness of the issues associated with meat consumption may be a cause of the increasing popularity of vegan, vegetarian and flexitarian lifestyles(10–Reference Pollan12). At the same time, however, global meat consumption is increasing continuously, or in some countries stagnating at a high level of per capita consumption(13,Reference Henchion, McCarthy and Resconi14) . Official dietary guidelines such as those of the Swiss Society for Nutrition(15) or the World Cancer Research Fund International(16) strongly recommend moderate consumption of meat, especially of red and processed meat. These guidelines also encourage individuals to frequently replace meat with other sources of animal- and plant-based proteins. Moreover, public organisations are attempting to increase public awareness of the issues associated with high levels of meat consumption(Reference Apostolidis and McLeay17) in an effort to direct consumer food choices in a more healthy, sustainable direction. The transition to more plant-based diets, however, is challenging(Reference Apostolidis and McLeay17), especially because meat is very popular and is positively regarded in terms of taste, tradition and beliefs about healthiness by a large portion of society(Reference Ruby18). According to the Organisation for Economic Co-operation and Development(19), European consumers eat about 70 kg of meat (i.e. beef/veal, pork, poultry and lamb/mutton; retail weight) per year and thus clearly exceed official recommendations for meat intake(15,16) . Because meat consumption can be considered a highly habituated behaviour(Reference Rees, Bamberg and Jäger20), it is rather difficult for people to change their intake levels. It is thus important to understand what motivates people to consume less or no meat in order to develop strategies that can effectively motivate people who consume excessive amounts of meat to shift their habits towards more plant-based diets.
Previous research has emphasised that the reasons for choosing a vegetarian or semi-vegetarian lifestyle are diverse and vary widely across cultures(Reference Ruby, Heine and Kamble21). The most commonly reported reasons for vegetarianism and reduced meat consumption in Western countries are ethical concerns about the rearing and slaughtering of animals for the purpose of meat production, concerns about personal health and the environment, and disgust(Reference Ruby18). Other reasons to adopt a diet that excludes some or all types of meat are religious in nature(Reference De Backer and Hudders22), based on attempts to save money(Reference Mullee, Vermeire and Vanaelst23) or a result of seeking variety beyond the traditional meat-based menu composition(Reference Forestell, Spaeth and Kane24).
Previous research has suggested that vegetarians and non-vegetarians basically have similar motives, but that some motives are mentioned more frequently in one or the other group(Reference Ruby18). For vegetarians, the most frequently reported motives are ethical concerns about animal welfare followed by personal health, environmental concerns and disgust towards meat(Reference Ruby18). In semi-vegetarians, however, health motives, especially the benefits of a vegetarian diet and the attempt to lose weight by lowering meat intake, are more common(Reference De Backer and Hudders22,Reference Forestell, Spaeth and Kane24,Reference de Boer, Schosler and Aiking25) whereas ethical reasons and environmental concerns are less frequently reported in this diet group and thus seem to play a secondary role(Reference Ruby18). The motives for following a vegetarian diet may also change over time, because the longer a certain diet style is practised the more knowledge people gain about the diet and related issues(Reference Ruby18).
Study aims
The aim of the present study was threefold. First, it explored differences in motives for low or no meat consumption among vegetarians/vegans, pescatarians and self-declared low-meat consumers. Second, intake levels of both animal- and plant-based proteins were investigated in order to determine whether and with which alternative protein sources low/no-meat consumers may compensate for meat avoidance. The study also compared diet quality and weight status between self-declared diet groups as indicators of the healthiness of more plant-based diets. Third, our study sought to explain which factors predict variance in meat consumption among consumers who reported deliberately eating little or no meat. More specifically, it investigated which motives are linked to lower meat consumption and whether the consumption of plant-based alternatives is associated with lower meat intake.
A large sample of Swiss adults from different sociodemographic groups was used to achieve a high level of generalisability. The results of the study are relevant for public health organisations’ efforts to support people to keep their meat consumption within a healthy range.
Methods
Participants
The present study used data from the Swiss Food Panel 2.0, a longitudinal study of the eating behaviours of the Swiss population. The first wave of data was collected during the spring of 2017. The survey consisted of a paper-and-pencil questionnaire which was sent to a random sample of residents in the German- and French-speaking regions of Switzerland. Additional addresses from people aged between 20 and 30 years were purchased from an address company to ensure the presence of a sufficient proportion of younger adults in the sample. The questionnaires were completed and returned by 5781 people, representing a response rate of 25·1 %. Participants who did not indicate their gender or age and those who completed less than 50 % of the questionnaire were excluded (n 195). Women who were pregnant at the time (n 348) were also excluded, because analyses including BMI were conducted. After these exclusions, 5238 participants remained in the final sample. Of these, 48·7 % were females and 73·8 % were German speakers. The mean age of the sample was 56·5 (sd 17·3) years (range = 20–100 years). Compared with the census (33·4 %), young adults 20–39 years old were under-represented (17 %). For the present analysis, only participants with no missing answers to questions on the relevant variables (diet style and meat reduction) were considered (n 4213; 47·4 % females; mean age = 55·4 years).
Individual measures
Motives for low or no meat consumption
First, participants were asked a filter question, ‘Do you intentionally eat little or no meat?’ Participants who answered ‘yes’ were then asked about the strength of a variety of motives for low or no meat consumption. Motives were assessed with twelve statements and a Likert-type response scale (e.g. ‘I eat little or no meat because I want to eat healthily’; see Table 1). Response options ranged from 1 (‘totally disagree’) to 7 (‘totally agree’).
Table 1 Items assessing motives for no or low meat consumption

† Item was adapted from De Backer and Hudders(Reference De Backer and Hudders22).
Perceived difficulty of low or no meat consumption
The perceived difficulty of practising a diet containing little or no meat was assessed with one item: ‘How difficult is it for you to practise a diet with little or no meat?’. The response scale varied from 1 (‘not at all difficult’) to 7 (‘very difficult’).
Diet style
Participants were asked to indicate whether they defined themselves as omnivore (a typical Western diet including meat and other animal-based foods), pescatarian (no meat but fish and seafood), vegetarian (no meat, fish or seafood, but other animal-based foods such as dairy products or eggs) or vegan (no animal-based foods). Diet styles were predefined in the questionnaire according to the definitions presented in parentheses above. Based on that self-declaration and independent of their self-reported dietary behaviour as measured with an FFQ (see next section), participants were classified into the different diet styles. Of all the participants in the sample, 82·5 % (n 4321) indicated their diet style. Of those participants, 93·0 % (n 4019) were self-defined omnivores, 2·9 % (n 127) pescatarians, 3·6 % (n 156) vegetarians and 0·4 % (n 19) vegans. Due to the small group size of vegans, vegans and vegetarians were collapsed into one group (n 175). In addition, omnivores were split into two groups based on the filter question presented above (‘Do you intentionally eat little or no meat?’). Those who indicated that they deliberately ate little meat were labelled as (subjective) low-meat consumers (n 1296) and those who did not as (subjective) regular meat consumers (n 2615). All participants who failed to respond to any of the questions about diet style or meat consumption were excluded from the analyses, because they could not be clearly classified.
Self-reported food consumption
The survey included a semi-quantitative FFQ (sFFQ) which consisted of a subset of food items and nine response options adapted from the Nurses’ Health Study questionnaire(Reference Hu, Satija and Rimm26). Typical consumption frequencies of forty-seven types of food and beverage during the past year were assessed. As in the original questionnaire(Reference Hu, Satija and Rimm26), for each item a standard portion was specified (e.g. ‘100–120 g of beef/veal’ or ‘one handful or 120 g of fruit’), and the participants were asked to indicate the amount of standard portions they usually consumed. For the analysis, the number of portions per week was calculated by recoding the response options as follows: ‘4 or more per day’ (= 28 portions/week), ‘3 per day’ (= 21), ‘2 per day’ (= 14), ‘1 per day’ (= 7), ‘5–6 per week’ (= 5·5), ‘2–4 per week’ (= 3), ‘1 per week’ (= 1), ‘1–3 per month’ (= 0·5) and ‘seldom/never’ (= 0 portions/week). Consumption frequencies of four types of unprocessed meat (including pork, beef/veal, poultry, and other types of meat such as venison and lamb) and two types of processed meat (including sausages and cold cuts such as salami or bacon) were assessed. The predefined portion of unprocessed meat was 100–120 g; for processed meat it was three slices for cold cuts and one piece for sausages. Total meat consumption was calculated by summing up the weekly portions of all six meat items. A plausibility check of the calculated total meat consumption revealed implausibly high total amounts of meat consumed per week for some participants. Therefore, an upper limit of 35 portions/week (5 portions/d) was defined, and all values above this limit were corrected down and set to 35 portions/week. The sFFQ also asked for information regarding the consumption frequency of other animal-based proteins, including fish and seafood, eggs and dairy products ((cow’s) milk, quark, cheese, yoghurt and cottage cheese), as well as of plant-based proteins including meat substitutes such as tofu and vegetarian cold cuts, legumes and soya products (soya milk and soya yoghurt). The pre-specified portion size was 100–120 g for fish and seafood; one egg; one glass or 200 ml for cow’s and soya milk; 150–200 g or one bowl for quark, yoghurt and cottage cheese; 30–60 g for cheese; and 200 ml or one cup for (cooked) legumes.
Diet quality index
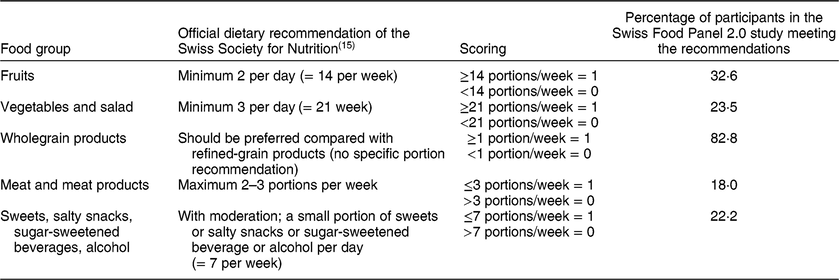
As an indicator of the healthiness of the participants’ diet, a diet quality index was calculated based on the self-reported consumption frequencies of the following five food/beverage groups: (i) fruit (excluding fruit juice); (ii) vegetables and salad (raw and cooked); (iii) wholegrain products (bread, rice, and pasta); (iv) meat and meat products; and (v) sweets, salty snacks, sugar-sweetened beverages and alcohol. These foods and beverages were selected based on official dietary guidelines(15) and because previous studies have shown that their consumption either positively or negatively affects health(Reference Malik, Willett and Hu27). For each food group, the recommended minimum or maximum amount of weekly intake was used as the cut-off value (see Appendix 1). For foods with a positive impact on health (fruit, vegetables and salad, wholegrain products), one point was assigned if a participant’s consumption was equal to or higher than the recommended minimum. For all other indicators, one point was assigned if consumption was equal to or below the recommended maximum. A summary score for these points was calculated to create the diet quality index. Possible scores ranged from 0 (rather unhealthy diet) to 5 (rather healthy diet). Research has shown that diet quality indices based on dietary recommendations are valid measures with good predictive power for morbidity and all-cause mortality when combined with other risk factors such as age, gender, smoking or BMI(Reference Lassale, Gunter and Romaguera28,Reference McNaughton, Ball and Crawford29) .
Weight status
BMI was calculated as the quotient of self-reported body weight (in kilograms) divided by the square of height (in metres). Participants with a BMI ≥ 25·0 kg/m2 were categorised as overweight. In the present sample, the mean BMI of the participants was 25·9 (sd 4·00) kg/m2 for males and 23·7 (sd 4·42) kg/m2 for females. More males in the sample (54·9 % v. 50 % in the census) and fewer females (28·3 % v. 32 % in the census) were overweight than in the general Swiss population(30).
Sociodemographic characteristics
The questionnaire included questions about the participants’ gender, age, monthly net household income in Swiss francs and education, among other sociodemographic variables. Six response options were used for household income, ranging from ‘less than 3000 Swiss francs’ to ‘more than 11 000 Swiss francs’.
Data analysis
The statistical analyses were conducted using the statistical software package IBM SPSS Statistics version 25. One-way ANOVA using the Games–Howell post hoc test were conducted to compare the groups with the diverse diet styles. This post hoc test is adequate for comparing groups of very different group sizes and if the homogeneity of variances is not given(Reference Field31). For categorical variables, χ 2 tests were calculated. t Tests for independent samples were used to compare men and women with respect to several variables. A principal component analysis with varimax rotation was used to analyse whether some of the assessed motives for low/no meat consumption could be combined into one component. Finally, a three-step hierarchical regression analysis based on 1000 bootstrapped samples was used to identify predictors of total meat consumption among those participants who reported deliberately eating little or no meat (bootstrapping was used to deal with outliers). Sociodemographic characteristics (step 1), motives (step 2), the perceived difficulty of practising a diet with little or no meat consumption and the consumption of plant-based proteins (step 3) were included in the regression model as predictors. Due to the large sample size, only P values below 0·01 were considered significant in all statistical tests.
Results
The proportion of females in the four diet styles differed substantially, χ 2 = 263·31, P < 0·001 (vegetarians/vegans = 76·6 %, pescatarians = 71·7 %, subjective low-meat consumers = 60·0 %, regular meat consumers = 38·0 %). Therefore, all group comparisons were conducted separately for males and females. The groups did not differ significantly in age with the exception of the vegetarians/vegans, who were significantly younger (mean 49·22 (sd 17·87) years) than the pescatarians (mean 55·83 (sd 16·34) years), the low-meat consumers (mean 56·28 (sd 15·99) years) and the regular meat consumers (mean 55·30 (sd 16·87) years).
Motives for consuming little or no meat
Table 1 shows the items used to assess the participants’ motives for following a diet with low or no meat consumption. Based on the results of the principal component analysis (scree plot, eigenvalue >1, content-based considerations), two items were combined in each case for the motive categories of taste, environmental concerns and animal welfare. Table 1 shows the Cronbach’s α for those items which were combined into one motive category. Mean values for the motives separated by diet style (i.e. vegetarian/vegan, pescatarian, low-meat consumer) and gender are graphically displayed in Fig. 1. The regular meat consumers were not included in this comparison, because it would have been nonsensical to ask them to indicate their motivation for meat avoidance. One-way independent ANOVA revealed significant differences in the motivation for low or no meat consumption between the three diet styles. In particular, environmental and animal welfare concerns were highly endorsed by vegetarians/vegans and pescatarians, but less so by low-meat consumers. Taste-related motives were a stronger motivation for low/no meat consumption for vegetarians/vegans and pescatarians than for low-meat consumers. Health motives did not differ between the diet styles. Lastly, low-meat consumers (females only) were more strongly motivated by weight-related motives than were vegetarians/vegans and pescatarians. There were no differences between diet styles observed in the other motives assessed. In particular, no differences were observed for the motives related to medical advice, religious rules, upbringing or social expectations. Subjective low-meat consumers considered it more difficult to maintain a low level of meat consumption compared with vegetarians/vegans but not compared with pescatarians (see Table 4). There was also a gender difference: males reported more difficulties than females with practising a low-meat or meatless diet.
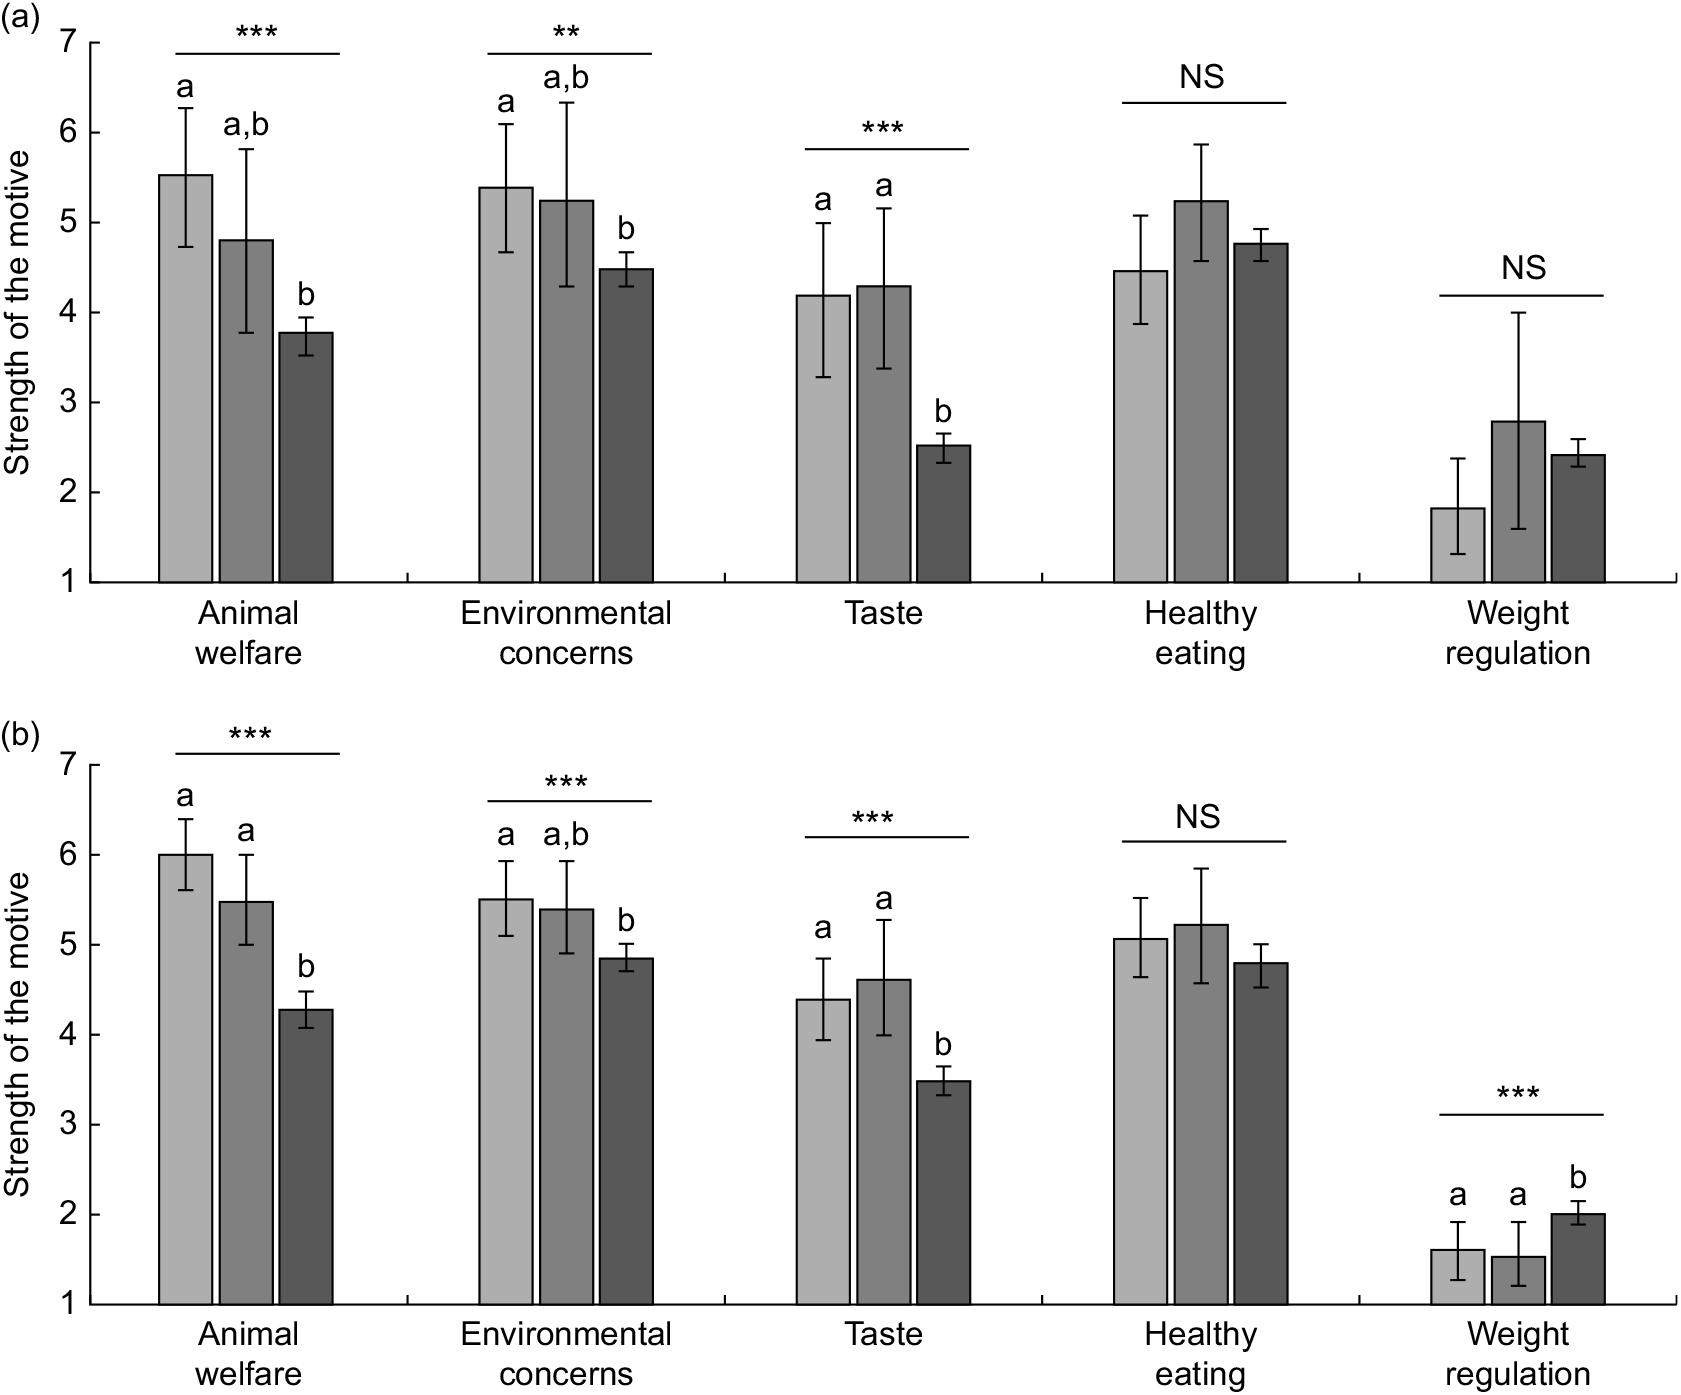
Fig. 1 Motives for vegetarianism and low meat consumption in different diet styles (![]() , vegetarians/vegans (males, n 41; females, n 134);
, vegetarians/vegans (males, n 41; females, n 134); ![]() , pescatarians (males, n 36; females, n 91);
, pescatarians (males, n 36; females, n 91); ![]() , low-meat consumers (males, n 519; females, n 777)), according to gender (a, males; b, females), in a sample of Swiss adults (n 1598); Swiss Food Panel 2.0 (survey 2017). The two aspects of taste motives (i.e. not liking the taste of meat and preferring vegetarian foods) were analysed together here because the results for both aspects were the same; n per group varies due to missing values. Values are means with their 99 % CI represented by vertical bars. One-way independent ANOVA were used to investigate differences in motives between diet styles. a,bMean values with unlike superscript letters were significantly different according to the Games–Howell post hoc test (P ≤ 0·01). **P < 0·01, ***P ≤ 0·001
, low-meat consumers (males, n 519; females, n 777)), according to gender (a, males; b, females), in a sample of Swiss adults (n 1598); Swiss Food Panel 2.0 (survey 2017). The two aspects of taste motives (i.e. not liking the taste of meat and preferring vegetarian foods) were analysed together here because the results for both aspects were the same; n per group varies due to missing values. Values are means with their 99 % CI represented by vertical bars. One-way independent ANOVA were used to investigate differences in motives between diet styles. a,bMean values with unlike superscript letters were significantly different according to the Games–Howell post hoc test (P ≤ 0·01). **P < 0·01, ***P ≤ 0·001
Dietary behaviour, diet quality and weight status
Tables 2 (males) and 3 (females) show the mean consumption frequencies of different protein sources for each diet style. In males, consumption of processed, unprocessed and thus total meat did not differ between vegetarians/vegans, pescatarians and self-declared low-meat consumers. In females, however, the lowest consumption of processed, unprocessed and total meat was in fact reported by vegetarians/vegans. Among all diet style groups, the highest consumption of fish was reported by male and female pescatarians. The weekly intake of eggs and dairy products did not differ between any of the groups in either males or females. Male vegetarians reported a considerably higher total meat intake (Table 3) than did vegetarian females (Table 2).
Table 2 Consumption of animal- and plant-based proteins (weekly portions) by a sample of Swiss adult males (n 2216); Swiss Food Panel 2.0 (survey 2017)
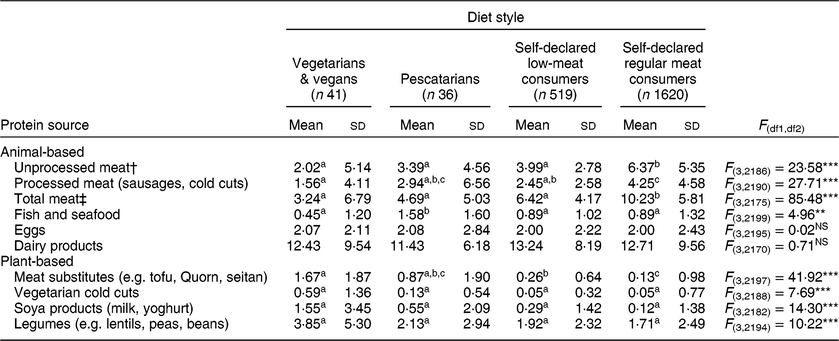
n per group varies due to missing values.
One-way ANOVA were used to investigate differences in the consumption of protein sources between diet styles.
a,b,cMean values within a row with unlike superscript letters were significantly different according to the Games–Howell post hoc test (P ≤ 0·01).
**P < 0·01, ***P ≤ 0·001.
† Including beef, pork, poultry and other types of meat such as venison or lamb.
‡ Total meat consumption differs slightly from the sum of the single meat items, because implausible extreme values in this variable were corrected and set to a maximum of 35 portions/week; this number also includes other types of meat (e.g. lamb, venison).
Table 3 Consumption of animal- and plant-based proteins (weekly portions) by a sample of Swiss adult females (n 1997); Swiss Food Panel 2.0 (survey 2017)
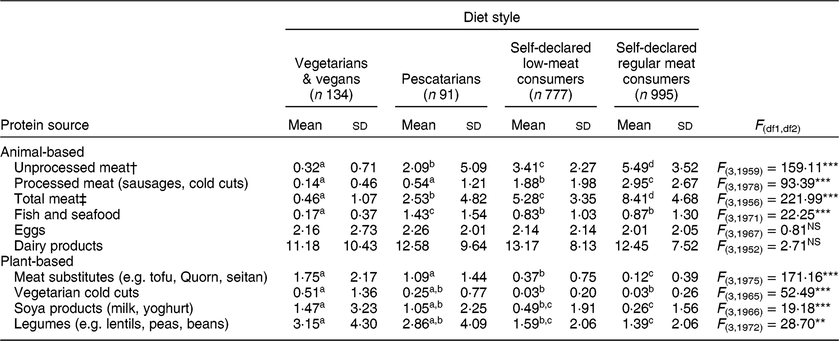
n per group varies due to missing variables.
One-way ANOVA were used to investigate differences in the consumption of protein sources between diet styles.
a,b,c,dMean values within a row with unlike superscript letters were significantly different according to the Games–Howell post hoc test (P ≤ 0·01).
**P < 0·01, ***P ≤ 0·001.
† Including beef, pork, poultry and other types of meat such as venison or lamb.
‡ Total meat consumption differs slightly from the sum of the single meat items, because implausible extreme values in this variable were corrected and set to a maximum of 35 portions/week; this number also includes other types of meat (e.g. lamb, venison).
With regard to meat substitutes, male and female vegetarians/vegans and pescatarians reported the highest consumption. Self-declared low-meat consumers also ate more of these foods than self-declared regular meat consumers. For the males, consumption frequency of other plant-based proteins did not differ among the groups. For females, the differences were more pronounced: vegetarians and vegans consumed more of all kinds of plant proteins than did the two meat consumer groups (regular and low).
For both genders, the regular meat consumers had the lowest diet quality of all groups, followed by the self-declared low-meat consumers (Table 4). Further, the percentage of overweight people (i.e. BMI = 25·0–29·99 kg/m2), and in females the percentage of obese people (i.e. BMI ≥ 30·0 kg/m2), was considerably higher among self-declared regular and low-meat consumers than in the other groups (Table 4). However, in males the prevalence of obesity was highest in the pescatarian group.
Table 4 Perceived difficulty of low or no meat intake, diet quality and weight, according to self-reported diet styles and gender, of a sample of Swiss adults; Swiss Food Panel 2.0 (survey 2017)

n per group varies due to missing values.
One-way ANOVA and χ 2 tests were used to investigate differences between the groups.
a,b,cMean values within rows with unlike superscript letters were significantly different according to the Games–Howell post hoc test (P ≤ 0·01).
**P < 0·01, ***P ≤ 0·001.
† Diet quality index based on recommendations of the Swiss Society for Nutrition(15).
‡ Percentage of individuals per group who did not eat more than the maximum recommended amount of three portions of meat per week (Swiss Society for Nutrition(15)). Based on self-reported meat consumption on the FFQ.
§ Perceived difficulty of practising a diet with little or no meat.
Adherence to dietary recommendations for meat intake
A relatively high percentage of individuals (82·0 %) exceeded the weekly recommended maximum of three portions of meat and meat products. This percentage was higher among males (90·3 %) than females (73·1 %). Only 4·5 % of the sample indicated never eating meat or meat products in the sFFQ, and 55·7 % reported eating one portion of meat or even more per day. The percentage of participants in the sample that met the official dietary recommendation for meat intake separated by diet style is shown in Table 4. Among self-declared low-meat consumers, the percentage of participants whose meat consumption fell within the recommended amount was rather low (19·5 % in men, 30·8 % in women).
Predictors of meat consumption among consumers who reported eating little or no meat
Self-declared low-meat consumers varied considerably in their meat intake levels (Tables 2 and 3). A three-step hierarchical regression analysis was conducted to identify factors associated with higher total meat intake in these participants (Table 5). The correlations between the predictors and total meat consumption are shown in Appendix 2. The final regression model including all variables was significant with F (17,1595) = 23·16, P < 0·001 and explained about 20 % of the variance. Motives alone accounted for 11 % of the variance in total meat consumption (model 2); the sociodemographic variables (model 1) and consumption of plant-based meat alternatives with the perceived difficulty of practising a low/no-meat diet (model 3) explained an additional 4 % and 5 %, respectively.
Table 5 Hierarchical multiple regression analysis predicting total meat consumption in a sample of Swiss adults who reported eating little or no meat (n 1596); Swiss Food Panel 2.0 (survey 2017)
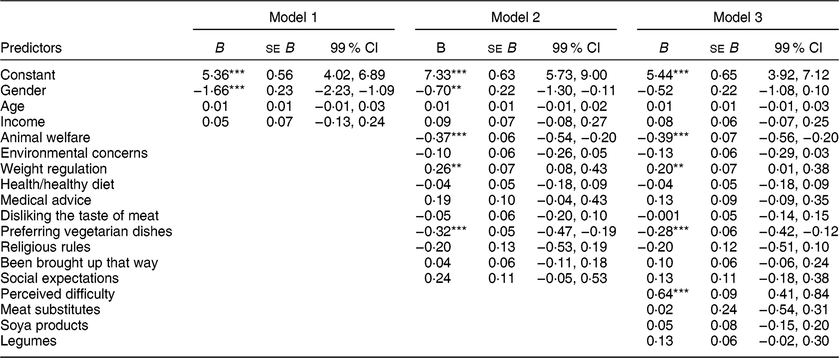
B, unstandardised beta; se B, standard error of B; 99 % CI, 99 % bias-corrected accelerated CI (predictors are significant if the 99 % CI of B does not include 0).
Results are based on 1000 bootstrap samples.
Total R 2 = 0·20, R 2 = 0·04 for step 1, ΔR 2 = 0·11 for step 2, ΔR 2 = 0·05 for step 3.
Gender: 1= female, 0= male.
**P < 0·01, ***P ≤ 0·001.
Female gender was a significant predictor of lower total meat consumption in models 1 and 2 (see Table 5) but no longer significant when the perceived difficulty of practising a low/no-meat diet and plant-based protein consumption were additionally included in model 3; age and income did not predict meat consumption. Stronger motives regarding animal welfare and a stronger preference for vegetarian foods were associated with lower meat consumption, and stronger weight-loss motivation was associated with higher meat consumption. All the other motives included were not significant predictors. Participants who perceived following a low-meat or meatless diet as more difficult consumed more meat. None of the plant-based alternative sources of protein were associated with lower meat intake.
Discussion
The motives for pursuing a vegetarian or semi-vegetarian diet are diverse. The present study assessed the prevalence of commonly mentioned motives for following a vegetarian diet among a large sample of self-declared low-meat consumers as well as vegetarians/vegans and pescatarians. Our study confirmed the finding that most individuals are motivated by more than one reason but that certain motives differ in importance depending on the diet style with which people identify(Reference De Backer and Hudders22,Reference Forestell, Spaeth and Kane24) . Although vegetarians and pescatarians indicated largely similar motives for their dietary choices regarding meat, compared with low-meat consumers these two groups are more strongly driven by concerns about animal welfare and environmental issues associated with meat consumption, as well as by taste preferences. Regarding health motives, no differences were observed between vegetarians and non-vegetarians in the motivation to eat healthily, but weight loss turned out to be a stronger motivation in female low-meat consumers than in female vegetarians. Previous studies have reported similar motivational differences regarding weight regulation, especially in young women(Reference Forestell, Spaeth and Kane24,Reference Gilbody, Kirk and Hill32) . However, the absolute values in our sample (see Fig. 1) indicate that the weight-loss motivation was much less prevalent across all the diet groups than was the motivation to eat healthily. A possible explanation for why the groups did not differ regarding their motivation to eat healthily is that beliefs about the healthiness of meat vary among consumers, some of whom associate it with negative health outcomes and some of whom perceive meat as an important source of essential nutrients such as protein and iron, and therefore as a component of a healthy diet(Reference Verbeke, Perez-Cueto and Barcellos33). In a recent Belgian study, only about 22 % of the respondents believed that meat consumption is unhealthy(Reference Mullee, Vermeire and Vanaelst23). Moreover, about 24 % even viewed eating vegetarian food frequently as unhealthy(Reference Mullee, Vermeire and Vanaelst23). As suggested by previous research, consumers’ awareness of the environmental impact of meat consumption is generally rather low(Reference Hartmann and Siegrist34) and they tend to underestimate it compared with other product characteristics, such as the packaging(Reference Tobler, Visschers and Siegrist35). Because both the vegetarians and semi-vegetarians in our study reported a relatively high environmental motivation for their dietary choices regarding meat, we suggest that people practising these diet styles are more aware of and knowledgeable about the environmental issues associated with meat production than are regular meat consumers. However, this inference requires further exploration.
Similarly to earlier studies(Reference Ruby18,Reference Rothgerber36,Reference Vinnari, Montonen and Harkanen37) , we observed an inconsistency between people’s self-declaration as vegetarian and their self-reported meat consumption in the sFFQ. On average, vegetarians and pescatarians reported consuming meat occasionally or even regularly. There are several possible explanations for this discrepancy. Although there are many vegetarian and vegan alternatives to meat(Reference Apostolidis and McLeay17) vegetarians may still face situations in which these foods are unavailable, leaving them no meat-free options(Reference Ruby18). Furthermore, in certain social situations occasional meat intake may be necessary to avoid embarrassment(Reference Ruby18). Interestingly, in our study the meat consumption of vegetarian males was considerably higher than that of vegetarian females. Apart from males’ generally higher food intake(Reference Herman, Polivy, Chrisler and McCreary38), a possible explanation for this finding is that males face more social pressure to eat meat in certain situations. Moreover, meat is often associated with typical masculine attributes (e.g. power and virility(Reference Ruby and Heine39)) and vegetarian men are perceived as weaker and less masculine compared with omnivores(Reference Ruby and Heine39), especially by other men. This may also explain why males perceived it as more difficult to consistently follow a vegetarian diet in our sample. Nevertheless, even though the questionnaire in the present study explicitly defined the diet styles, the self-evaluation of diet style seems to be problematic. People may have different ideas of what constitutes a vegetarian diet and the social consensus regarding the definition of such a diet may not always be sufficiently clear(Reference Rothgerber36). Moreover, self-identified vegetarians may differ in how strictly they follow their diet, to what degree they allow themselves to make exceptions, and how strongly they experience cognitive dissonance or inner conflict when consuming meat.
Apparently, although a substantial number of meat eaters view their meat intake as rather low, this is not in fact the case when comparing their consumption level with official dietary recommendations. In our sample, about 81 % of the male and 69 % of the female self-declared low-meat consumers exceeded the recommended upper limit of three portions per week(15). This finding has implications for the efforts of public health organisations to bring peoples’ meat consumption within a healthy range. It demonstrates the need for further awareness campaigns to disseminate appropriate knowledge about the dietary recommendations for meat and to enable an accurate self-evaluation of one’s meat intake.
Our analyses support the assumption that both vegetarian and semi-vegetarian diets are beneficial for health(Reference Derbyshire11,Reference McEvoy, Temple and Woodside40) , contributing to a better diet quality and to a healthy body weight. However, for obese males, these associations were not shown in our sample. Based on our results, vegetarians and pescatarians seemed not to compensate for the absence of meat in their diets by eating more other animal-based proteins such as eggs or dairy products. And for plant-based proteins, gender differences seem to exist. Whereas vegetarian women reported higher intake of all kinds of plant-based proteins, vegetarian males hardly differed from their omnivore counterparts in this respect. Moreover, among low/no-meat consumers, higher consumption frequencies of plant-based protein sources were not associated with lower meat intake, which may indicate that the available products are not perceived as equivalent alternatives for meat. Nevertheless, regular and low-meat eaters also seem to consume meat substitutes on occasion. The low consumption frequencies reported, however, suggest that the products currently on the market may not be sufficiently satisfying, especially for avid meat eaters. Hence, these omnivores may represent an interesting market segment, especially considering their size and the potential market share of total consumption. Therefore, industries should focus their efforts on using new food technologies to improve the taste and texture of meat substitutes in order to increase their similarity to real meat. This may help to convince omnivores that such products are viable alternatives to meat and may encourage them to replace meat with plant-based protein sources more often. However, our results equally suggest that different target groups in the food market have opposite needs from meat substitutes. On the one hand, there is a large group of omnivores with a low willingness to give up meat consumption, creating a need for meat substitutes that are very similar to meat. On the other hand, as we have seen, many vegetarians do not like the taste of meat or prefer vegetarian options, creating a need for meat alternatives that do not taste like meat but have the same functionality.
Strengths and limitations
The large sample size of randomly selected participants and the equal inclusion of males and females represent clear strengths of our study. However, there are also some limitations that should be mentioned. The first is related to the assessment of BMI. Self-reported body weight can be subject to under-reporting, especially in women and heavier individuals(Reference Gunnare, Silliman and Morris41), and thus might lead to less accurate estimations of weight status. However, the use of BMI based on self-reported data is very common in large nutritional studies and direct measurements would not be feasible. Moreover, it has been shown that the correlation between self-reported and objectively measured weight is relatively high(Reference Luo, Thomson and Hendryx42). Another limitation is the way we asked participants whether or not they viewed their usual meat consumption as low. Future studies should provide a clearer definition of what is understood under a low consumption. Otherwise, participants’ understanding of low consumption will remain unclear as will the standard to which it is related, such as official dietary recommendations, the consumption level of friends and relatives, or a participant’s own consumption at an earlier time. We also did not assess consumers’ familiarity with the official dietary recommendations for meat, which is relevant.
Conclusion and implications for public health
The present study supports the assumption that ethical motives along with taste preferences are more prevalent in consumers identifying with a vegetarian lifestyle, whereas weight-loss motivation plays a more important role for low-meat consumers, especially in women. It also contributes new evidence that vegetarian and semi-vegetarian diets may be associated with better diet quality and a lower prevalence of overweight, even though these associations should be further investigated in long-term studies. Further, the study reveals that a substantial number of consumers view their meat consumption as low even though this is not the case when comparing their intake levels with the official dietary recommendations. This has implications for public health organisations’ efforts to promote healthy levels of meat consumption in the public. Our study provides some hints for where to start. First, there seems to be a lack of knowledge about what is considered a low meat intake. Many people seem to have incorrect reference standards. This problem could be addressed with public awareness campaigns in order to improve consumers’ knowledge about and ability to appropriately evaluate their own meat intake. Second, our results suggest that the perceived difficulties of practising a diet with little or no meat were associated with higher meat consumption and thus constitute a barrier to reaching a healthy meat-intake level. This highlights the need for public health programmes which provide strategies to support people in eating more plant-based diets and to break their ‘bad’ habits regarding meat. Enhancing the familiarity with and preference for vegetarian alternatives, for example by launching campaigns for meatless days (e.g. ‘veggie day’(Reference Mullee, Vermeire and Vanaelst23,Reference de Boer, Schösler and Aiking43) ), implementing campaigns for portion size reduction(Reference de Boer, Schösler and Aiking43) or addressing concerns about animal welfare may be effective ways to promote healthier and more sustainable diets in the public without suggesting that consumers must completely stop meat consumption.
Acknowledgements
Financial support: This research received no specific grant from any funding agency in the public, commercial or not-for-profit sectors. Conflict of interest: The authors declared no conflict of interest. Authorship: M.S. and C.H. participated in the design of the study; D.H. and C.H. conducted the data analysis; D.H. wrote the manuscript; M.S. and C.H. made critical comments on the draft. Ethics of human subject participation: This study was conducted according to the guidelines laid down in the Declaration of Helsinki and all procedures involving human subjects were approved by the Ethics Committee of ETH Zurich (EK 2017-N-19). Written informed consent was obtained from all subjects.
Appendix 1 Foods and beverages included in the diet quality index
Appendix 2 Correlations of total meat consumption and predictors. Calculations based on the sub-sample of participants who reported eating little or no meat (n 1596); Swiss Food Panel 2.0 (survey 2017)

n vary due to missing values.
**P < 0·01 (two-tailed), ***P ≤ 0·001 (two-tailed).


