


Dietary transition, increasing obesity and excessive use of alcohol and tobacco are major challenges to public health among indigenous peoples(Reference Anderson, Robson and Connolly1–Reference Young and Bjerregaard3). In Greenland, the dietary transition has included a decrease in the consumption of country food and an increased consumption of sugar-sweetened beverages and non-nutritious food and has paralleled a dramatically increasing prevalence of obesity(Reference Bjerregaard and Dahl-Petersen4,Reference Dahl-Petersen, Larsen and Nielsen5) . In 2018, 24 % of men and 32 % of women had a BMI ≥ 30 kg/m2(Reference Larsen, Hansen and Ingemann6). Alcohol consumption was excessively high during the 1970s and 1980s. Although the average consumption has decreased, risky alcohol use is still considered an important public health challenge(Reference Larsen, Hansen and Ingemann6). In addition, with 52 % daily smokers, the risk of tobacco-related disease prevalence and mortality is high(Reference Larsen, Hansen and Ingemann6).
Greenland has approximately eighty communities (towns and villages) situated mostly on the Central West Coast with no connecting roads. The climate is arctic. A town is defined historically as the largest community in each of seventeen districts. In 2018, the population of the towns varied between 366 and 5491 and an additional 17 796 residents lived in Nuuk, the capital. The population in villages varied from <10 to approximately 550. The total population of Greenland is 56 000, of whom 92 % are Greenland Inuit (syn. Greenlanders, Kalaallit)(Reference Young and Bjerregaard7). Genetically, Greenlanders are Inuit with a 25 % admixture of European, mainly Scandinavian genes(Reference Moltke, Fumagalli and Korneliussen8). Greenland Inuit are closely related genetically and culturally to the Inuit/Iñupiat/Inuvialuit in Canada and Alaska and somewhat more distantly to the Yupiit of Alaska and Siberia(Reference Young and Bjerregaard3). People with aboriginal identity comprise 4·3 % of the population of Canada but represent 53 % in the Canadian North. Alaska Natives comprise 20 % of the population of Alaska(Reference Young and Bjerregaard7).
In Greenland, approximately 80 % of food is imported food items purchased in kiosks or supermarkets, whereas locally harvested food is either purchased at local hunters’ markets or hunted and fished privately(Reference Jeppesen and Bjerregaard9,Reference Rasmussen, Duhaime, Dewailly, Duhaime and Bernard10) . In the villages, the shops have less food available than in towns. Alcohol and tobacco are also sold in supermarkets.
Social variation in dietary patterns is ubiquitous, but studies from indigenous populations in affluent Western countries are scarce and typically compare indigenous populations with the majority population. To provide a complete picture of a nation’s health, studies on its minorities, including studies of social disparities within its indigenous peoples, are important. Studies from various parts of the world have consistently found an association between high social position and consumption of fruit, vegetables, fibre and fish and an association between low social position and nutrient-poor energy-dense diets(Reference Allen, Williams and Townsend11–Reference Okechukwu, Davison, Emmons, Berkman, Kawachi and Glymour14). Similarly, the consumption of alcohol(Reference Wagenaar, Salois and Komro15,Reference Aage16) and tobacco(Reference Chaloupka, Powell and Warner17) has been associated with price levels. In Arctic Canada, indigenous survey participants with higher socio-economic status were more likely to consume nutrient-dense foods, suggesting possible cost barriers(Reference Erber, Beck and Hopping18). Education was positively associated with the consumption of fruit and vegetables and negatively associated with the consumption of traditional food. Households on income support were more likely to consume traditional food and non-nutrient-dense foods(Reference Hopping, Erber and Mead19). Indigenous survey participants with higher levels of formal education spent more on fruit and vegetables and less on traditional food than those with lower levels of formal education(Reference Pakseresht, Lang and Rittmueller20). According to the most recent population health survey in Greenland in 2018, the locally harvested food items that provided the most energy included blubber (on seal meat or eaten with dried fish), Greenland halibut, caribou meat, seal meat and dried fish and meat (Bjerregaard unpublished results). In Greenland, the consumption of traditional food (seal meat) decreased by social position, such as job and place of residence, whereas the prevalence of a balanced diet and a diet characterised by imported meat increased(Reference Bjerregaard and Dahl-Petersen4,Reference Bjerregaard and Jeppesen21) .
The aim of the article is to explore the role of social position and purchase power for dietary patterns and expenditure on food and other consumables among the Greenland Inuit. It was hypothesised that among the Greenland Inuit, a healthy diet is directly, and an unhealthy diet inversely associated with social position and that low social position is associated with low expenditure on food. Because alcohol and tobacco are heavily taxed and expensive in Greenland, it was further hypothesised that expenditure on alcohol and tobacco is directly associated with social position.
Methods
Data collection
Data were collected from 2017 to 2019 as part of a countrywide cross-sectional health survey in Greenland (Fig. 1)(Reference Larsen, Hansen and Ingemann6). The participants aged 15 years and older were selected through a stratified random sample of adults in Greenland who had been born in Greenland or Denmark. From each of ten strata defined according to geographical criteria (South, Mid, Northwest, North and East Greenland) and urbanisation (towns with 2000 inhabitants or more, towns with <2000 inhabitants, villages), 1–2 towns and several villages were chosen at random. Some of the logical strata were empty. From the towns, a random sample of inhabitants aged 15+ was invited. From the selected villages, all inhabitants aged 15+ were invited to participate in the study. Data were collected by interviews and self-administered questionnaires in twelve towns and eight villages with a participation rate of 52 %. Interviews provided information about sociodemographic factors, diet and smoking. Alcohol use was reported in a self-administered questionnaire. Questionnaires were developed in the Danish language, translated into Greenlandic, back translated and revised, and interviews were conducted in the language of choice of the participant, which was most often in Greenlandic (Kalaallissut), by native Greenlandic-speaking interviewers who had been trained in the study procedures. The mean duration of an interview was 49 min. As the study included the collection of clinical data and blood samples, which were not used in the present paper, the duration of the total session was 2·5 h. The participants were compensated with 200 DKK (27 EUR) for their time. A total of 2436 Inuit participated in the survey. Inuit ethnicity was defined by the interviewers at enrolment based on primary language and self-identification.
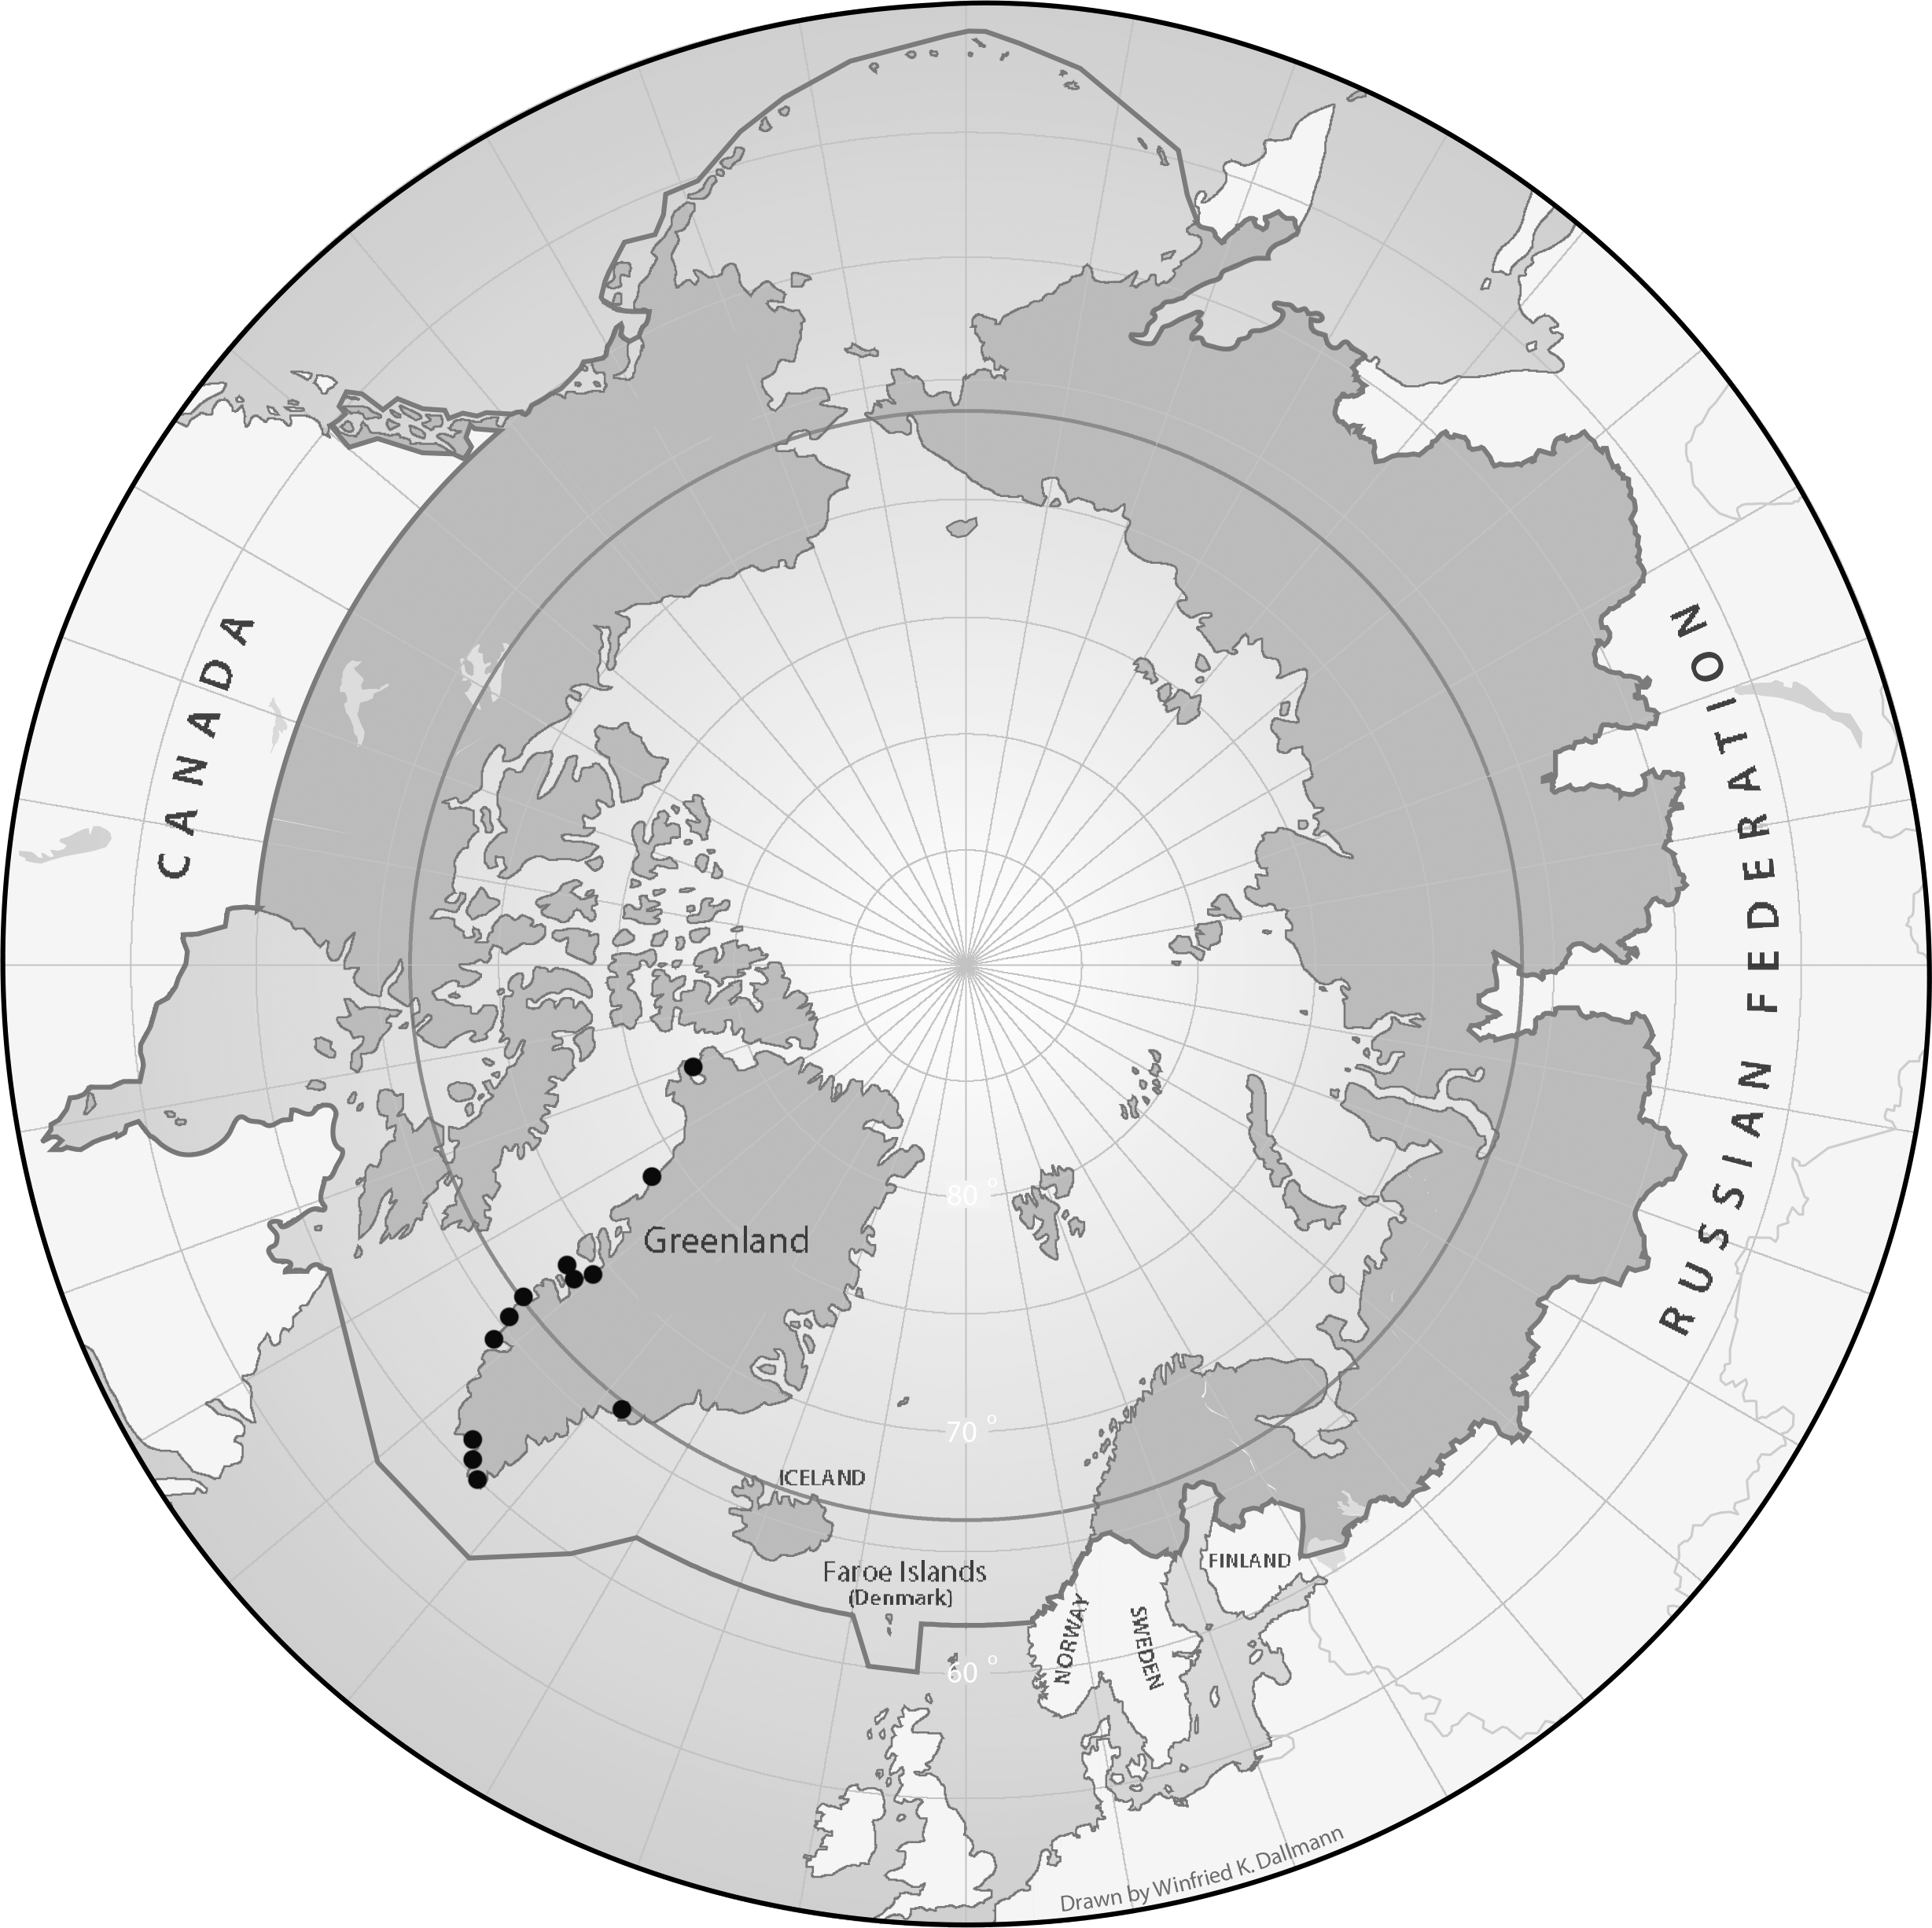
Fig. 1 Map of the circumpolar region with data collection sites in Greenland marked with black circles. Map by Winfried Dallmann, Norwegian Polar Centre
Demographic and social indicators
The household asset score is an indicator of social position that is closely associated with more traditional measures of socio-economic position, such as education and income, but it has certain practical advantages and is often used in a Greenland context(Reference Bjerregaard and Dahl-Petersen22,Reference Bjerregaard, Dahl-Petersen and Larsen23) . Participants were asked about their ownership of six household items: video/DVD player, computer, microwave oven, washing machine, dishwashing machine and internet. Here, 0/1 answers were added, yielding a score ranging from 0 to 6. Participants with scores 0–2 were subsequently combined due to few participants in each category. All participants answered these questions.
Food intake and cost of food
The interview included a forty-seven-item quantitative FFQ with thirteen locally harvested and thirty-four imported food items (see supplementary material). Interviewers were instructed to ask about typical food intake during the last 12 months. The frequency of consumption was reported as the (open-ended) number of times per day, week, month or year. For each food item, one of four portion sizes was selected (fractions were allowed). The FFQ has been validated by biomarkers for the traditional marine diet(Reference Jeppesen, Jørgensen and Bjerregaard24). Food intake was estimated by multiplying frequency and portion sizes adjusted with a yield factor determined for the actual food items. The intake of energy, macronutrients and certain micronutrients was calculated from published concentrations using Microsoft Excel Office 365 and IBM SPSS Statistics version 25(Reference Andersen25–28). A total of 201 participants (8·3 %) reported unrealistically low or high daily energy intake (<3350/2100 kJ and >17 000/15 000 kJ, respectively, for men/women) and were excluded(Reference Willet29). Dietary patterns were calculated for participants with realistic energy intake according to a method described earlier(Reference Bjerregaard and Jeppesen21) with a few revisions. The algorithm initially classified all participants as having a ‘standard diet’. If their diet contained 30 energy percentage (E%) or greater from imported meat, participants were reclassified as having a dietary pattern of ‘imported meat.’ In the next step, if 30 E% or greater came from food items categorised as unhealthy (candy, sugar-sweetened beverages, cakes and cookies, added sugar, convenience snacks, fast food), participants were reclassified as having an ‘unhealthy diet’. In the next step, if their diet contained 30 E% or greater from locally harvested food, participants were reclassified as having a ‘kalaalimernit (local Greenlandic food)’ dietary pattern. Finally, participants who met eight or more of nine criteria for a balanced diet were reclassified as having a ‘balanced’ dietary pattern. The nine criteria were defined by operationalising the official dietary guidelines for Greenland. The criteria for a balanced diet were as follows: >10 E% kalaalimernit but consumption of marine mammals less often than 4 times a week; consumption of fish at least twice a week; consumption of fruit at least three times a week; consumption of vegetables at least three times a week; consumption of whole-grain products at least three times a week; consumption of <35 E% fat; consumption of <15 E% refined sugar; consumption of chips less often than daily and drinking of sugar-sweetened beverages less often than daily. The algorithm determined that if a participant initially fell into more than one category, ‘balanced diet’ was chosen above the four other categories. In addition, ‘kalaalimernit’ was chosen above ‘unhealthy’, ‘imported meat’ and ‘standard diet’; ‘unhealthy’ was chosen above ‘imported meat’ and ‘standard diet’; and ‘imported meat’ was chosen above ‘standard diet’.
The prices of forty-seven food items as well as alcoholic beverages and cigarettes were collected from fourteen stores in seven towns in 2018–2019. Average prices were calculated as arithmetic means. Analyses of the expenditure on food were only performed for residents of towns (82 % of the sample) because the information about the cost of locally harvested food fluctuated considerably in the villages due to food sharing and informal markets and because information about the cost of store-bought food was only available from one village. Prices were calculated for each of the forty-seven individual food items and for nutritious and non-nutritious food groups, and the latter comprised candy, sugar-sweetened beverages, cakes and cookies, added sugar, convenience snacks, fruit juice, tea and coffee. The commodity basket included food, alcoholic beverages and tobacco.
Statistical methods
The hypotheses concerning associations of social position with diet and expenditure were explored in univariate general linear models adjusted for age and sex using the standard statistical programme IBM SPSS Statistics version 25. The household asset score was entered as a fixed factor, and age and sex were entered as covariates. Population-estimated marginal means with P-values across categories of household asset scores are tabulated in Table 4. In Tables 3 and 4, analyses were performed separately for each component of the commodity basket with energy, weekly expenditure and cost per 1000 kJ as the dependent variables. In Table 4, the distribution of household assets by dietary patterns was analysed separately for each pattern with dietary group membership as a 0/1 variable as the dependent variable. Alpha was 0·05. Outcome variables were tested by Q–Q plots, and a normal distribution was assumed. Calculations were performed using untransformed values. In Tables 2 and 4, on a few occasions, the expenditures on nutritious and non-nutritious food did not add up to the total expenditure on food due to rounding of results.
Results
Demography and social position
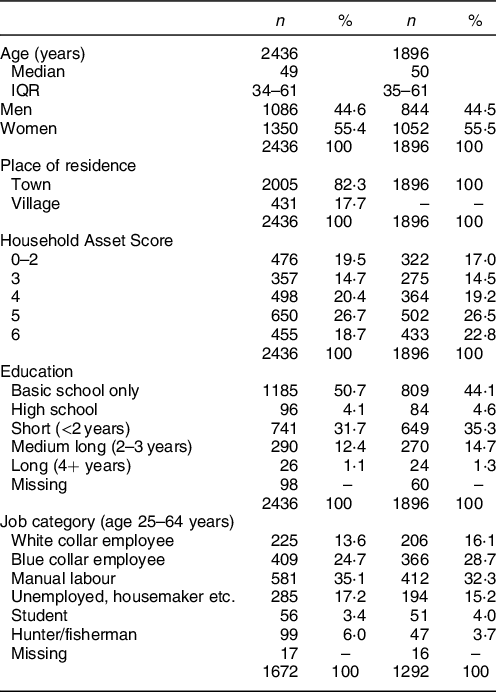
The data were geographically representative of all of Greenland, and the participants comprised >6 % of the adult Inuit population. However, the cost of food, alcohol and tobacco was only available for the population in towns (82 % of participants). Table 1 presents the population characteristics of all 2436 Inuit in the survey and the 1896 Inuit from towns with valid information on diet who comprised the study base. With an age span of 15–94 years, the median age was 50 years (IQR 35–61 years). Women were overrepresented compared with the population (55 % v. 49 %) due to their higher participation rate. Household assets were normally distributed and slightly shifted to the right with an average score of 4·2. The 1896 participants in the study base were more affluent, had better education and held better paid jobs than all Inuit participants. This scenario reflects the socio-economic difference between towns and villages.
Table 1 Population characteristics of all 2436 Greenland Inuit in the 2018 Greenland Population Health Survey and of 1896 Inuit with valid information on diet and living in towns
Cost of food, alcohol and tobacco
It was decided to divide the food basket into nutritious and non-nutritious food items because previous studies among the Inuit in Greenland suggest that the consumption of non-nutritious food is rapidly increasing and is a probable contributory cause of an increasing prevalence of obesity(Reference Bjerregaard and Dahl-Petersen4). It was furthermore decided to analyse the expenditure on alcoholic beverages and tobacco in addition to the food basket cost because qualitative interviews suggest that these consumables compete with food in the daily budget of some people in Greenland(Reference Bjerregaard, Olesen and Curtis30).
Valid dietary information was obtained from 92 % of participants. Commodity basket cost was calculated for 1896 residents in towns who had valid dietary information. Table 2 shows commodity basket costs for Inuit from twelve towns. The cost of food was on average 470 Danish kroner (DKK) (63 Euro) per person per week. The total cost of food, alcoholic beverages and tobacco that made up the commodity basket was 735 DKK (98 Euro), of which less than half was the cost of all nutritious food items together, whereas non-nutritious food items (candy, sugar-sweetened beverages, fruit juice, cakes, sugar, convenience snacks, fast food, tea and coffee) comprised 21 % of the weekly expenditure, alcoholic beverages 18 % and tobacco 18 %. To demonstrate the specific dietary priorities, the weekly expenditure on the ten food groups that contributed the most to the total expenditure was listed along with the price per 1000 kJ of each. Vegetables, sugar-sweetened beverages and marine mammals were the most expensive food items per 1000 kJ.
Table 2 Weekly expenditure, energy consumption and expenditure per 1000 kJ on the commodity basket: nutritious food, non-nutritious food, alcoholic beverages and tobacco. Expenditure and price per 1000 kJ for top ten food items. 1896 Greenland Inuit with valid information on food intake. Greenland Population Health Survey 2018
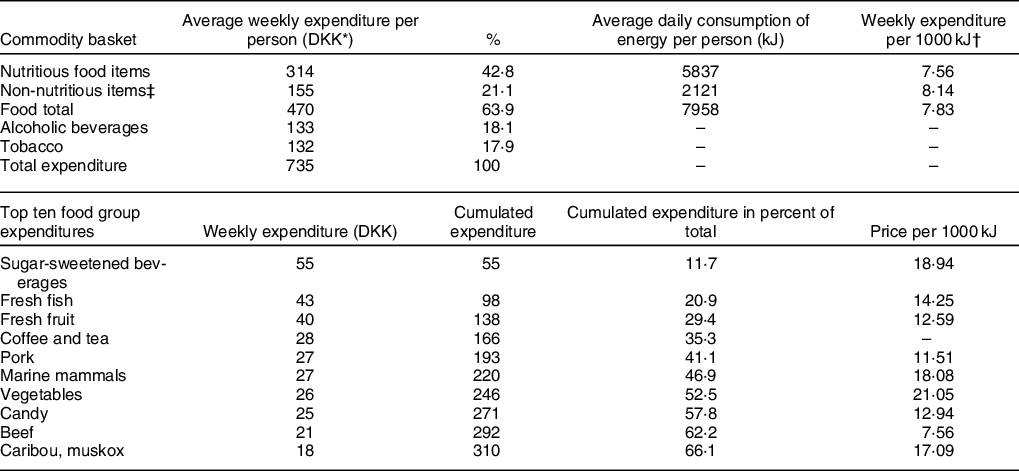
* 1 EUR = 7·45 DKK.
† Excluding tea and coffee.
‡ Candy, sugar-sweetened beverages, fruit juice, cakes, sugar, convenience snacks, fast food, tea and coffee.
Dietary patterns
Only 10 % of the participants adhered to the recommended (balanced) diet, whereas 31 % followed an unhealthy dietary pattern (Table 3). The energy contents of the dietary patterns differed significantly, and kalaalimernit and the unhealthy pattern exhibit the most energy. The percentage of energy from non-nutritious food was lowest for the balanced diet (11 %) and four-fold increased (42 %) for the unhealthy diet. The food basket cost varied significantly among the five dietary patterns. Kalaalimernit was the most expensive, and the cost per 1000 kJ also varied significantly among the five dietary patterns, with the balanced diet and kalaalimernit having the highest cost. In a pairwise comparison with the standard diet, most dietary patterns differed significantly (P < 0·001) with respect to energy, cost of food basket and cost per 1000 kJ, except for energy in the balanced diet (P = 0·13), cost of food basket for imported meat (P = 0·11) and cost per 1000 kJ for the unhealthy diet (P = 0·32) (not shown in the table).
Table 3 Energy and weekly expenditure on food basket by dietary pattern, 1896 Greenland Inuit with valid information on food intake, Greenland Population Health Survey 2018, adjusted for age and sex in General Linear Models
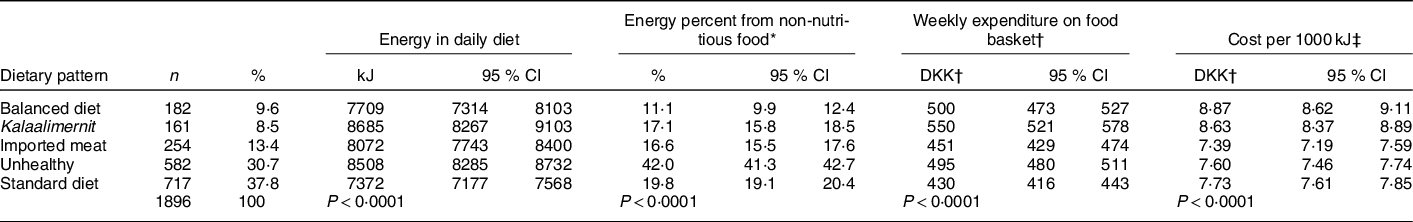
* Candy, sugar-sweetened beverages, fruit juice, cakes, sugar, convenience snacks, fast food, tea and coffee.
† 1 EUR = 7·45 DKK.
‡ Excluding tea and coffee.
Social variation
Dietary patterns, energy intake, food basket cost and cost per 1000 kJ all varied by social position (household asset score) (Table 4). Although the prevalence of a standard diet did not vary, the prevalence of an unhealthy diet was twice as high among those of low social positions than among those of high social positions. Conversely, the prevalence of a balanced diet and to a more limited extent the diet of imported meat increased by social position. Energy intake from nutritious food increased with social position, and energy intake from non-nutritious food decreased, whereas total energy intake was constant across social groups. As expected, the expenditure on food also varied. The expenditure on the food basket (nutritious and non-nutritious food) increased by social position but was only 11 % higher in the highest social group than in the lowest group. Furthermore, whereas the expenditure on nutritious food increased by social position (P < 0·0001), the expenditure on non-nutritious food decreased (P = 0·055). The expenditure on alcoholic beverages and tobacco was significantly higher among those with low social positions, and the total expenditure on consumables was 19 % increased among the participants with low social positions (P < 0·0001). The expenditures on non-nutritious food, alcoholic beverages and tobacco were statistically correlated (P < 0·05 adjusted for age, sex and social position), whereas the expenditure on nutritious food was not correlated with any of the three factors. The cost per 1000 kJ increased by social position for both nutritious and non-nutritious food.
Table 4 Dietary patterns, energy consumption, weekly expenditure on the commodity basket and cost per 1000 kJ by social position, 1896 Greenland Inuit with valid information on food intake, Greenland Population Health Survey 2018, adjusted for age and sex in General Linear Models
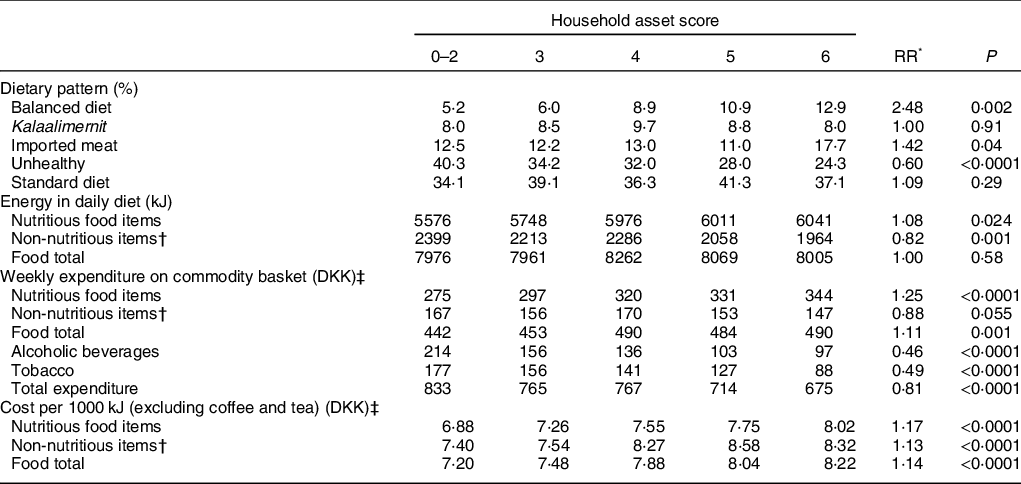
* Relative risk of highest/lowest category of household assets.
† Candy, sugar-sweetened beverages, fruit juice, cakes, sugar, convenience snacks, fast food, tea and coffee.
‡ 1 EUR = 7·45 DKK.
Discussion
Less than half of the expenditures on commodities (43 %) were used to buy nutritious food, and the remainder were used to buy non-nutritious food, alcoholic beverages and tobacco. Seventy-three percentage of the energy consumption, and 67 % of the food expenditures were related to nutritious food, which was less costly than non-nutritious food per kJ. The cost of a balanced diet and that of an unhealthy diet were similar, but the cost per 1000 kJ was higher and the energy consumption was lower for the balanced diet. Participants with a low social position more often than those with a high social position chose the unhealthy pattern, whereas those with a high social position more often chose the balanced alternative. Participants with a low social position spent less money on the total food basket than those with a high social position but more money on non-nutritious food, alcohol and tobacco.
Previous studies from low-income populations have demonstrated that healthy food baskets and healthy diets cost more than non-healthy alternatives(Reference Jetter and Cassady31,Reference Temple and Steyn32) . Our study did not compare the cost of food baskets, and the discrepancy between our study and the cited studies regarding diets are probably explained by two factors, namely, that participants eating a healthy diet consumed less than those eating an unhealthy diet and the fact that as much as 20 E% of the unhealthy diet was accounted for by sugar-sweetened beverages, which are among the most expensive food items per 1000 kJ. The association between high social position and consumption of fruit, vegetables, fibre and fish and the association between low social position and nutrient-poor energy-dense diets have been found in numerous studies(Reference Allen, Williams and Townsend11–Reference Okechukwu, Davison, Emmons, Berkman, Kawachi and Glymour14,Reference Hopping, Erber and Mead19,Reference Pakseresht, Lang and Rittmueller20) .
The expenditure on food high in energy and low in nutrients (non-nutritious food) amounted to 155 DKK (21 Euro), which is 33·0 % of the total expenditure on food. This proportion is similar to the distribution in Arctic Canada, where non-nutrient-dense foods accounted for 33·8 % of the total food cost(Reference Pakseresht, Lang and Rittmueller20). The detailed list of food groups showed that the top ten items accounted for two-thirds of the total expenditure. Sugar-sweetened beverages and candy were on the list, and locally harvested fish and meat, fruit, vegetables and imported meat were also on the list. Although the average price per 1000 kJ of non-nutritious food items in our database was lower than that of other food items, which is also the case in most other studies(Reference Maillot, Darmon and Darmon33), the average expenditure per 1000 kJ for non-nutritious food in this population was greater than that for other food items. This finding is not inconsistent since expenditure on food groups is greatly affected by the choice of specific food items.
The five dietary patterns varied with respect to energy distributions and cost. The ‘kalaalimernit’ pattern was most expensive because this diet is characterised by large quantities of (expensive) meat. The standard diet was the cheapest given its low energy contents and low cost per 1000 kJ, but we do not have an explanation for the low energy contents of the standard diet. It is noteworthy that the expenditures on a balanced and an unhealthy food basket were similar. This finding was attributed to the fact that the balanced diet was less energy rich but more expensive per kJ than the unhealthy diet.
It may be argued that the prevalence of a balanced diet is low, also among the wealthiest participants, but the definition of a balanced diet is arbitrary and must be seen in the context of dietary recommendations. The most common reason for not having a balanced diet was a high consumption of sugar-sweetened beverages and sugar added to coffee and tea. This makes the high consumption of sugar an issue of great importance for public health.
For several health outcomes, there is documented social variation in Greenland and among indigenous peoples of the Arctic. These include mental health and suicide(Reference Bjerregaard and Dahl-Petersen4,Reference Bjerregaard and Larsen34–Reference Riva, Larsen and Bjerregaard36) , traditional diet, smoking, physical activity, obesity, blood pressure, blood lipids(Reference Bjerregaard and Dahl-Petersen4,Reference Bjerregaard, Dahl-Petersen and Larsen23,Reference Akande, Hendriks and Ruiter37–Reference Riva, Larsen and Bjerregaard40) and height(Reference Bjerregaard41). The household asset score is one of several measures of social position that have been used to demonstrate this social variation among Greenland Inuit. At face value, it is a measure of material wealth and as such a proxy for income, but it is also closely associated with education, job and other indicators of social position(Reference Bjerregaard, Dahl-Petersen and Larsen23). The Household Asset Score has certain advantages over other measures of social position in particular because it is defined for all participants irrespective of age and is normally distributed. Education was skewed with almost half of the participants having no education beyond school and only 1·3 % having a higher education. The job category excludes students and old age pensioners, and an indicator of social transition previously used in Greenland is only defined for the age group 25–64 years because it is partially based on education, job category and permanent residence in adulthood(Reference Bjerregaard and Dahl-Petersen4). The household asset score as an indicator of social position has been used in several studies from Greenland(Reference Bjerregaard and Dahl-Petersen4,Reference Bjerregaard and Dahl-Petersen22,Reference Bjerregaard, Dahl-Petersen and Larsen23) . It differs from information about personal income in that it is a measure of the economic conditions of the entire household and that it is a measure of what income is spent on by ways of durable goods. Pearson’s r 2 between income and household assets was only 0·20, which suggests that the two indicators measure different aspects of the personal economy(Reference Bjerregaard, Dahl-Petersen and Larsen23). Similar measures have been used elsewhere in the Arctic(Reference Pakseresht, Lang and Rittmueller20).
In our study, the wealthiest participants spent more money on food than the least wealthy participants, but whereas the wealthiest participants spent considerably more money on nutritious food, they spent less on non-nutritious food, alcohol and tobacco. The wealthiest more often than other participants adhered to a balanced diet or a diet of imported meat, whereas the least wealthy more often adhered to an unhealthy diet and spent more money on alcohol and tobacco. A reasonable interpretation of this is that the least wealthy participants gave priority to the purchase of alcohol, tobacco and non-nutritious food and consequently had to cut down spending on nutritious food.
It is thus probable that the social differences in diet, alcohol and tobacco are explained more by mechanisms other than by purchase power. A review of socio-economic disparities in health behaviour has outlined nine possible explanations for, among other things, poor nutrition and smoking(Reference Pampel, Krueger and Denney42). Several of these possible explanations are relevant in the Greenland context, but in particular, the following seems plausible. First, disadvantaged social position and inequality reduce the capacity to cope, and inequality does exist both in relation to other citizens in Greenland and to Denmark. For participants thus exposed, alcohol, smoking and eating food with little nutritional value but immediately gratifying effects result in pleasure and relaxation. This behaviour is enhanced by the influence of family members, relatives, friends and neighbours in the same disadvantaged circumstances. Second, from an economic perspective, the lower lifetime earnings and wealth of persons with low socio-economic positions are postulated to give these less reason to invest in future longevity and more reason to focus on the present in making decisions about health behaviours. However, this assumes a rational approach to health behaviour that may be tentative. Third, education has been shown to increase the skills needed to overcome obstacles to good health, such as nicotine addiction and the desire for unhealthy foods and excess energy intake, and our measure of social position is associated with education. Other potential explanations(Reference Pampel, Krueger and Denney42) appear less relevant in the context of Greenland. According to our results, lack of money seems not to be an important reason for poor health behaviour and the influence of deprived neighbourhoods is also not considered relevant since the towns that have been surveyed are all small with the same infrastructure serving the whole population.
Strengths and weaknesses
The present study is one of few analyses of social variation in health determinants within an indigenous population rather than only a comparison between indigenous and nonindigenous populations. It is a strength of the study that it is countrywide and includes a large percentage of Greenland Inuit. The data on diet and cost are unique to this study. Furthermore, the household asset score is a robust measure of social position in Greenland that has been used alone or in combination with other social indicators since the first population health survey in 1993.
The recruitment of participants was random, but the participation rate was only 52 %. One weakness is therefore the possibility of recruitment bias. The participation rate was lowest among young adults and among men. Few did not participate because of illness (2·8 % of the sample). More did not participate because the interviewers were unable to contact them (12 %), and most did not participate because they chose not to participate (31 %)(Reference Larsen, Hansen and Ingemann6). In general, persons without employment and other socially vulnerable persons, including those with a risky pattern of alcohol and drug use, are underrepresented in population health studies. This was the case for Greenland but only moderately so(Reference Dahl-Petersen, Larsen and Nielsen5). If the sample is thus socially skewed, we would expect the true population average of food expenses to be lower and the overall dietary pattern to be unhealthier. It is a further weakness that there was no information on food prices from villages.
Bias in reporting of diet in a FFQ may be introduced by the inability to recall and synthesise a general diet over a long period. The questions did not specify a short recent time period. Although the interviewers were instructed to ask about the usual diet over the last 12 months, it is reasonable to assume a certain seasonal bias, particularly concerning kalaalimernit, because the catch is seasonal. However, interviews with social groups were evenly spread over the year. The question of social desirability may also introduce bias, which may vary among social groups(Reference Buzzard and Willet43). Most people in Greenland are aware of the recommendations of the Greenland Board of Nutrition and Physical Activity, and some may knowingly or unknowingly modify their reported diet towards the recommendations in the presence of an interviewer who is a fellow Greenland Inuk. Additionally, eating kalaalimernit confers prestige by demonstrating adherence to Inuit values and may therefore be overreported by some participants.
The price of food was collected from fourteen shops in seven towns across the country and included both normal prices and reduced prices for time-limited offers. An average price per food item was used to calculate the cost of food for all participants, but this reduces the interpersonal variation in actual expenses. Some may systematically hunt for low prices for economic reasons, whereas others may just grab what they need without looking at the price. Searching for bargain prices may be not only an economic necessity for some, but it also requires the ability to plan ahead. Unfortunately, it is not possible to explore this issue further in our study. Additionally, for a given food item, there may be cheap variants of low quality and more expensive variants that only the wealthy can afford. Using the same average price for all may reduce variation among social groups, but it is not possible to estimate to what extent with the data at hand.
The consumption of alcohol is severely underreported in surveys in Greenland, whereas the reporting of tobacco consumption is equivalent to the import statistics(Reference Bjerregaard and Becker44). Little is known about social reporting bias for alcohol in Greenland. Our observation of a social gradient for expenditure on alcohol may thus be partly due to reporting bias. However, since it is parallel to the social gradient for tobacco, it seems reasonable to accept its existence.
Our findings demonstrate that low socio-economic groups had a significantly higher prevalence of tobacco and alcohol use compared with high socio-economic groups and consumed less nutritious food than those of high socio-economic status which is in accordance with a WHO-funded study in low-income and lower-middle-income countries(Reference Allen, Williams and Townsend11). The observation that the cost per kJ of non-nutritious food is higher than that of nutritious food is unusual. This is due to a high consumption of expensive sugar-sweetened beverages and contributes to an explanation of why the total expenditure on food is similar for a balanced and an unhealthy diet. We recommend that future studies of commodity basket expenditures among Greenland Inuit be conducted with emphasis on food security, urbanisation and regional differences and additional indicators of social position, such as education and income.
Conclusion
The frequency of a balanced dietary pattern increased by social position, whereas the frequency of an unhealthy diet decreased. This finding corresponds with the results from other studies in the Arctic(Reference Erber, Beck and Hopping18–Reference Pakseresht, Lang and Rittmueller20) and supports our first hypothesis. Our second hypothesis that low social position is associated with low expenditure on food was supported for nutritious food, but the expenditure on non-nutritious food was increased for participants of low social status. The cost per 1000 kJ increased with social position, which indicates that wealthy participants ate more expensive food, possibly of higher quality, but food quality was not studied in the present paper. The expenditure on alcoholic beverages and tobacco was twice as high for participants in low social positions. This finding did not conform with our third hypothesis and disproved the existence of a strong link between consumption and cost of alcohol and tobacco in this population and at this point in time. Compared with other possible mechanisms, such as the capacity to cope and peer influence, purchase power and cost seem to play minor roles in the shaping of dietary patterns and the use of alcohol and tobacco among the Inuit in Greenland. Consequently, reducing the price of nutritious food and increasing the price of non-nutritious food will most likely not change the dietary patterns in the desired direction. Instead, socially targeted interventions and public health promotion regarding food choice and prevention of excessive alcohol use and smoking are needed to change the pattern of purchase.
Acknowledgements
Acknowledgements: Ingelise Olesen was responsible for data collection in Greenland. We also wish to thank the interviewers and the participants, who contributed by generously donating their time. Financial support: This work was supported by the Ministry of Health, Government of Greenland. The ministry had no role in the design, analysis or writing of this article. Conflict of interest: P.B.: none. C.V.L.L.: none. Authorship: P.B. designed the study, participated in data collection and drafted the article. C.V.L.L. was overall responsible for the population health survey, participated in data collection and contributed to the writing of the article. Both authors have approved the final article. Ethics of human subject participation: This study was conducted according to the guidelines laid down in the Declaration of Helsinki, and all procedures involving study participants were approved by the ethical review committee for Greenland. Written informed consent was obtained from all subjects.
Supplementary material
For supplementary material accompanying this paper visit https://doi.org/10.1017/S1368980020005133


