


Obesity is a major risk factor for numerous chronic health conditions such as type 2 diabetes, heart disease, high blood pressure and stroke, various types of cancer, and a number of psychological and social problems( 1 ). The rapid rise in the prevalence of both overweight and obesity for adults and children over the past decades has placed a considerable burden upon the health systems of many nations( Reference Kelly, Yang and Chen 2 ). In fact, the estimated worldwide prevalence of childhood overweight and obesity increased from 4·2 % in 1990 to 6·7 % in 2010 and is expected to reach 9·1 % by 2020( Reference de Onis, Blössner and Borghi 3 ). Trends in New Zealand are similar, where one in twelve children (aged 2 to 14 years) is obese and one in five is overweight( 4 ). Numerous studies suggest that obese children are more likely to be obese into adulthood( Reference Suchindran, North and Popkin 5 ).
Explanations for the rapid rise in child obesity are wide-ranging but the influence of environmental factors has drawn particular attention( Reference Pearce and Witten 6 ). The emergence of ‘obesogenic food environments’ has been posited as a key driver( Reference Swinburn, Egger and Raza 7 , Reference Lake and Townshend 8 ). Without doubt, a complex relationship between food environments and obesity exists, and various models of food systems and behaviours have been proposed( Reference Story, Kaphingst and Robinson-O'Brien 9 ). These include access and availability of either healthy or unhealthy food options near schools and worksites( Reference McKinnon, Reedy and Morrissette 10 ) and the proliferation of cheap, energy-dense foods available from convenience outlets and fast-food venues. A number of studies have provided evidence of a link between the available food options and overweight and obesity( Reference Block, Scribner and DeSalvo 11 – Reference Morland and Evenson 16 ). Another factor is the rise in food consumption away from home, which has also been found to have contributed to the prevalence of overweight and obesity( Reference Swinburn 17 ). Estimates suggest that increased energy intake alone is more than sufficient to explain the weight gain in the US population since the 1970s and for women in the UK since the 1980s( Reference Swinburn, Sacks and Ravussin 18 , Reference Scarborough, Burg and Foster 19 ).
Schools are an important feature of local food environments for children and adolescents as they provide a number of eating options for those enrolled, such as in-school cafeterias, vending machines and nearby food outlets. However, studies examining the influence of school food environments on the dietary behaviour and health of children are contradictory. For example, a study in California found that students were more likely to be overweight or obese if there was a fast-food outlet within 0·5 mile of their school( Reference Davis and Carpenter 20 ) while another study in the USA found that fast-food outlets within 0·1 mile of school was associated with a 5·2 % increase in obesity rates among high-school children, whereas there was not a noticeable effect at greater distances( Reference Currie, Della Vigna and Morettu 21 ). However, other studies have found little evidence of an association between proximity of outlets to schools and health outcomes( Reference Timperio, Ball and Roberts 22 , Reference van der Horst, Timperio and Crawford 23 ).
Geospatial technologies such as Geographic Information Systems (GIS) have proved to be valuable tools in assessing local food environments. Most often the technology is used to determine the proximity of food outlets to schools using either density- or distance-based measures( Reference Davis and Carpenter 20 , Reference Charreire, Casey and Salze 24 – Reference Day and Pearce 30 ). The consensus from this growing body of work is that fast-food and/or convenience stores are most often located within close proximity to schools, giving pupils ready access to obesity-promoting foods. A Chicago-based study found that there were far greater numbers of fast-food outlets located within a 1·5 km radius of schools compared with the numbers that might be expected by chance( Reference Austin, Melly and Sanchez 29 ). Moreover, the densities of fast-food and convenience stores around schools have been found to vary according to neighbourhood income and ethnic composition( Reference Kestens and Daniel 25 – Reference Zenk and Powell 28 , Reference Day and Pearce 30 ). For example, a study of five large urban areas across New Zealand found a significant clustering of fast-food and convenience stores near more deprived schools and schools in areas of high population density and commercial land use( Reference Day and Pearce 30 ).
In a number of countries, including the USA, the UK and New Zealand, the structure and mix of urban food retailing over the past 30 years have changed, with a decline in small grocery stores and increases in large supermarkets, fast-food outlets, cafés and restaurants. The impact of these changes on dietary behaviour and related health outcomes is largely unclear but a small number of longitudinal studies have been undertaken. These include a study of the foodscape in Northumbria in the north-east of England that found no association between food intake and the rapid increases in food outlets between 1980 and 2000 in the area. There was however some evidence of a link between the local school environments in 1980 and changes in BMI over the study period( Reference Burgoine, Lake and Stamp 31 ). In the USA, another study found that over a 15-year period, fast-food consumption was linked with availability within 3 km of home for low-income males, while the relationships between grocery store availability and diet were mixed( Reference Boone-Heinonen, Gordon-Larsen and Kiefe 32 ). Examination of the longitudinal changes in school food environments provides some insight into the extent to which these environments have come to be dominated by outlets selling unhealthy foods, and the potential for these environments to create, maintain and exacerbate inequalities in obesity and contribute to the coinciding increase in the prevalence of overweight and obesity in children.
Building on previous work, in the present study we examine changes in the food environments around schools over a 40-year period in a large urban area of New Zealand.
Methods
Data
The New Zealand Ministry of Education provided the addresses of schools located in Christchurch in 2006. Each school was classified as either primary/intermediate (Years 1–8), middle (Years 1–15) or secondary (Years 7–15). The location of schools for earlier years (i.e. 1966, 1976, 1986 and 1996) was obtained from telephone directories and verified by Internet sources. Food outlet data for 2006 were sourced from the Christchurch City Council which licenses food outlets and from telephone directories for earlier years. The 2006 data included food license categories such as ‘Grocery’ or ‘Takeaway foods’ or business trading name with identifying information such as ‘Fish ‘n’ chips’ or ‘Dairy’ (a colloquial term for a convenience store). For earlier years, we systematically searched the Yellow Pages business telephone directory using classifications such as ‘Foods – takeaway’, ‘Grocery Stores’ or ‘Dairies’ and the business trading name to identify food outlets for the analysis. This data collection approach was verified in earlier food outlet studies( Reference Pearce and Day 33 , Reference Pearce, Day and Witten 34 ). In order to measure changes over time, food outlets were assigned a category, i.e. those selling: (i) a wide range of foods (supermarkets/grocery stores), (ii) a more limited range of foods including ‘dairies’ and small fruit and vegetable shops (convenience) and (iii) predominantly unhealthy foods (fast-food outlets).
A measure of the school's deprivation was derived for each school in each study year. The measure was based on the 2006 New Zealand Ministry of Education school socio-economic status deciles( 35 ), converted to quintiles (1 = least deprived, 5 = most deprived). School socio-economic status quintiles in years prior to 2006 were estimated using an average of the weighted neighbourhood deprivation measure for each school based on its catchment area. A 2 km Euclidean buffer was created around each school and these were overlaid with 1991 Census Area Unit boundaries (n 106), the earliest year for which digital boundaries were available. Each Census Area Unit was assigned a measure of deprivation, which was then weighted by population. For the years 1996 and 1986, the New Zealand Index of Deprivation (NZDep) was used (note: the 1991 NZDep was used in 1986, as this was the first year the index was available)( Reference Salmond, Crampton and Atkinson 36 ). For the years 1976 and 1966, a Census proxy measure of deprivation was used (quintiles of the proportion of professional employees of all employees, where 1 = high proportion, 5 = low proportion). The use of proportions of professional workers as a proxy for deprivation has been validated previously, with correlations between the proxy and NZDep of 0·50–0·58 over the study period( Reference Pearce and Day 33 ).
Analysis
Using GIS, the median number of food outlets located within an 800 m Euclidean buffer (approximately 10-min walking time) of each school was calculated. The analysis was stratified by food outlet category, school level and school deprivation quintile. The ratio of each category of food outlet to total outlets within 800 m of schools was also calculated.
The spatial clustering of food outlets within 1600 m of each school (school catchments) was determined using a bivariate K-function analysis( Reference Day and Pearce 30 ). The K-function estimates the expected number of random points of food outlet types within a given distance of a school divided by the average number of points by outlet type in the area. This expected K-function distribution was compared with the observed distribution in a ratio. Ratios close to or less than 1·0 indicated that the observed spatial pattern was similar to a random pattern, whereas ratios greater than 1·0 indicate spatial clustering. The geographic area for the cluster analysis was restricted to 1600 m in order to capture catchment areas around each school. In cluster analyses, food outlet categories and high deprived v. low deprived schools were compared. We used the software packages IBM SPSS Statistics version 19 to undertake the descriptive analysis, ArcGIS 10 (ESRI, Redlands, CA, USA) for the GIS analysis, and the Spatstat package in R v2·10·0 for the statistical analysis of spatial point pattern analysis.
Results
The population of Christchurch increased from about 300 000 in 1966 to approximately 362 000 in 2006 (Table 1). Of the schools that were in operation in 1966 (n 116), sixty-five remained in the same deprivation quintile throughout the entire study period, while fifteen were in a more deprived quintile ranking and fifteen were in a less deprived quintile ranking by the end of the study period. All but two schools shifted by a maximum of one quintile over time. The numbers of large and small food retailers in Christchurch changed considerably over the 40-year study period. For example, current large supermarket chains such as ‘New World’, ‘Countdown’, ‘Pak ‘n’ Save’ and ‘Fresh Choice’ which retail an extensive range of food have replaced numerous smaller ‘superettes’ such as ‘IGA’ and ‘Four Square’. These latter chain stores typically sold more limited food options in earlier years. Fast-food outlets in the 1960s comprised mostly of fish retailers/fish and chip shops but in later years expanded to include multinational fast-food chain stores such as Kentucky Fried Chicken, McDonalds and Pizza Hut. Numerous other locally operated takeaway food outlets serving Indian, Chinese and Thai meals also grew rapidly during this period. The number of small convenience stores typically offering a smaller range of convenience and fresh foods has remained largely unchanged throughout the period.
Table 1 Number of schools, food outlets and population, Christchurch, New Zealand, 1966–2006

Source: Statistics New Zealand Subnational Population Estimates.
The median number of food outlets within 800 m of schools decreased from 9 in 1966 to 6 in 2006; grocery stores and supermarkets decreased from 5 to 1; fast-food outlets increased from 1 to 4; and convenience stores decreased from 2 to 1 (Table 2). There was little difference between school primary and secondary levels in terms of food outlet presence, except for an increase in the number of fast-food outlets around secondary schools where the median number increased from 1 to 5. In each year, the median number of fast-food outlets within 800 m of schools increased more rapidly around the more deprived schools compared with the least deprived schools. The median number of fast-food outlets around the most deprived schools increased from 1 in 1966 to 7 in 2006 compared with an increase from 1 to 3 outlets around the least deprived schools. The median number of convenience and fruit and vegetable outlets near the most deprived schools increased slightly and remained consistently higher. Overall the median number of supermarkets/grocery stores decreased markedly over time near schools but the numbers remained similar across the deprivation quintiles. The median ratios of supermarkets/grocery stores to total outlets within 800 m from schools decreased from 0·61 in 1966 to 0·10 in 2006 (Fig. 1). Conversely, for fast-food outlets the ratio increased over the study period (from 0·10 to 0·67) and for convenience and fruit and vegetable stores the values remained fairly constant (0·28 to 0·25).
Table 2 Median number of food outlets within 800 m by school type and deprivation quintile, Christchurch, New Zealand, 1966–2006
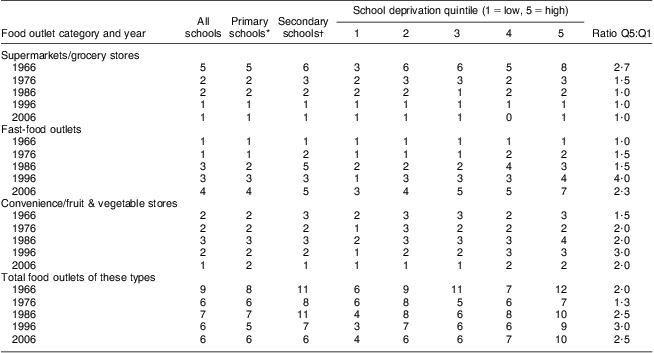
*Includes intermediate schools.
†Includes middle schools.
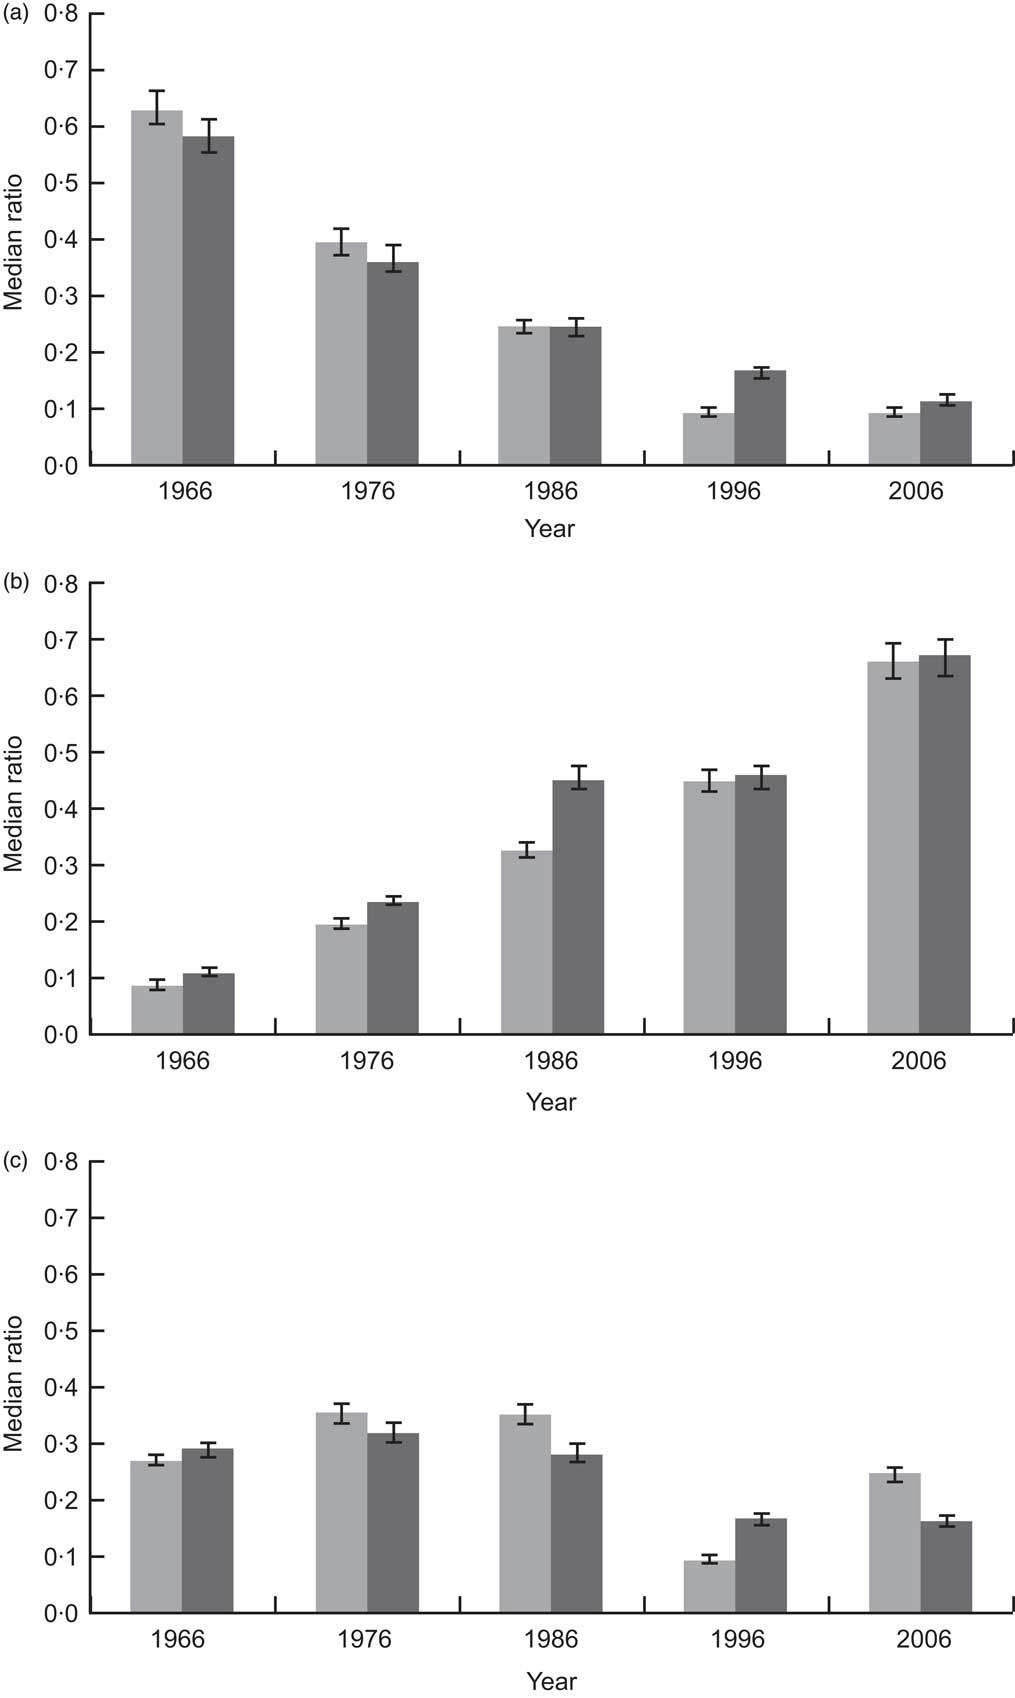
Fig. 1 Ratio of the number of (a) supermarkets/grocery stores, (b) fast-food outlets and (c) convenience/fruit and vegetable stores to total food outlets within 800 m of schools (![]() , primary schools;
, primary schools; ![]() , secondary schools), Christchurch, New Zealand, 1966–2006. Values are medians, with their 95 % confidence intervals represented by vertical bars
, secondary schools), Christchurch, New Zealand, 1966–2006. Values are medians, with their 95 % confidence intervals represented by vertical bars
The spatial clustering of food outlets around schools was evident for all three categories of outlets, in each year of the study period (Table 3). There was little difference in the magnitude of clustering between food outlet categories at the specified distances from schools over the years. However, the ratios were consistently greater at distances of 800 m or less compared with greater distances, indicating that clustering was stronger within walking distances of schools. Ratios at 800 m distance from schools ranged from 2·0 to 2·3 for supermarkets/grocery stores, from 1·9 to 2·3 for fast-food outlets and from 1·8 to 2·4 for convenience stores; while at 1600 m from schools, ranges of ratios were 1·6–1·8, 1·6–1·8 and 1·7–1·9, respectively.
Table 3 Ratios and 95 % confidence intervals of observed to expected K-function outlet densities at distances from schools, Christchurch, New Zealand, 1966–2006
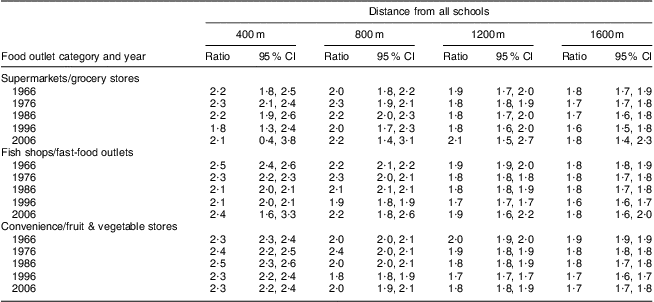
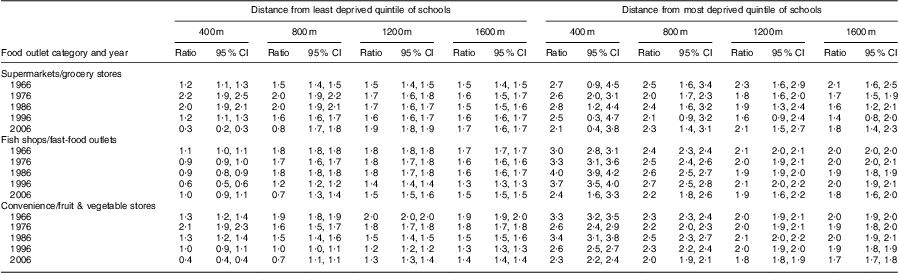
In comparing clustering of outlets by school deprivation level, the most socially deprived schools had consistently higher ratios across all distances compared with the least deprived, which indicates that clustering was stronger around the most deprived schools (Table 4). For all outlet types and each year, the largest ratio differences were found for distances of 800 m or less from schools.
Table 4 Ratios and 95 % confidence intervals of observed to expected K-function outlet densities at distances from the least and most socially deprived schools, Christchurch, New Zealand, 1966–2006
Discussion
The results of the present work suggest that the availability of energy-dense foods, such as those found at fast-food outlets, in close proximity to schools could be an important driver for the increasing prevalence of overweight and obesity in children in the country. This result is not new as the obesogenic nature of food environments around schools has been consistently noted in many international studies( Reference Davis and Carpenter 20 , Reference Kestens and Daniel 25 – Reference Day and Pearce 30 ). The results of the current New Zealand-based study add to this extant literature however by providing an important longitudinal perspective to research of this nature( Reference Law, Power and Graham 37 ). Moreover, we demonstrated that the retail mix of food outlets within close proximity of schools has changed markedly since the 1960s with a large reduction in the availability of supermarkets/grocery stores, a small decrease in convenience stores and a large increase in fast-food outlets near schools. The patterns of spatial clustering were similar between all food outlet categories across all study years but were greatest within walking distance (800 m) of schools. These trends were particularly evident for the most deprived schools, where the degree of spatial clustering was at least twice that of the least deprived schools. There was also a clear social gradient in food outlet type distribution and clustering around schools, with higher densities of fast-food and convenience stores around the most deprived schools, which has previously been identified in a US-based study( Reference Austin, Melly and Sanchez 29 ).
The mechanisms that might explain these findings are myriad but could include explanations pertaining to consumer demand generated from high population densities, land-use zoning measures, co-location of other businesses, land prices and rental costs( Reference Day and Pearce 30 , Reference Pearce, Day and Witten 34 , Reference Pearce, Blakely and Witten 38 ). Historic land-use practices may also have influenced the co-location of schools and food retail outlets more generally.
Population growth within Christchurch and the building of nine new schools over the 40-year study period has paralleled the development of a retail food base around schools. The increase in the number of fast-food outlets around schools may indicate the development of obesogenic environments which have emerged around schools. The extent to which schools have been targeted by the fast-food industry is unknown. However, a large school pupil consumer base is likely to be an important consideration in this regard.
The study has a number of limitations. First, deprivation data about schools prior to 2006 were not available, so proxy measures were used to derive school deprivation for earlier years. Second, we were unable to fully verify historical food outlet and school data as we relied upon telephone directories and, where available, Internet sources. In addition, the categorization of these outlets did not involve a review of all items sold in these outlets. Third, digitized road networks were not available over the study period, so it was not possible to derive buffers or school catchments using road distance or to undertake a road network-based K-function analysis. Since the standard K-function methodology relies upon a planar space assumption of straight-line distance between points, this could lead to the over-detection of clustered patterns in road network-constrained school and food outlet points( Reference Yamada and Thill 39 – Reference Spielman 41 ). Last, our study did not consider whether food environments around schools influence student diet, food purchasing behaviour or related health outcomes. Future studies could investigate the temporal dynamics of food environment risk and the effects on diet and health outcomes over the life course from youth to adulthood. Considering residential movement and potential differences across urban/rural communities and within socio-economic and ethnic sub-populations would also be of value( Reference Boone-Heinonen and Gordon-Larsen 42 ).
Conclusions
The present study adds an important longitudinal component to the burgeoning work on school food environments. We found a number of obesity-promoting features of these environments and the potential for these environments to create or exacerbate inequalities in obesity. Specifically, we observed an evolution in Christchurch from supermarkets/grocery stores to fast-food outlets and strong spatial clustering of these outlets around more socially deprived schools. Childhood exposure to negative food environments has important implications for obesity risk in childhood. Consideration should be given to enhancing food environments including environmental-level interventions that improve the food choices available to children around schools. Following the significant earthquakes, notably the most damaging event on 22 February 2011 which caused many fatalities and extensive infrastructural damage, Christchurch faces unprecedented opportunities for reconsidering the spatial arrangement of the urban built environment, including food environments. Many older unreinforced masonry buildings in commercial centres have had to be demolished. These buildings were popular locations for fast-food and convenience outlets. Draft planning and public consultations for the rebuilding of the central city and suburban commercial centres is currently in process( 43 ) and it is anticipated that this type of policy/zoning intervention could enforce much needed change similar to those in Buffalo, New York, where a proposed ban on tobacco sales within 1000 feet of schools or at facilities frequented by youth (e.g. movie theatres, bowling alleys, etc.) has been supported in principle by the council( Reference Tilson 44 ). It is important to ensure that the reconstructed built environment in Christchurch supports public health concerns including healthy eating for children.
Acknowledgements
Sources of funding: P.L.D. and A.L.P. were funded through the GeoHealth Laboratory (New Zealand Ministry of Health). J.R.P. is supported by the European Research Council (ERC-2010-StG Grant 263501). The New Zealand Ministry of Health and the European Research Council had no role in the design, analysis or writing of this article. Conflicts of interest: There are no conflicts of interest. Ethical approval: No ethical approval was required for this research. Authors’ contributions: P.L.D. and J.R.P. designed the study and drafted the manuscript. P.L.D. compiled and analysed the data. A.L.P. conducted further analyses and revised the manuscript. Acknowledgements: The authors wish to thank Dr Gregory Breetzke for his helpful comments on this paper.


