


Traditionally, the Inuit diet was rich in vitamin D owing to a diet rich in fatty fish and marine mammals. Over the past several decades, Inuit have been experiencing a rapid nutrition transition. Inuit are relying less on traditional foods and increasing their intake of market foods. This phenomenon is more pronounced in younger generations and has led to reduced nutritional quality of their diets( Reference El Hayek, Egeland and Weiler 1 – Reference Berti, Soueida and Kuhnlein 3 ). Even though this transition is concerning for both young men and women, it is more concerning for women as they undergo childbearing years. Optimal nutrition for women during pregnancy and lactation is an important factor that determines maternal and infant health outcomes( Reference Hermoso, Vollhardt and Bergmann 4 – Reference Picciano 7 ). Maintaining a good vitamin D status is accepted as important for bone health( Reference Picciano 7 , Reference Munns, Zacharin and Rodda 8 ) and new evidence suggests a potential role in extraskeletal health( Reference Camargo, Rifas-Shiman and Litonjua 9 – Reference Scragg, Sowers and Bell 11 ). Inuit women of childbearing age are predisposed to low vitamin D status for multiple reasons including moving away from the consumption of traditional foods which are excellent sources of vitamin D( Reference Blanchet, Dewailly and Ayotte 12 , Reference Kuhnlein, Soueida and Receveur 13 ), living at high latitudes( Reference Webb, Kline and Holick 14 ) and darker skin pigmentation( Reference Prentice 6 ). Maternal vitamin D deficiency is a major risk factor for vitamin D deficiency in infancy( Reference Munns, Zacharin and Rodda 8 ). Cases of vitamin D deficiency rickets are still reported in Canada; the Canadian Paediatric Surveillance Program reported 104 confirmed cases of rickets between 2002 and 2004, of which 12 % were of Inuit decent( Reference Ward, Gaboury and Ladhani 15 ).
Even though low vitamin D status and intakes have been previously reported in Inuit( Reference El Hayek, Egeland and Weiler 1 , Reference Brannon and Picciano 5 , Reference Prentice 6 ), only a limited number of studies have evaluated the vitamin D intake and status of lactating and pregnant Inuit women living in Northern Canada( Reference Berti, Soueida and Kuhnlein 3 , Reference Waiters, Godel and Basu 16 ). Accordingly, the objective of the present study was to determine the prevalence healthy vitamin D status and its correlates in lactating Inuit women living in remote regions of the Arctic.
Materials and methods
Participants
The sample consisted of Inuit women (>18 years) who were recruited and lactating in the late summer and early autumn of 2007 (August–September) and 2008 (August–October) as part of the Inuit Adult Health Survey conducted in communities of Inuvialuit Settlement Region (ISR), Nunavut and Nunatsiavut. Latitude of the communities ranged from 54°10′N to 74°43′N. In the 2006 Canadian Census, 1172790 identified themselves as an Aboriginal person; about 4 %, or 50 485, reported that they were Inuit. The majority of Inuit in Canada lived in Nunavut (n 24 635), ISR (n 3115) and Nunatsiavut (n 2160). The Inuit population grew by 26 % between 1996 and 2006, three times faster than Canada’s non-Aboriginal population (8 %), with the greatest increase in Nunavik (25 %) and Nunavut (20 %). The fertility rate for Inuit women was estimated to be 3·4 children compared with 1·5 among all Canadian women( 17 ). Inclusion criteria for participation in the Inuit Adult Health Survey consisted of self-identified Inuk. Adults were randomly selected to participate in the survey. Stratified random sampling was used to select households where communities were strata and where homes were randomized using either computer random generation of numbers or a random digit table. Participants were contacted in the order that they appeared on the randomized list. Three attempts were made to contact each randomly selected household. A more detailed description of the survey methodology is available elsewhere( Reference Saudny, Leggee and Egeland 18 ).
Ethics
The study was conducted according to the guidelines laid down in the Declaration of Helsinki and all procedures involving human subjects were approved by McGill Faculty of Medicine Institutional Review Board, the Nunavut Research Institute and the Aurora Research Institute. Written informed consent was obtained from all subjects. Consent forms and an information DVD were available in English and the appropriate dialects for the three Inuit regions included in the survey.
Research team and interviews
The field research team consisted of trained bilingual Inuit research assistants, nurses, and laboratory and other technicians divided into land teams and a ship-based team which travelled to coastal communities aboard Canadian Coast Guard Ship Amundsen. All questionnaires were interviewer administered. Land teams collected information about living conditions, household composition, supplement and medication use, including those affecting vitamin D status (anticonvulsants, prednisone and cholestyramine). Statistics Canada’s definition of more than one person per room, where rooms included bedrooms, kitchen and living room, was used to define household crowding( 17 ). Ship-based assessments included an assessment of medical history, health behaviours including number of hours spent outside in the summer season, a 24 h dietary recall and an FFQ. A question regarding sun exposure surveyed how much time was spent in the sun between 11.00 and 16.00 hours and participants were provided with six options: none, <30 min, 30 to 59 min, 1–2 h, >2 h and do not know. The 24 h dietary recall was conducted with the participant using a multiple-pass technique. Portion sizes were estimated using a three-dimensional food model kit (Santé Québec, Montreal, Quebec, Canada). Data from the 24 h dietary recall were entered using CANDAT software (Godin London Incorporated, London, Ontario, Canada). Vitamin D and Ca intakes, total energy, percentage of energy from traditional foods and consumption of traditional foods during the previous day were derived from the 24 h dietary recall. The FFQ was designed to capture consumption information about a comprehensive list of common traditional foods (in and off season) and selected market foods in the past year. The FFQ was adapted to reflect the species available in ISR, Nunavut and Nunatsiavut. Each participant was asked how often a particular market food was eaten in the past month. For all food items, the participant was asked to quantify her usual serving using the food models and provided pictures if needed. To quantify the vitamin D contribution (micrograms) of fish, the amount of fish (grams) from the FFQ was multiplied by an average vitamin D content of different fish. The average was calculated from the vitamin D content of fish that were in the FFQ and had an available vitamin D value in the Canadian Nutrient File 2016 (halibut, turbot, trout, salmon, Atlantic cod, arctic char and whitefish)( 19 ).
Clinical assessments
Whole blood was collected into Vacutainer® blood collection tubes with added clot activator and gel for serum separation (Becton Dickinson and Company, Franklin Lakes, NJ, USA), followed by centrifugation and storage of serum at −80°C on the ship for thirty-three coastal and at −20°C for three inland communities. The blood samples were shipped on ice and stored at −80°C until analysis. Height was measured to the nearest 0·1 cm using a portable stadiometer (Road Rod 214 Portable Stadiometer; Seca, Hanover, MD, USA). Weight was recorded to the nearest 0·1 kg and 0·4 kg was subtracted routinely from the weight for each participant to account for clothing. BMI was calculated as [weight (kg)]/[height (m)]2 and categorized based on the WHO definitions( 20 ) as underweight (BMI<18·5 kg/m2), normal weight (BMI=18·5–24·9 kg/m2), overweight (BMI=25·0–29·9 kg/m2) and obese (BMI≥30·0 kg/m2). Body fat was also assessed (Tanita TBF-300GS with goal setter; Tanita Corporation of America, Inc., Arlington Heights, IL, USA). Waist circumference was measured to the nearest 0·1 cm using a cloth retractable tape measure (ERP, Laval, Quebec, Canada).
Laboratory analysis and standardization
In 2008, serum 25-hydroxyvitamin D (25(OH)D) concentrations were measured using the LIAISON total 25(OH)D assay (DiaSorin Inc., Stillwater, MN, USA) at McGill University. The inter-assay and intra-assay CV were respectively 4·5 and 11·1 % for the low 25(OH)D control (38·2 nmol/l) and 6·2 and 5·3 % for the high 25(OH)D control (127·2 nmol/l); the accuracy using the mid-range of manufacturer specifications was 95 %. The laboratory that measured 25(OH)D participated in the DEQAS (Vitamin D External Quality Assessment Scheme) programme and obtained a Certificate of Proficiency for 2009–2010 which reflects that 80 % or more of the reported results fell within 30 % of the ALTM (all-laboratory trimmed mean). Since that time, standardization approaches have evolved. In 2010, the US National Institute of Standards and Technology (NIST) provided a reference measurement procedure against which assays could be standardized( Reference Cashman, Kiely and Kinsella 21 ). Accordingly, in September 2017, serum samples corresponding to the original plasma samples were re-analyzed at McGill University in duplicate using the LIAISON total 25(OH)D assay and an average was calculated. The Spearman correlation between the 2008 and 2017 measurements was 0·86 (P<0·01; data not shown). The CV for the measurement of the NIST control was 3·7 %. A weighted Deming regression analysis was then conducted using Prism 5 (GraphPad Software, Inc., La Jolla, CA, USA) to standardize the serum 25(OH)D values as described previously for the Canadian Health Measures Survey( Reference Sarafin, Durazo-Arvizu and Tian 22 ). The regression equation generated by the weighted Deming regression model was: NIST interpolated value=0·99x −0·95.
Serum 25(OH)D concentration reflects both exogenous and endogenous vitamin D intake( Reference Holick 23 ). Vitamin D deficiency was defined as 25(OH)D<30 nmol/l. This concentration correlates with increased bone loss as a consequence of hyperparathyroidism( Reference Ross, Manson and Abrams 24 ). Values of 25(OH)D of 40 nmol/l correspond to the Estimated Average Requirement. Values of 25(OH)D at or above 50 nmol/l are considered sufficient and consistent with the Institute of Medicine’s recommendations for bone health( Reference Ross, Manson and Abrams 24 ). Further, serum 25(OH)D in excess of 75 nmol/l is advised for multiple health outcomes by professional societies( Reference Bischoff-Ferrari, Giovannucci and Willett 25 ). Accordingly, in the present paper, serum 25(OH)D concentrations were compared with <30 nmol/l (deficiency), <40 nmol/l (inadequacy), 50–74·9 nmol/l (sufficiency) and ≥75 nmol/l (optimal).
Statistical analysis
Questionnaires and clinical information were entered into a Microsoft® Access 2010 database. Values are presented as percentages and 95 % CI, or means and sd, or medians with interquartile range (IQR). A logistic regression model was used where 25(OH)D at or above 40 nmol/l was the dependent variable, while vitamin D intake, energy intake, percentage body fat and hours spent in the sun were used as independent variables. Descriptive statistics of original, re-analysed and NIST-certified interpolated 25(OH)D values are presented in the online supplementary material, Supplemental Table 1. All statistical analyses were completed using the statistical software package Stata version 10.
Results
The sample consisted of thirty-four lactating Inuit women with a median age of 26·5 (IQR 23·0–29·7) years. Among participants, 47·1 % were of a healthy weight, 35·3 % were overweight and 17·6 % were obese based on BMI. Three (8·8 %) women were taking supplements, including two women taking Fe supplements and one woman taking a multivitamin; however, supplements of vitamin D and Ca alone were not consumed. The median daily sun exposure was 4 h. More than three-quarters (76·5 %) of participants were living in uncrowded household (Table 1).
Table 1 Selected lifestyle, sociodemographic, anthropometric and biochemical characteristics of lactating Inuit women: International Polar Year Inuit Health Survey, 2007–2008
IQR, interquartile range; 25(OH)D, 25-hydroxyvitamin D.
* More than one person per room, where rooms included bedrooms, kitchen and living room, was used for household crowding(18).
The median concentration of 25(OH)D among Inuit lactating women was 39·1 (IQR 25·5–50·0) nmol/l. The proportion having 25(OH)D≥75 nmol/l was 8·8 (95 % CI 1·2, 18·9) %. When using a cut-off of 25(OH)D≥50 nmol/l, the prevalence was 26·5 (95 % CI 10·8, 42·1) %. When using a cut-off of 25(OH)D<40 nmol/l, the prevalence was 50·0 (95 % CI 32·3, 67·7) % (Fig. 1).
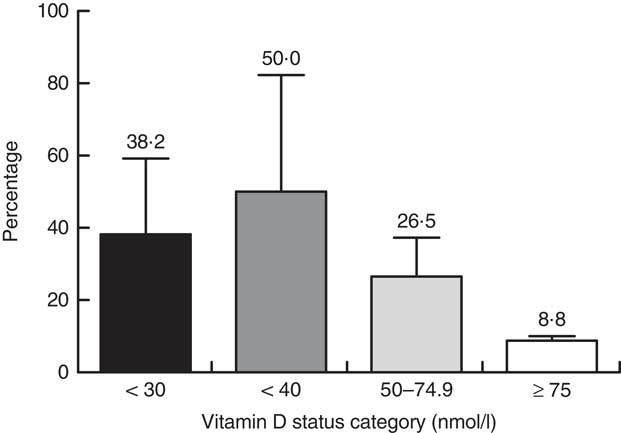
Fig. 1 Vitamin D status of lactating Inuit women*: International Polar Year Inuit Health Survey, 2007–2008. *Values are means with their standard deviation represented by vertical bars; percentages do not add up to 100 % as categories overlap
Using mean intake of energy and energy derived from traditional foods (24 h dietary recall data), only 11·3 % of total energy was derived from traditional foods. More than one-third of lactating women (35·2 %) did not consume traditional foods during the previous day. Using data from the FFQ, only one participant did not consume traditional foods over the past year, while 29·4 % did not consume any fish. Using data from the 24 h dietary recall, the mean intakes of vitamin D and Ca were 4·8 (sd 5·2) µg and 553 (sd 348) mg, respectively, which fell below the Estimated Average Requirement of 10 µg for vitamin D and 500 mg for Ca (Table 2). About 41·9 % of total dietary vitamin D was derived from traditional foods and 14·9 % was derived from milk and milk alternatives, whereas the remaining vitamin D intake was derived from eggs, margarine, grains, mixed meals and miscellaneous sources. Only 1·6 % of total Ca intake was derived from traditional foods and 20·3 % was derived from milk and milk alternatives, whereas the remaining Ca intake was derived from eggs, vegetables, grains, mixed meals and miscellaneous sources. Using the 24 h dietary recall data, 73·5 % of the women did not consume any fluid milk and 38·2 % did not consume milk and milk alternatives during the previous day. Only 14·7 % of the sample consumed the daily number of milk servings recommended by Canada’s Food Guide (two servings) for First Nations, Inuit and Métis.
Table 2 Selected dietary characteristics of lactating Inuit women: International Polar Year Inuit Health Survey, 2007–2008
IQR, interquartile range.
* Data derived from the 24 h dietary recall.
† Data derived from the FFQ.
‡ Milk and milk alternatives included milk, fortified soya beverage, canned (evaporated) milk, powdered milk, cheese and yoghurt.
§ To quantify the vitamin D contribution (micrograms) of fish, the amount of fish (grams), from the FFQ, was multiplied by an average vitamin D content of different fish that had an available vitamin D value in the Canadian Nutrient File 2016 (halibut, turbot, trout, salmon, Atlantic cod, arctic char and whitefish)( 19 ).
Using logistic regression to examine 25(OH)D>40 nmol/l, each increase of 1 % of body fat decreased the odds of having 25(OH)D>40 nmol by 11 %, while vitamin D intake, energy intake, sun exposure and region were not associated with 25(OH)D>40 nmol/l (Table 3).
Table 3 Predictors of serum 25-hydroxyvitamin D (25(OH)D)> 40 nmol/l in lactating Inuit women: International Polar Year Inuit Health Survey, 2007–2008
* Data derived from the 24 h dietary recall
Discussion
In the present sample of lactating Inuit women studied in summer and autumn, when UVB exposure and 25(OH)D concentration should be at their highest, 50·0, 26·5 and 8·8 % had 25(OH)D concentration <40 nmol/l (risk of inadequacy), ≥50 nmol/l (sufficiency) and ≥75 nmol/l (optimal), respectively. A higher percentage of lactating Inuit women had 25(OH)D<40 nmol/l than 19–30- and 31–50-year-old Canadian women of childbearing age (18·1–21·3 %) in the Canadian Health Measures Survey in cycle 1 and 2( Reference Sarafin, Durazo-Arvizu and Tian 22 ). A value of 40 nmol/l corresponds to the Estimated Average Requirement of 10 µg/d (400 IU/d), which is set to meet the needs of half of the population. However, half of the women sampled failed to meet this population target for vitamin D status. Lower vitamin D status has been previously reported in Inuit adults compared with the general Canadian population, due to living at high latitudes( Reference Webb, Kline and Holick 14 ) and darker skin pigmentation( Reference Prentice 6 ). The vitamin D status of the lactating Inuit women was similar to that of non-lactating Inuit women in the same survey who were aged 18–30 years, with 25·5 and 11·3 % having 25(OH)D concentration of ≥50 and ≥75 nmol/l, respectively. However, the vitamin D status of the lactating Inuit women was lower than that of women aged 31–50 years, of whom 54·8 and 24·2 % had 25(OH)D concentration ≥50 and ≥75 nmol/l, respectively( Reference El Hayek, Egeland and Weiler 1 ).
The median concentration of 25(OH)D among lactating Inuit women was 39·1 (IQR 25·5– 50·0) nmol/l. Multiple studies have reported that 25(OH)D concentrations in infants are about 60–70 % of maternal values( Reference Waiters, Godel and Basu 16 , Reference Vieth Streym, Kristine Moller and Rejnmark 26 ). Even though the age of the infant was not recorded, if we assume that these infants were less than 6 months old and exclusively breast-fed, accordingly they would likely have serum 25(OH)D concentrations of 22–25 nmol/l. Such concentration is classified as vitamin D deficiency according the Canadian Paediatric Society( 27 ) and poses a high risk of vitamin D deficiency rickets as the infant continues to grow through infancy and into childhood. Further research is needed to identify vitamin D supplementation practices for Inuit mothers of infants and young children.
Vitamin D concentration in the current study was higher than that reported among Cree mothers in Manitoba (19·8 (sd 7·7) nmol/l)( Reference Lebrun, Moffatt and Mundy 28 ). In our study, data were collected at the end of the vitamin D-synthesizing period (summer and autumn), while in the study by Lebrun et al. (1993) data were collected early on in the vitamin D-synthesizing period (June–July)( Reference Lebrun, Moffatt and Mundy 28 ). On the other hand, Waiters et al. (1999) reported higher concentrations of 25(OH)D (48·8 (sd 14·2) nmol/l) among Inuit mothers living in the Northwest Territories at delivery( Reference Waiters, Godel and Basu 16 ). It is important to note that even though the dietary vitamin D intake of Inuit mothers in the study of Waiters et al. was slightly lower (3·2 (sd 2·5) µg/d) than in our study (4·8 (sd 5·2) µg/d), the overall vitamin D intake increased to 8·2 (sd 5·0) µg/d when vitamin D supplement intake was counted. It is important to point out that none of the women enrolled in our study were taking vitamin D supplements (one woman was taking a multivitamin), which likely contributed to lower 25(OH)D concentrations than those of Waiters et al.
Even while not assessing supplement intake, Berti et al. (2008) reported higher dietary vitamin D intake than our current study among lactating Inuit women (mean of 9·4–20·4 µg/d depending on the Inuit region)( Reference Berti, Soueida and Kuhnlein 3 ). The data collection of Berti et al. happened between 1987 and 1999, whereas our data were collected almost 10 years later when probably the nutrition transition became more pronounced. This assumption is very likely correct, because the percentage of energy derived from traditional foods among lactating Inuit women in the study of Berti et al. was about 15–25 % depending on the Inuit region, while in our study only 11·3 % of energy was derived from traditional foods. Table 4 highlights the literature that has examined the vitamin D status, concentration and intake of lactating and non-lactating mothers in the North.
Table 4 Vitamin D status, concentration and intake of lactating and non-lactating mothers in the North
CPBA, competitive protein-binding assay; NA, not assessed; NR, not reported.
In our study, more than one-third of lactating women did not consume traditional foods during the previous day and about one-third of participants did not consume fish over the past year. Fatty fish is an excellent source of vitamin D; for instance, 100 g of raw arctic char, including meat and skin, contains 13·3 μg of vitamin D, while a similar amount of dried arctic char, including meat and skin, contains 44·8 μg( 19 ). If lactating women consume a small amount of fish, vitamin D intake and later on vitamin D status will improve as previously reported among Inuit adults( Reference El Hayek, Egeland and Weiler 1 ). Furthermore, fish is an excellent source of many nutrients including n-3 fatty acids, Zn, iodine, Se and protein( 19 ), which are all important for the growth and development of infants( Reference Oken, Osterdal and Gillman 29 ).
In addition to dietary vitamin D, sun exposure affects vitamin D status( Reference Scragg, Stewart and McKenzie 30 , Reference Vercruyssen, Jacquemyn and Ajaji 31 ). Even though lactating Inuit women reported spending about 4 h in the sun on daily basis, this was not evident in their vitamin D status. It might be likely that the questions about sun exposure did not capture their practices properly since this questionnaire was not previously validated in the Inuit population.
Dietary Ca intake in our sample (median 478 (IQR 269–767) mg) was similar to that reported by Berti et al. in 2008, ranging between 438 and 487 mg depending on the Inuit region( Reference Berti, Soueida and Kuhnlein 3 ). This low intake of Ca in both studies could be due to low consumption of milk and its alternatives as reported by our study. Milk intakes were too low to be a major contributor to Ca and vitamin D intakes. Only 14·7 % of the sample consumed the daily number of milk servings recommended by Canada’s Food Guide (two servings) for First Nations, Inuit and Métis. Even though Inuit are experiencing the nutrition transition, milk consumption is not popular in the adult population. However, better Ca and milk intakes have been previously reported in Inuit pre-schoolers( Reference El Hayek, Egeland and Weiler 32 ) suggesting improved acceptance of milk in the young generations of Inuit.
The only predictor of 25(OH)D>40 nmol/l among Inuit lactating women in the present study was percentage body fat. The association between 25(OH)D and other indicators of obesity such as waist circumference and BMI has been previously reported in Inuit adults( Reference El Hayek, Egeland and Weiler 1 ) and other ethnic and age groups( Reference Vitezova, Muka and Zillikens 33 – Reference Millen, Wactawski-Wende and Pettinger 36 ). Although this relationship is not fully elucidated, it is assumed that because vitamin D is a fat-soluble vitamin it might be sequestered in the excess adipose tissue of obese adults and would be slowly released at negative energy balance( Reference Brouwer, van Beek and Ferwerda 37 ).
To our knowledge, the current study is the first to assess simultaneously 25(OH)D concentration of lactating Inuit women living in ISR, Nunavut and Nunatsiavut communities in combination with vitamin D intake, age, BMI and other known factors that affect 25(OH)D. However, the study is not without its limitations. The cross-sectional nature limits causal inferences and the findings are restricted to lactating Inuit women. Further, the small sample size may reflect selection bias into the study, which would limit the generalizability of the data. Even though data from the FFQ included amounts of foods consumed, vitamin D content of most traditional foods is missing in food databases and the Canadian Nutrient File. Finally, data about the length of breast-feeding and the age of the infant were not collected from participants.
Conclusion
In conclusion, healthy maternal vitamin D status was observed in 16 % of participants during the late summer and early autumn. This requires further assessment in a larger sample spanning more seasons.
Acknowledgements
Acknowledgements: The authors thank the National Inuit Health Survey Working Group for their review of the article. Financial support: This study was supported by the Canadian Federal Program for International Polar Year, Canadian Institutes for Health Research, ArcticNet, Government of Nunavut, Indian and Northern Affairs Canada, and Health Canada. The funding agencies had no role in the design, analysis or writing of this article. Conflict of interest: None. Authorship: J.E.H.F. wrote the manuscript and H.A.W. critically reviewed the manuscript; J.E.H.F. had primary responsibility for final content. both authors read and approved the final manuscript. Ethics of human subject participation: This study was conducted according to the guidelines laid down in the Declaration of Helsinki and all procedures involving human subjects were approved by McGill Faculty of Medicine Institutional Review Board, the Nunavut Research Institute and the Aurora Research Institute. Written informed consent was obtained from all subjects.
Supplementary material
To view supplementary material for this article, please visit https://doi.org/10.1017/S1368980017004189


