


INTRODUCTION
Continuous, high-resolution records of paleoclimate are rare for the arid Great Basin province of the United States. Such records provide valuable historical context for a region with high population growth and challenges to provide sufficient water to this growing population. An important finding from natural archives of Holocene paleoclimate in the Southwest is that droughts of far greater duration and magnitude than those experienced and documented for the past century—so-called megadroughts—are not unusual (e.g., Stine, Reference Stine1994; Mensing et al., Reference Mensing, Sharpe, Tunno, Sada, Thomas, Starratt and Smith2013; Cook et al., Reference Cook, Smerdon, Seager and Cook2014).
Archives of Holocene paleoclimate for the Great Basin include cave deposits, tree rings, and pollen and geochemical indicators from lake sediments. Records from locations across the Great Basin (Fig. 1A) indicate a notably drier and warmer middle Holocene (starting between ~7000 and 8000 cal yr BP and ending between 4000 and 5500 yr BP), followed by a relatively wetter and cooler late Holocene (Benson et al., Reference Benson, Kashgarian, Rye, Lund, Paillet, Smoot, Kester, Mensing, Meko and Lindström2002; Wigand and Rhode, Reference Wigand, Rhode, Hershler, Madsen and Currey2002; Grayson, Reference Grayson2011; Lachniet et al. Reference Lachniet, Denniston, Asmerom and Polyak2014; Salzer et al., Reference Salzer, Bunn, Graham and Hughes2014). In the southern Great Basin, Quade et al. (Reference Quade, Forester, Pratt and Carter1998) note the complete absence of organic-rich deposits known as black mats in sedimentary outcrops across several sites in the Las Vegas Valley between 6300 and 2300 14C yr BP as evidence of general aridity, with the occurrence of black mats dated to 2300 14C yr BP and younger signaling the onset of generally wetter conditions. A high-resolution speleothem record from Leviathan Cave indicates drier and warmer conditions from 9000 to 5000 cal yr BP and relatively wetter and cooler conditions after this (Lachniet et al., Reference Lachniet, Denniston, Asmerom and Polyak2014). In the western Great Basin, generally arid conditions are indicated in a pollen record from Pyramid Lake from 7600 to 5000 cal yr BP, followed by wetter conditions after 5000 cal yr BP (Mensing et al., Reference Mensing, Benson, Kashgarian and Lund2004). A chironomid-based temperature record from Stella Lake in the central Great Basin shows generally warmer conditions from 6800 to 4200 yr BP and cooler conditions between 4200 and 1000 yr BP (Reinemann et al., Reference Reinemann, Porinchu, Bloom, Mark and Box2009). A high-resolution, 4600-yr-long tree ring index from northern and central Great Basin sites indicates a long-term decline of approximately −1.1°C since the mid Holocene (Salzer et al., Reference Salzer, Bunn, Graham and Hughes2014). Although viewed as being generally wetter, there is clear evidence of significant drought during the late Holocene. The multicentury-long Medieval Climate Anomaly (MCA; ~1200–700 cal yr BP) was a dry period for much of the Great Basin (Stine, Reference Stine1994), and more recently, evidence of a millennium-long “late Holocene dry period” (LHDP) from ~2800 to 1850 cal yr BP has been found at sites across the central Great Basin as well (Mensing et al., Reference Mensing, Sharpe, Tunno, Sada, Thomas, Starratt and Smith2013).
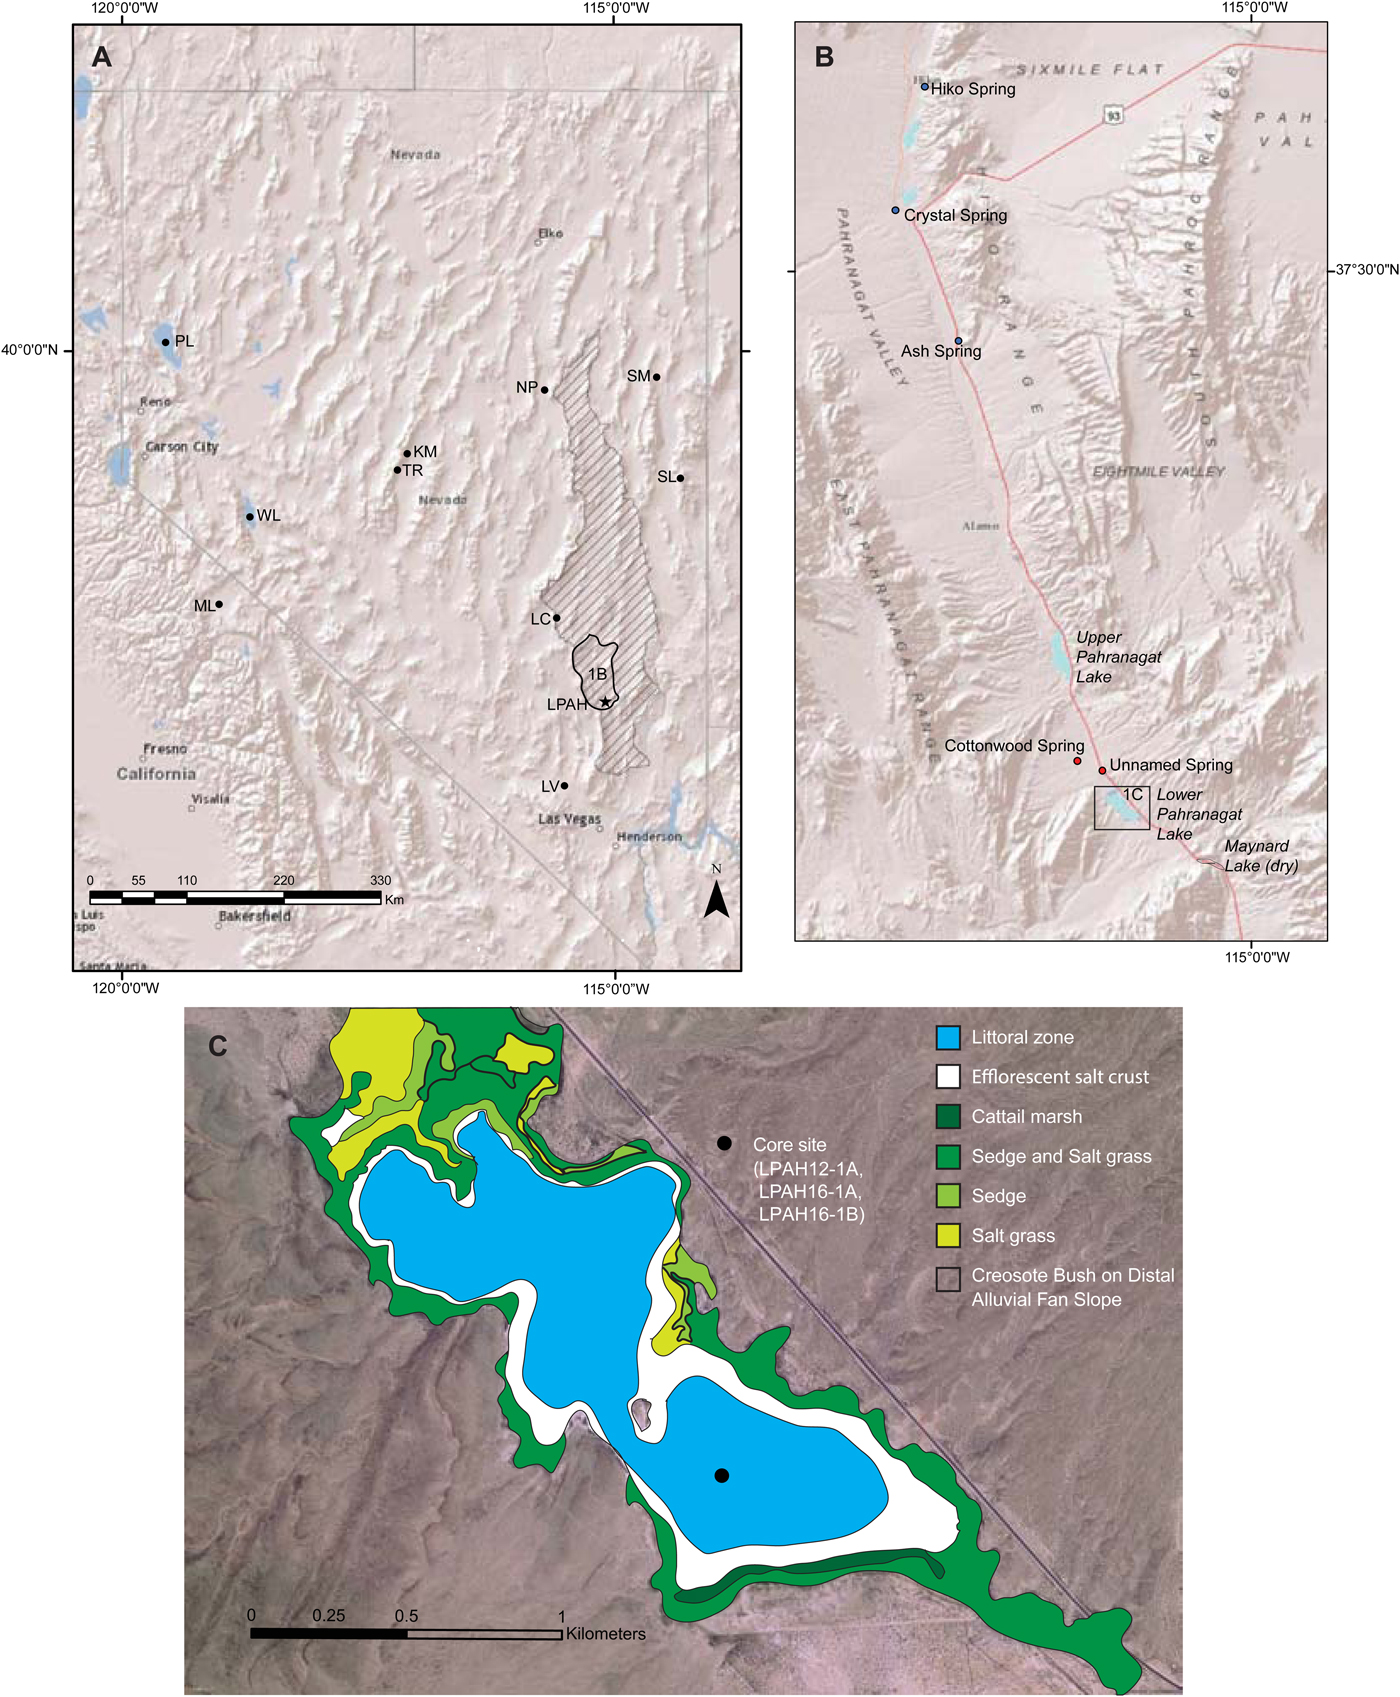
Figure 1. (A) Map of Nevada and neighboring states with sites discussed in this article indicated. Lower Pahranagat Lake (LPAH) indicated with star. KM, Kingston Meadow; LC, Leviathan Cave; LV, Las Vegas Valley; ML, Mono Lake; NP, Newark Valley Pond; PL, Pyramid Lake; SL, Stella Lake; SM, Stonehouse Meadow; TR, Toiyabe Range; WL, Walker Lake. Boundaries of the Pahranagat National Wildlife Refuge are indicated with thick black line. Area highlighted with diagonal lines is the regional carbonate aquifer as mapped by Eakin (Reference Eakin1966). (B) Map of the Pahranagat Valley. Regional carbonate aquifer springs are indicated with blue dots. Local volcanic aquifer springs are indicated with red dots. (C) Map of LPAH, showing modern vegetation and coring site (modified from Hickson et al., Reference Hickson, Theissen, Lamb and Frahm2018). (For interpretation of the references to color in this figure legend, the reader is referred to the web version of this article.)
In this article, we reconstruct a sediment core–based paleohydroclimate record continuously spanning the past 5800 cal yr BP from Lower Pahranagat Lake (LPAH) in southern Nevada. Our multiproxy record builds on and extends a 3800 yr pollen-based record from LPAH showing evidence for century-scale hydroclimate variability (Wigand, Reference Wigand1996; Wigand and Rhode, Reference Wigand, Rhode, Hershler, Madsen and Currey2002). Fifteen AMS radiocarbon age dates provide age control for our 12.4 m composite core record. LPAH is hydrologically closed and lies in a region with a very high ratio of evaporation to precipitation, making it sensitive to changes in water balance. We apply stable isotope analyses (δ18O and δ13C) from fine-fraction (<63 µm) authigenic carbonates that record changes in isotopically sensitive lake waters through time. We also present down-core total organic carbon (TOC), C/N, and total inorganic carbon (TIC) results that refine interpretations of hydroclimate as well as sources of organic matter and productivity. Our analysis allows us to compare our record with others from the Great Basin on century to millennial timescales.
Site hydrology and climatology
LPAH is a small (1.2 km2), shallow (average depth, <1 m; maximum depth, 1.5 m), alkaline lake in the Pahranagat National Wildlife Refuge (PNWR), a 17.7-km-long, 21.8 km2 area of marshes, impoundments, and shallow lakes that lies at the southern end of the Pahranagat Valley in southern Nevada (Fig. 1B and C). Hickson et al. (Reference Hickson, Theissen, Lamb and Frahm2018) provide a detailed description of the LPAH site, including modern ecology, water chemistry, and geologic setting.
LPAH is spring-fed, receiving the majority of its water budget from a deep carbonate aquifer (Fig. 1A) and a smaller amount from more local and shallower aquifers in volcanic strata (Eakin, Reference Eakin1966). Water is discharged at a number of springs north of the lake, that then flow south through a series of connected marshes and small lakes through the Pahranagat Valley (Fig. 1B). Paleozoic carbonate strata comprise the deep regional aquifer and extend north to Great Basin National Park, east into Utah, and south to Death Valley and Lake Mead (Eakin, Reference Eakin1963, Reference Eakin1966). U.S. Geological Survey stream gauges for the two highest discharge springs, Crystal and Ash, discharged at 340 L/s and 510 L/s between 2004 and 2009 with discharge at a relatively constant rate throughout the year (Paces and Wurster, Reference Paces and Wurster2014). Tectonics also plays a role in Pahranagat Valley hydrology, with faults in the valley serving as conduits for groundwater flow. Movement along these faults, which include a series of east–northeast trending strike-slip faults within the PNWR, would likely have some influence on groundwater flow in the valley, but there is relatively little known about Holocene activity on these faults. Through most of the Holocene, water would have flowed south and pooled at LPAH and in Paleolake Maynard, a now drained and dry lake bed at the south end of the Pahranagat Valley (Fig. 1B). Pahranagat Valley spring water is managed to support irrigation of pasture land and for domestic purposes. In the early 1930s, a dam was constructed at the south end of existing marshland to form an impoundment 7.1 km northwest of LPAH (Upper Pahranagat Lake). Since 1963, LPAH water volume has been managed by the U.S. Fish and Wildlife Service as part of a broader management plan for the hydrology in the PNWR. Water released from the Upper Pahranagat Lake has been the largest control on LPAH water volume since this time. Paces and Wurster (Reference Paces and Wurster2014) used Sr and U isotopes as tracers and determined that surface water in the PNWR is composed of waters from the two regional carbonate aquifer springs and groundwater from the local volcanic aquifer source in a 65:25:10 mixture. Stable isotopic values for O in Pahranagat Valley surface waters are highly sensitive to hydroclimatic conditions and show a strong seasonal trend of evaporative enrichment from the wetter and less evaporative winter months to the drier and more evaporative summer months (Paces and Wurster, Reference Paces and Wurster2014; Fig. 2).

Figure 2. Plot of O and H water isotopic values and trend of evaporative enrichment from northern to southern sites. Dates (months) are labeled to illustrate seasonal isotopic enrichment from wetter winter/spring (December–April) to drier summer (June–August) conditions. O and H isotopic values for southern Nevada precipitation are indicated with the labeled blue line. With the exception of Lower Pahranagat Lake (LPAH) surface waters, all surface water and groundwater data are from Paces and Wurster (Reference Paces and Wurster2014). PNWR, Pahranagat National Wildlife Refuge. VSMOW, Vienna standard mean ocean water. (For interpretation of the references to color in this figure legend, the reader is referred to the web version of this article.)
The climate of the Pahranagat Valley features low annual precipitation (157.7 mm/yr average at the PNWR) and high evaporation, with cold winters and hot summers. Data from the PNWR weather station (National Oceanic and Atmospheric Administration/National Weather Service Cooperative Observer Network station #265880) for the period 1964–2015 show average maximum/minimum monthly temperatures of 11.5/−3.0°C in December and 36.9/18.1°C in July (Western Regional Climate Center website [https://wrcc.dri.edu/cgi-bin/cliMAIN.pl?nv5880, accessed October 15, 2017]). Relative to the spring water from the regional carbonate aquifer, precipitation is a trivial source of moisture to the marshes and lakes of the Pahranagat Valley (Wurster, Reference Wurster2010; Paces and Wurster, Reference Paces and Wurster2014). As such, we interpret changes in the water balance at LPAH to be related to the evaporation/discharge (E/Q) ratio. The source of most precipitation is large winter storm systems from the Pacific Ocean. A somewhat smaller amount of precipitation comes from summer convective storms associated with a monsoon-like weather pattern from the Gulf of California (Tyler et al., Reference Tyler, Chapman, Conrad, Hammermeister, Blout, Miller, Sully and Ginanni1996). The Pahranagat Valley is in a region with some of the highest evaporation rates in the United States. Wurster (Reference Wurster2010) calculated that open water evaporation approaches 1676 mm/yr, greater than 10 times the average annual precipitation.
METHODS
Core collection and correlation
We used a square-rod piston corer (Livingstone) aboard a floating coring platform with a winch and pulley system to collect successive 1-m-long drives resulting in a 12.4-m-long overlapping core sequence (cores LPAH12-1B, LPAH16-1A, and LPAH16-1B) from southern LPAH in January 2012 and March and November 2016 (Fig. 1C). All cores were collected in the same location (37°13.001′N, 115°4.882′W). Cores were extruded into split tubing in the field and transported to the National Lacustrine Core Facility (LacCore) at the University of Minnesota where they were stored at 4°C. Cores were split, digitally imaged, and scanned at high resolution for magnetic susceptibility and color properties following standard laboratory protocols. We used the Corelyzer software (v. 2.0.4.rc5; available at https://csdco.umn.edu/resources/software/corelyzer) to examine the high-resolution core images, correlate the cores based on shared stratigraphic markers, and construct a composite depth profile.
Elemental and stable isotopic analysis
We subsampled LPAH cores at 5 cm intervals and split each subsample into two separate portions for C and N elemental analysis. Samples were ground with a mortar and pestle for homogenization and weighed with a microbalance. One portion of each subsample was placed into a tin capsule for analysis to determine total C (TC). A second portion was placed into silver capsules and then acidified with 6% sulfurous acid to remove carbonate to determine TOC following Verardo et al. (Reference Verardo, Froelich and McIntyre1990). Because LPAH sediments are consistently carbonate-rich (often >50% by wt.), we followed the recommendations of Phillips et al. (Reference Phillips, Johnson, Miranda and Disenhof2011) and added a minimum of 1280 μL of acid prior to analysis to ensure that all inorganic C was removed. Untreated and acidified samples were then analyzed using a Thermo Electron Flash EA 1112 elemental analyzer in the Geology laboratory at the University of St. Thomas. TIC was calculated for each sample by taking the difference between untreated (TC) and acidified (TOC) results. We replicated 5% of our samples with average standard deviations of 0.088% and 0.038% for TOC and TIC, respectively. We also collected five samples at 10 cm intervals from an organic-rich layer near the base of the LPAH core (12.28 to 11.78 m depth) and determined percent organic matter by loss-on-ignition following standard procedures (Heiri et al., Reference Heiri, Lotter and Lemcke2001).
We subsampled LPAH12-1B at 5 cm intervals and LPAH16-1A at 10 cm intervals for O and C stable isotopic analysis of fine-fraction (<63 µm) authigenic carbonate. Sample preparation and analysis are described in Hickson et al. (Reference Hickson, Theissen, Lamb and Frahm2018). Analysis was primarily completed in the Stable Isotope Laboratory at the University of Minnesota where replicate analysis of 37% of 128 samples showed average standard deviations of 0.029‰ for δ13C and 0.147‰ for δ18O. A smaller number of samples (n = 27) were analyzed in the Las Vegas Isotope Science Laboratory at the University of Nevada, Las Vegas. Comparison of results for seven samples run at both laboratories showed average standard deviations of 0.124‰ δ13C and 0.264‰ for δ18O.
Mineralogy
We characterized the mineralogy of the LPAH sediments in detail (10 cm spacing), using a finely ground portion of each <63 µm fraction for analysis with a PANalytical X'Pert Pro MPD X-ray Diffractometer (XRD) in the Keck Laboratory at Macalester College. We also examined mineralogy in a semiquantitative fashion using smear slides at the same spacing throughout the core.
Chronology
In order to develop a full chronology for the LPAH record, we sampled the core record at 15 intervals for age dating by 14C analysis. Where sufficient plant remains were available, this was used for age dating. For most samples, this included a mixture of aquatic, emergent, and terrestrial plant materials. For eight of our age-dated samples, it was necessary to use bulk organic matter. Subsamples were placed into baked glass containers and sent to Beta Analytic Laboratories for dating by accelerator mass spectrometry. All carbonates were removed from samples through acid washes. To develop our age model, we used Bacon v. 2.2, Bayesian age-depth modeling software (Blaauw and Christeny, Reference Blaauw and Christeny2011), which uses the IntCal13 database (Reimer et al., Reference Reimer, Bard, Bayliss, Beck, Blackwell, Ramsey and Buck2013) for age calibration.
RESULTS
Chronology
All radiocarbon age dates, associated errors, and corrections are shown in Table 1. Old carbon is often found in freshwater springs emerging from ancient carbonate rocks such as the regional spring sources to LPAH. Subaqueous plants incorporate this old carbon from the available pool of dissolved inorganic carbon (DIC), resulting in erroneously old dates. To test for the presence of this reservoir effect, we dated both bulk and plant fractions from a surface sample (0–3 cm depth). These produced significantly different dates with charred plant remains giving a postmodern age (−390 pMC), whereas bulk organic material at the same depth showed a 590 ± 30 14C yr BP age. Based on these results, we assume that the sediment surface is modern and use the year of collection of LPAH12-1B (2012, = −62 cal yr BP) as an upper age in our chronology. We assume that the regional spring-water source has remained in constant proportion through time and subtracted 590 yr from 10 of the 15 dates used in our age model to account for the influence of the reservoir effect, producing adjusted radiocarbon ages (Table 1). The exceptions were the postmodern surface sample discussed previously and samples with measured δ13C values of the organic material that indicate they are largely composed of terrestrial/emergent plants and are less likely to be affected by the reservoir effect (Table 1). We applied the Bacon software package to adjusted, uncalibrated dates, giving an age-depth model based on the resulting calibrated ages that spans approximately the past 5800 cal yr (Fig. 3). Age dates progress in a fairly steady, linear fashion with sedimentation rates ranging from 0.07 to 0.37 cm/yr. One age date (Beta 458303 at 1046 cm depth) is older than the two dates stratigraphically below it and is largely ignored in the age-depth model. Overall, we are confident that our age model is useful for discussion of paleohydroclimate at a century-scale resolution.
Table 1. Details of the radiocarbon-dated samples used in this study.


Figure 3. Age model for Lower Pahranagat Lake composite core record based on Bayesian modeling of data from Table 1. Red dotted line indicates the best fit. Blue bars represent calibrated radiocarbon ages with 2-sigma error. The darkened area indicates the 95% confidence interval. The default Bacon model parameters were used in all cases except for one of the accumulation rate parameters (“acc. mean”), which was changed to 5, and the section thickness parameter, which was changed to “res = 20.” The average sedimentation rate between radiocarbon ages is indicated, except for intervals with overlapping dates. (For interpretation of the references to color in this figure legend, the reader is referred to the web version of this article.)
Sedimentology and mineralogy
Hickson et al. (Reference Hickson, Theissen, Lamb and Frahm2018) described several sedimentary facies for LPAH12-1 cores representing the last ~2000 cal yr. LPAH sediments are primarily carbonate muds and silts with some intervals showing wavy laminations and other fabrics that are interpreted as microbial in origin. Peloidal textures dominate the carbonate sediments, with some millimeter-scale irregular and wavy laminae at irregular intervals that we interpret as thin microbial mat material based on modern analogs that have been identified in the lake (see figs. 6 and 7 in Hickson et al., Reference Hickson, Theissen, Lamb and Frahm2018). These microbial features imply deposition in a very shallow, yet calm setting. Evidence of wave activity is almost completely lacking, probably because of the small fetch of LPAH and concomitantly low wave activity, coupled with the cohesion imparted by benthic aquatic plants and microbial exocellular polymeric substance. Our down-core XRD analyses of the <63 µm fraction indicate that the carbonates are a mixture of high- and low-Mg calcite and dolomite with high-Mg calcite as the dominant carbonate mineralogy through much of the core. Magnetic susceptibility (MS) shows low values throughout the majority of the core, consistent with carbonate-rich sediments. Several small deviations in MS occur along with two notable jumps centered on approximately the base of the core and 5.2 m depth (~5820 and 2418 cal yr BP, respectively). We interpret each of these intervals as periods of greater terrestrial input from the surrounding alluvial fans. The fossil remains of charophytes are a pervasive feature throughout much of the LPAH record. These macroscopic green algae most commonly grow and thrive in clear, alkaline, freshwater lakes (Hutchinson, Reference Hutchinson1975) such as LPAH, and Chara spp. occur in the modern lake in dense meadows. In both our macroscopic and microscopic investigation of down-core materials, we regularly found two distinct calcified parts of charophytes: gyrogonites (reproductive zygotes) and calcite encrustations (Fig. 4). The ubiquitous nature of these remains supports the long-term persistence of a clear, alkaline, and freshwater condition for the majority of the lake's history. Here we describe two additional facies found at the base of the longer record under investigation.

Figure 4. (color online) Evidence of the aquatic plant Chara spp., which is found extensively throughout the Lower Pahranagat Lake core record. (A) Close-up photograph of an individual fossil gyrogonite from core sediments. (B) Photograph of calcite-encrusted plant stems.
Clay unit (12.28 to 12.40 m depth)
At the base of the core, we captured the top 12 cm of a distinct clay facies. The unit is a gray to dark-gray, clay to fine-silt-sized material. Smear slides from this interval show a high proportion of clastic materials with magnetic susceptibility reaching the highest values for the record. This unit also has a small number of diatom microfossils, indicating the presence of an aqueous environment. This clay unit appears to be associated with an interval of siliciclastic sedimentation, derived from the surrounding Tertiary volcanic carapace that temporarily shut off carbonate production. This may be related to a period of increased local runoff and/or wind transport from the surrounding alluvial fans in the basin. This unit is centered on an age of 5792 cal yr BP.
Peat unit (11.78 to 12.28 m depth)
In sharp contact with the underlying clay unit is an olive brown to black, 50-cm-thick organic-rich layer. The high organic matter content (32.9–78.7%) and TOC (10.8–27.1%) measured from samples in this unit are characteristic of peat. Smear slides and thin sections reveal that the sediment ranges from clay to very fine sand grain sizes with abundant plant fragments, calcite, and, in some intervals, rare diatoms. The plant fragments range from reddish brown to black in color, show a layered or blocky structure, and sometimes have visible cell structure. A low δ13C value (–24.1‰) measured from plant fragments in this unit suggests they are largely composed of C3 plants like trees, shrubs, grasses, and sedges (Deines, Reference Deines, Fritz and Fontes1980). Intermediate to high C/N values (17.3 to 78.7) measured from this unit fall in the range of measured modern aquatic and terrestrial plants from LPAH. The characteristics of this unit suggest a palustrine setting where generally water-saturated and low oxygen conditions were prime for peat formation. The observed blackened plant fragments and general absence of diatoms suggest periodic drying and oxidation during the formation of this unit.
Stable isotopes
Both δ18O and δ13C show a wide range of values in the LPAH record, with δ18O values ranging from –11.44‰ to + 1.14‰ and δ13C values ranging from –5.22‰ to + 10.28‰ (Fig. 5). There is a statistically significant positive covariation between δ18O and δ13C values in LPAH samples (n = 155, P ≤ 0.0001; t-test). This is a typical phenomenon in hydrologically closed lakes (Talbot, Reference Talbot1990) and is the result of evaporative enrichment of 18O in water and 13C in DIC (e.g., Horton et al., Reference Horton, Defliese, Tripati and Oze2016). Between 5250 and 4000 cal yr BP, stable isotopic values are especially low (−11.4‰ to −9‰ for δ18O and −5‰ to −4‰ for δ13C). Values for both δ18O and δ13C increase sharply to the highest levels in the record (+1.14‰ for δ18O and +10.28‰ for δ13C) and remain high between 3150 and 2500 cal yr BP and again between 2100 and 1700 cal yr BP, indicating two distinct periods of evaporative enrichment. Between these two multicentury evaporative periods is a shorter period centered on 2350 cal yr BP during which isotopic values for both drop significantly (−8.7‰ for δ18O and −4.9‰ for δ13C). Stable isotopic values also vary on centennial timescales over the past 1600 cal yr of the LPAH record with periods of low values centered on ~1600 and 600 cal yr BP and periods of high values (dry intervals) centered on 1100 cal yr BP and over the past few centuries (Fig. 5).

Figure 5. (color online) Stable isotopic and elemental results for the Lower Pahranagat Lake (LPAH) composite core record. Core lithology is shown near the age (left) axis. TIC, total inorganic carbon; TOC, total organic carbon; VPDB, Vienna Pee Dee belemnite.
TOC, C/N, and TIC content
TOC values range widely with most values being relatively low (<3%) (Fig. 5). One exception to this is the peat unit near the base of the record, where values increase by an order of magnitude, reaching up to 27.1%. LPAH organic C/N reflects changing mixtures of terrestrial and aqueous plant sources of organic matter. Modern terrestrial plants from LPAH have organic C/N values ranging from 46.6 to 142, submerged aquatic plants have values ranging from 14.6 to 29.1, and modern algae values are 5.99 to 6.96. Down-core C/N values range widely from 12.2 to 98.2 (Fig. 5). Values are generally higher (median = 33.2) and largely reflect a mixture of terrestrial and submerged aquatics between the oldest part of the record and 4950 cal yr BP. Between 4900 and 3400 cal yr BP, values are lower (median = 11.8) and reflect a mixture of submerged aquatic plants and algal sources of organic matter. Values again rise (median = 24.8) to reflect mainly submerged aquatic sources with some terrestrial input between 3400 and 1700 cal yr BP. The most recent 1700 yr of the record indicates consistent low values (median = 9.3) and a mixture of algal and submerged aquatic sources. TIC concentrations are high throughout the record and are especially so (up to 10.9%) between 5450 and 4900 cal yr BP. Variation in TIC values is generally in phase with the stable isotopic data discussed previously (Fig. 5).
DISCUSSION
Paleohydroclimate overview
The LPAH record suggests that a shallow lake or wetland has continuously existed (or nearly so) in this area since 5800 cal yr BP. The earliest part of the LPAH record (~5800–5700 cal yr BP) is represented by the uppermost portion of the siliciclastic clay unit with diatom microfossils, representing the existence of a shallow lake. The absence of carbonate suggests that surface runoff from adjacent alluvial fans may have dominated sedimentation and, hence, water supply to the lake. The clay unit lies in sharp contact with the overlying peat layer, suggesting that LPAH water level dropped abruptly after ~5700 cal yr BP.
What might account for this abrupt depositional change? One possibility is the onset of drought conditions. The LPAH record shows a sharp and brief rise to a higher δ18O value near this time, but this is only a single value (little available carbonate in the peat unit), and that value (−6.30‰) at 5564 cal yr BP and in the upper 10 cm of the peat unit is still relatively low for the record overall (Fig. 5). There is little evidence for a trend toward drought elsewhere in the region at this time. The high-resolution speleothem record from nearby Leviathan Cave suggests an important step toward wetter rather than drier conditions at this time, with a trend toward lower δ13C values and an increase in cave drip rates (Lachniet et al., Reference Lachniet, Denniston, Asmerom and Polyak2014). Other regional records show relatively muted hydroclimatic responses during this time period (Fig. 6).

Figure 6. Comparison of the Lower Pahranagat Lake (LPAH) δ18O record with paleohydroclimate indicators from the southern and central Great Basin for the mid-Holocene to recent. Total carbonate from Stonehouse Meadow (Mensing et al., Reference Mensing, Sharpe, Tunno, Sada, Thomas, Starratt and Smith2013) and δ13C values from Leviathan Cave deposits (Lachniet et al., Reference Lachniet, Denniston, Asmerom and Polyak2014). The gray area indicates the timing of the late Holocene dry period as proposed by Mensing et al. (Reference Mensing, Sharpe, Tunno, Sada, Thomas, Starratt and Smith2013). PDB, Pee Dee belemnite.
We speculate that there may be a nonclimatic reason for this change. One possibility is the movement of alluvial fans that are adjacent to LPAH. Fan surfaces near both the northern and southern ends of the lake show evidence of being relatively young with few incised channels. Perhaps one or more fan lobes near the lake or farther north moved or were breached, with a resulting change in the hydrology of the valley. A second possibility is that tectonic activity might have modified the topography and surface hydrology of LPAH. The Pahranagat Valley is cut by a series of east–northeast trending left-lateral strike-slip faults that include the Buckthorn Fault just to the north of LPAH and the Maynard Lake Fault (MLF) just to the south of the lake. Recent geophysical work has indicated that this Pahranagat Shear Zone (PSZ) accommodates up to 1.8 mm/yr of east–west basin and range extension (Kreemer et al., Reference Kreemer, Blewitt and Hammond2010). Quaternary fault scarps have been mapped in the PSZ including at least one along the MLF (Muhammad, Reference Muhammad2016). Perhaps fault movement along the MLF resulted in the destruction or modification of a sill at the south end of LPAH, abruptly shifting the depocenter farther south and into Maynard Lake after 5700 cal yr BP. However, there is no direct, dated evidence of mid- to late Holocene activity on these faults (Taylor, W., personal communication, 2018).
Deposition of the 50-cm-thick peat layer indicates a shallow water table to support a marsh that may have periodically desiccated. Stable isotopic values for this earliest part of the record are moderate to low. The drop to low stable isotopic values at ~5500 cal yr BP and the sharp depositional change from peat to carbonate mud signal a transition from a peatland/marsh to an alkaline shallow lake. High organic C/N values at this time suggest that terrestrial plants were the dominant organic input at this time. As the lake continued to fill and expand, organic C/N values dropped, indicating decreasing terrestrial inputs and increasing in-lake sources of organic matter. For the period between 5500 and 3350 cal yr BP, stable isotopic values are at their lowest in the entire record, suggesting generally wetter and/or less evaporative conditions in the Pahranagat Valley.
Between ~3150 and 2600 cal yr BP, a distinct multicentury period is indicated by a sharp rise to the highest δ18O and δ13C values in the LPAH record (Fig. 5). Viewed purely as an indicator of paleohydroclimate, the anomalous isotopic enrichments of approximately +10‰ for δ18O and +14‰ for δ13C during the transition into this period suggest that unusually dry and evaporative conditions were affecting the area at this time. This period is also indicated by a distinct rise in organic C/N values and a less pronounced rise in TOC, as lake margins neared our coring site in the desiccating lake. Within the longer period of drought, a century-scale interval centered on 2350 cal yr BP shows low TOC values, higher organic CN, low TIC, and low stable isotopic values. Smear slides from this interval show a high proportion of clastic materials with unusually coarse grain sizes (up to fine-grained sand size) and magnetic susceptibility reaching anomalously high values for the record. All of this can be explained by increased input of terrestrial materials during a wetter interval. This wet period was followed by a second multicentury dry period, centered on 1750 cal yr BP, with nearly the same level of isotopic enrichment as the earlier dry episode. There is also some evidence of a century-scale wet interval from 2800 to 2700 cal yr BP. This is most clearly seen in a well-defined drop in TIC but is also indicated by a sharp drop in stable isotopic values. After 1700 cal yr BP, stable isotopic values drop sharply to lower levels before a more gradual drop in values starting at ~1500 and reaching a minimum at about 600 cal yr BP. Multidecadal- to century-scale wet periods at 1600 and 600 cal yr BP are indicated by sharp drops in stable isotopic and TIC values. The most recent 400–500 yr of the record show a trend toward increasing aridity as indicated by rising stable isotopic values and high TIC values.
Comparison with other Great Basin records
The deposition of siliciclastic clay and peat, accompanied by relatively lower stable isotopic values, suggests relatively humid or wetter conditions in the latter part of the middle Holocene in the Pahranagat Valley, followed by the filling of a shallow, alkaline lake after ~5500 cal yr BP. The timing of increasingly wet conditions at LPAH is consistent with evidence from around the Great Basin. In the western Great Basin, pollen evidence from Pyramid Lake suggests rising lake level and somewhat wetter conditions starting at ~6300 cal yr BP with evidence for clearly wetter conditions and the end of middle Holocene aridity at ~5000 cal yr BP (Mensing et al., Reference Mensing, Benson, Kashgarian and Lund2004). In the central Great Basin north of LPAH, pollen and elemental evidence imply that Stonehouse Meadow was well established and may have even had standing water from 7300 to 3000 cal yr BP (Mensing et al. Reference Mensing, Sharpe, Tunno, Sada, Thomas, Starratt and Smith2013). Closer to LPAH, the speleothem record from Leviathan Cave suggests that generally wetter conditions started at ~5000 cal yr BP (Lachniet et al., Reference Lachniet, Denniston, Asmerom and Polyak2014). In contrast, farther to the south in the Las Vegas Valley, the absence of black mats indicates that this area remained relatively dry following the last clear wet period near the end of the Younger Dryas interval (Springer et al., Reference Springer, Manker and Pigati2015).
The two distinct multicentury-scale dry periods between 3150 and 1700 cal yr BP at LPAH are significant in terms of their magnitude and duration. This is consistent with the pollen-based record from LPAH (fig. 18 in Wigand and Rhode, Reference Wigand, Rhode, Hershler, Madsen and Currey2002), which generally indicates drier than current conditions over much of this interval. The pollen record shows three multidecadal- to century-scale wet periods (centered on 2700, 2300, and 2000 cal yr BP) over this time. Our record shows strong evidence of the 2300 cal yr BP event and some evidence for the 2700 cal yr BP event in a brief, sharp drop to lower stable isotopic and a more fully developed drop in TIC values. We expect some difference between the two records because of sampling resolution with the pollen record having an average sampling resolution (~14 yr) that ranges from 1.5 to 3 times higher than the sampling resolution for our elemental and stable isotopic analyses. The 3150–1700 cal yr BP interval encompasses an extended period of drought noted for the Great Basin that was termed the LHDP by Mensing et al. (Reference Mensing, Sharpe, Tunno, Sada, Thomas, Starratt and Smith2013). Tausch et al. (Reference Tausch, Nowak, Mensing, Chambers and Miller2004) reported evidence of a “post-Neoglacial drought” between 2600 and 1600 cal yr BP based on packrat midden and pollen records collected from the Toyiabe Range of the central Great Basin. Mensing et al. (Reference Mensing, Livingston Reno and Barker2006) found evidence of aridity over much of this interval in a sediment record from Newark Valley Pond. More recently, Mensing et al. (Reference Mensing, Sharpe, Tunno, Sada, Thomas, Starratt and Smith2013) reported their evidence for dry conditions spanning 2800–1850 cal yr BP at Stonehouse Meadow in the central Great Basin. These authors also gave a thorough review of the evidence for the LHDP at a number of additional sites across the central and southern Great Basin, including (1) Homestead Cave in the east central Great Basin; (2) Pyramid, Walker, and Mono Lakes in the west-central Great Basin; and (3) the Las Vegas Valley in the southern Great Basin (see figs. 7 and 8 in Mensing et al., Reference Mensing, Sharpe, Tunno, Sada, Thomas, Starratt and Smith2013).
Overall, there appears to be a compelling similarity between the paleohydroclimatic trends revealed in the LPAH stable isotopic and some of the central Great Basin sites, especially the Stonehouse Meadow record of the past 6000 cal yr (Fig. 6). Comparison of these two records suggests that dry conditions began a few centuries earlier at LPAH than at the Stonehouse Meadow location, but given the uncertainty in the radiocarbon chronologies of these records, the timing may have been more or less synchronous. This indicates a consistent atmospheric forcing of evaporation both at LPAH and to the north in the central Great Basin. In contrast, the Leviathan Cave speleothem record, located closer to LPAH than any of the central Great Basin sites, shows general correspondence with the LPAH record for some intervals, but little evidence for drought during the LHDP, instead indicating increased growth of cave deposits and a shift to relatively wetter conditions during that time (Fig. 6). We think the important differences between these two records are explained by the different spatial and seasonal signals that are being recorded by the two archives. The LPAH water balance is strongly influenced by input from a regional aquifer with a large recharge area and near constant spring discharge throughout the year (Fig. 1A), whereas the Leviathan Cave deposits are not connected to or influenced by a regional aquifer and are instead recording only water infiltration from directly above the cave site. Evaporation clearly has a significant influence on water balance at LPAH as well. Carbonate production and stable isotopic values are strongly influenced by evaporative enrichment, following a distinct trend line for Pahranagat Valley surface water and groundwater that deviates sharply from the southern Nevada meteoric water line (Fig. 2). This δ18O enrichment peaks in the late summer and early fall months. In contrast, Leviathan Cave speleothem stable isotopic values are not influenced by evaporation, and δ18O values fall directly on the southern Nevada meteoric water line. Given these differing influences, one possibility is that the LPAH record was strongly affected by extreme summer evaporation during the LHDP, whereas the winter-sensitive record from Leviathan may not have registered the enhanced summer season dry conditions.
The LPAH record indicates several century-scale oscillations in hydroclimate over the last 2500 cal yr BP as well. Evidence for multidecadal- to century-scale drought has been found in paleohydroclimate records across the Great Basin (e.g., Stine, Reference Stine1994; Benson et al., Reference Benson, Kashgarian, Rye, Lund, Paillet, Smoot, Kester, Mensing, Meko and Lindström2002). The pronounced century-scale wet interval centered on 2350 cal yr BP in the LPAH record is consistent and synchronous with events indicated in the LPAH pollen record (Wigand and Rhode, Reference Wigand, Rhode, Hershler, Madsen and Currey2002) and with evidence from the Leviathan Cave isotopic data and the Stonehouse Meadow carbonate data (Fig. 6). Drought intervals centered on 1750 and 1200 cal yr BP in the LPAH record correspond to lake level declines at Mono and Pyramid Lakes (Stine, Reference Stine1990, Reference Stine1994; Benson et al., Reference Benson, Kashgarian, Rye, Lund, Paillet, Smoot, Kester, Mensing, Meko and Lindström2002) and at Kingston Meadow (Mensing et al., Reference Mensing, Smith, Norman and Allan2008). However, in contrast with many Great Basin records, LPAH data indicate little evidence of notable aridity during dry intervals associated with the MCA (930–780 cal yr BP). This may simply be a matter of insufficient sampling or chronological resolution in the LPAH record. However, the higher-resolution record from Leviathan Cave also shows little evidence for aridity during the MCA (Fig. 6), suggesting hydroclimate variability across the west. A wet interval centered on 600 cal yr BP in the LPAH record falls at the earliest part of the Little Ice Age. The record from LPAH suggests a trend toward drier conditions over the last ~500 cal yr. The record from nearby Leviathan Cave shows evidence of this trend toward drier conditions as well. The most recent century of this trend is at least in part because of human controls on the distribution of the Pahranagat Valley water supply, which have diverted and impounded some of the water that would have naturally flowed into LPAH and thereby reducing its volume.
Regional paleohydroclimate forcings
Across the southern and central Great Basin, there is evidence of the influence of the Pacific Ocean over interannual to multidecadal timescales. Historical data on precipitation in the Pahranagat Valley show that above-average precipitation occurred during many El Niño–Southern Oscillation (ENSO) positive phase (El Niño) years (Western Regional Climate Center, https://wrcc.dri.edu/ [accessed October 15, 2017]). This correspondence is consistent with the findings of Hevesi et al. (Reference Hevesi, Flint and Flint2003) for a broader set of watersheds within the southern and central Great Basin. These authors also note good correspondence with the Pacific Decadal Oscillation (PDO), a multidecadal phenomenon associated with North Pacific Ocean sea surface temperatures, with above-average precipitation during the positive phase of the PDO and below-average precipitation during the cool phase. Just as modern Great Basin hydroclimate variability is influenced by conditions in the Pacific Ocean, a number of previous investigations have shown evidence that this likely holds true over the century- and millennial-scale time periods discussed in this article as well. Barron and Anderson (Reference Barron and Anderson2011) reported that numerous proxy records from the northeastern Pacific indicate a more La Niña–like condition during the dry middle Holocene (8000–4000 cal yr BP) than in the relatively wetter late Holocene. Mensing et al. (Reference Mensing, Sharpe, Tunno, Sada, Thomas, Starratt and Smith2013) reviewed evidence of a north–south dipole for sites influenced by ENSO, with a boundary zone near 40–42°N for the Great Basin. During the LHDP, sites south (north) of this zone, which includes the central and southern Great Basin, show evidence for dry (wet) conditions. Overall, we are confident that the climatic forcings affecting the recharge area of the regional aquifer are the dominant control on the water balance in the Pahranagat Valley and likely exhibit similar controls on neighboring north-to-south-oriented valleys in the central to southern Great Basin.
Our findings of multiple century- to millennial-scale episodes of past drought are consistent with a large and growing body of paleohydroclimate research across the Great Basin. Given the apparent frequency of these events in the past, and the potential impacts of climate change on hydroclimate in the Southwest and across North America, we should expect and be prepared for more dry conditions (Cook et al., Reference Cook, Smerdon, Seager and Cook2014).
CONCLUSIONS
We found evidence that LPAH has existed continuously, or nearly so, as a shallow lake, wetland, or marsh for at least the past 5800 cal yr. Our data show evidence of distinct millennial trends over the later part of the middle Holocene and into the late Holocene. The data indicate the establishment of a shallow, alkaline lake after ~5500 cal yr BP and relatively wet conditions until ~3350 cal yr BP. From 3150 to 1700 cal yr BP, our data show evidence for a period dominated by drought with maximum aridity at ~2600 cal yr BP. This drought is consistent with the LHDP described by Mensing et al. (Reference Mensing, Sharpe, Tunno, Sada, Thomas, Starratt and Smith2013). Our results suggest that this was the most significant drought affecting the Pahranagat region over the period of record, though the absence of a record prior to ~5800 cal yr BP indicates the possibility for even drier conditions during the middle Holocene. The results also provide evidence that this millennial-scale drought had impacts farther to the south than have previously been recognized. We also note several century-scale climate episodes in the LPAH record. Most importantly, this includes drought intervals centered on 1750 and 1200 cal yr BP and wet intervals centered on 2350 and 600 cal yr BP. The past few centuries indicate progressively drier conditions.
ACKNOWLEDGMENTS
We thank the American Chemical Society Petroleum Research Fund for a generous grant to K.M. Theissen and T.A. Hickson, which supported this research (Grant #53934-UR8). We thank Peter Wigand and James Paces for helpful conversations about Lower Pahranagat Lake in the early stages of this project. We also thank Eric Stevens, Nick Hermann, and Allison Jones for help in the field; Rob Vinson of the U.S. Fish and Wildlife Service; and the staff at LacCore for their support of core processing. We thank Scott Mensing and Susan Zimmerman for their thorough and helpful reviews of an earlier version of this manuscript, which greatly improved it.


