


Introduction
The UK’s Universal Credit (UC) welfare reform has been rolling out gradually since 2013 to replace six working-age means-tested ‘legacy benefits’ with a single UC payment. This pooling together of benefits has been described as a ‘leap into unchartered territory’ (Pareliussen, Reference Pareliussen2013: 5), and ‘the most significant change to the welfare system since the Beveridge reforms’ (DWP, 2010). To date, UC rollout has faced criticism for its single-minded focus on employment outcomes, with evidence of claimant hardship being dismissed (Alston, Reference Alston2018; National Audit Office, 2018). Empirical literature suggests UC’s employment impacts are mixed (DWP, 2017b, 2018a), but that its wider impacts have been largely negative, e.g. quantitative research suggests UC has reduced household incomes amongst the poorest 10 per cent of adults (Brewer et al., Reference Brewer, Joyce, Waters and Woods2019), and is associated with negative outcomes related to mental health (Wickham et al., Reference Wickham, Bentley, Rose, Whitehead, Taylor-Robinson and Barr2020), food bank usage (Reeves and Loopstra, Reference Reeves and Loopstra2021) and acquisitive crime (d’Este and Harvey, Reference d’Este and Harvey2020).
One area where more quantitative research is needed relates to UC’s housing insecurity impacts. Housing charities have raised concerns that UC’s long wait periods, harsh conditionality and monthly arrears payments can place claimants at risk of rent arrears/eviction/homelessness (e.g. see Crisis, 2017; Shelter, 2017). Such concerns are backed up by qualitative research with UC claimants (Batty, Reference Batty2018; Britain Thinks, 2018; Cheetham et al., Reference Cheetham, Moffatt and Addison2018; Wright et al., Reference Wright, Dwyer, Jones, McNeill, Scullion and Stewart2018), which provide evidence of some UC claimants facing difficulties meeting rent payments, falling into arrears and facing repossession actions. Quantitative studies on this topic to date have tended to be limited to specific local areas (e.g. see Hickman et al., Reference Hickman, Kemp, Reeve and Wilson2017; Smith Institute, 2017, 2019; National Audit Office, 2018: 44–5), whilst more national-level studies have either been based on cross-sectional data (Drake, Reference Drake2017; Hobson et al., Reference Hobson, Spoor and Kearton2019) or have been unable to disaggregate the impact of UC between those in the social rented sector (SRS) and private rented sector (PRS) (Hardie, Reference Hardie2021).
This article builds on these existing studies by exploiting quarterly local authority level panel data (2014 Q1 – 2019 Q1) collected by Citizens Advice on rates of advice sought on rent arrears and homelessness. This is linked with quarterly local authority level DWP data on UC rollout. The staggered nature of UC rollout (i.e. the fact it rolled out in different areas at different times, see Hardie, Reference Hardie2021: 229–30 for a full overview) is exploited to address the following research questions:
-
1. Has UC rollout led to an increase in rates of advice sought from Citizens Advice on rent arrears and/or homelessness related issues within 323 English local authorities up to 2019 Q1?
-
2. Does the impact of UC rollout on advice rates (if any found) increase when it has been rolled out for longer and thus reached more claimants?
-
3. How does this impact vary between those in the private rented sector and those in the social rented sector?
Background
The aims of the Universal Credit reform and how it has changed the social security system
The original aims/principles of UC were: (a) simplifying the welfare system, (b) improving financial work incentives, (c) increasing conditionality and sanctions, (d) making the welfare system ‘like work’, and (e) promoting the UK’s flexible labour market. These are summarised below, in terms of why they motivated the UC reform and how UC has altered the UK welfare system to match them.
Simplifying the welfare system
Under the legacy system, working-age means-tested benefits were administered by three different government departments, with the DWP administering out-of-work benefits, HM Revenue and Customs administering in-work benefits and local authorities administering Housing Benefit. These were paid at different intervals and withdrawn at different rates, with claimants often on various different combinations of benefits at different times (Bennett, Reference Bennett, Kilkey, Ramia and Farnsworth2012). UC attempts to cut through these complexities via two simplifying elements: (a) by being administered by a single department (DWP), meaning claimants only have to claim once, and (b) by having a single taper rate. However, despite the principle of a simpler system being widely supported, its design and delivery in reality has been far from simple and is removed from the realities of life on a low income (Millar and Bennett, Reference Millar and Bennett2017), and research with claimants suggests that UC’s alleged simplicity can be justified from an administrative perspective but not from the perspective of claimants (Summers and Young, Reference Summers and Young2020).
Improving financial work incentives
Another issue UC has sought to address relates to work incentives. The legacy system did not provide incentives to take on ‘mini-jobs’ of a few hours per week, or to take on work beyond the sixteen hours per week Working Tax Credits (WTC) qualifying threshold. This is because, under Jobseeker’s Allowance, single unemployed claimants can earn only £5 per week before they lose a pound of benefits for every pound of work, and whilst qualifying for WTC provided a big income boost, taking on extra hours beyond the entitlement threshold led to only modest further income increases (Bennett, Reference Bennett, Kilkey, Ramia and Farnsworth2012: 17; Royston, Reference Royston2017: 165–6). UC attempts to overcome this via: (a) work allowances, which allow eligible claimants (i.e. those who have responsibility for a child or have limited capability for work) to keep 100% of UC payments on top of extra earnings from work up to a certain work allowance threshold, and (b) a single taper rate, which currently means claimants lose 63p (reducing to 55p following the Autumn 2021 budget) of benefits for every extra pound earned from work above their work allowance threshold. In reality, the extent to which UC does improve work incentives compared to the legacy system depends on how many hours a claimant works and their household circumstances. This means that work incentives improve for some claimants but not others (Gardiner and Finch, Reference Gardiner and Finch2020). Importantly, work allowances are only applied once per household, which reduces work incentives for ‘second earners’ in the household (Finch and Gardiner, Reference Finch and Gardiner2018).
Increased conditionality and sanctions
UC has also aimed to increase conditionality. Welfare conditionality means eligibility for benefits is linked to specified compulsory responsibilities or patterns of behaviour, with sanctions for non-compliance (Welfare Conditionality Project, 2018). Conditionality was already an established feature of the welfare system in the UK (and other western countries) prior to UC (Watts and Fitzpatrick, Reference Watts and Fitzpatrick2018). However, UC intensifies conditionality (Dwyer and Wright, Reference Dwyer and Wright2014), and extends it to previously exempt groups, e.g. those in-work (Wright and Dwyer, Reference Wright and Dwyer2020) and more lone parents (Rafferty and Wiggan, Reference Rafferty and Wiggan2017). The rationale for this is to ‘encourage people to increase their earnings and hours’ (DWP, 2010: 31). However, existing research provides limited evidence that sanctions are effective, and they are associated with a range of negative outcomes (Pattaro et al., Reference Pattaro, Bailey, Williams, Gibson, Wells, Tranmer and Dibben2022).
Making the welfare system ‘like work’
A further aim of UC was to make the welfare system ‘like work’ (DWP, 2017a). This means: (a) claimants must sign a ‘claimant commitment’ (designed to be like an employment contract), and (b) claimants are, by default, paid monthly in arrears and directly into their own bank account. Whilst the ‘claimant commitment’ is similar to the legacy system’s ‘Jobseekers Agreement’, the switch of payment system does represent a substantial policy shift. Legacy benefits were typically paid fortnightly, with Housing Benefit in the social rented sector paid to landlords (not directly to claimants) (UK Government, 2018a). The motivation for this shift is to encourage greater responsibility for claimants to manage their own household budgets (DWP, 2012: 38). However, the fact that it is paid in arrears creates a long wait period – typically five weeks – before claimants receive their first payment, and this new payment system has been criticised for failing to fit with the pattern of how many low-income households manage their money (Bennett, Reference Bennett, Kilkey, Ramia and Farnsworth2012).
Promoting the UK’s flexible labour market
A final aim of UC is to promote the UK’s flexible labour market (see DWP, 2010: 12). Labour market flexibilisation has occurred throughout recent decades, with technological advancements and globalisation creating a perception of a need for flexibility for employers to change staff levels in response to fluctuating demand (Bender and Theodossiou, Reference Bender and Theodossiou2018). This has been achieved via labour market deregulation, and the end result is a UK labour market with increasing use of atypical forms of employment, e.g. temporary work/zero-hour contracts/low-paid self-employment. The flexible labour market is said to boost business efficiency and keep unemployment low, but has also been linked to negative consequences such as underemployment (Rafferty and Wiggan, Reference Rafferty and Wiggan2017), in-work poverty (Hick and Lanau, Reference Hick and Lanau2017) and mental ill-health amongst workers (Bender and Theodossiou, Reference Bender and Theodossiou2018).
As well as promoting the UK’s flexible labour market via conditionality, which supports flexibilisation by compelling benefit claimants to actively seek/accept atypical forms of work (Rafferty and Wiggan, Reference Rafferty and Wiggan2017), UC also promotes the flexible labour market through its new Real Time Information (RTI) system. RTI is designed to be better suited to atypical forms of employment by being automatically recalculated in response to fluctuating earnings (DWP, 2016). However, the RTI has led to new problems, e.g. claimants losing UC payments if their work payment date changes month-to-month or if their employer does not accurately record their information (Citizens Advice Scotland, 2016).
Universal Credit and housing insecurity in the social and private rented sectors
From a historical context, prevention of housing insecurity has been an important aspect of the UK welfare state since its conception. During the early decades of the welfare state (1940s-1970s), housing security was promoted though a combination of rent controls and central subsidies to local government for social housing (see Lund, Reference Lund2017). Subsequently, housing became subsidised through rent rebates/allowances through the Housing Finance Act in 1972, before the establishment of Housing Benefit (HB) in 1983 and Local Housing Allowance (LHA) in 2008 (Lund, Reference Lund2011). The overarching principle of HB and LHA is that housing costs should not lead to a household’s income going lower than certain ‘income support levels’ (Lund, Reference Lund2017). This does not change under UC, under which the housing element is calculated using the existing HB and LHA systems in the medium term (Webb, Reference Webb2012). Instead, the main difference between UC and the legacy system in preventing housing insecurity relates to the design and structure of the system. An overview of UC’s structure compared to the legacy system, and of how UC payments (including the housing element) are calculated, is provided in Tables 1 and 2.
Table 1 The structure of Universal Credit vs. the legacy system

Source. Adapted from Finch (Reference Finch2015: 26) and Brewer et al. (Reference Brewer, Joyce, Waters and Woods2019).
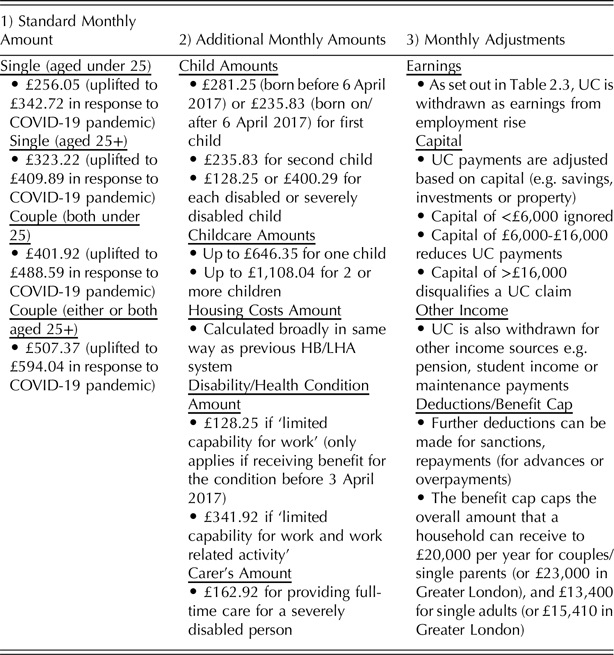
Table 2 An Overview of how UC payments are calculated

Notes. Amounts are for 2020-2021. Figures show total amounts and amounts in place when UC was uplifted during the COVID-19 pandemic. Sources. McInnes (Reference McInnes2020); DWP (2021b); UK Government (2021a, 2021b).
Housing insecurity for financial reasons can occur in four stages, as set out in Figure 1. UC can potentially impact on each of these four stages. This is because, not only can UC be, overall, less generous than the legacy system for some poorer households (Brewer et al., Reference Brewer, Joyce, Waters and Woods2019), but several of its design features may have implications for housing security. Firstly, the five-week wait for the first UC payment can leave claimants without income for rent (see Shelter, 2017), and whilst advance payments are available for those requiring immediate support these are essentially loans that leave claimants with the choice of hardship now or hardship later (Thompson et al., Reference Thompson, Jitendra and Rabindrakumar2019). Meanwhile, other safeguards like the two-week HB run on are only applied to those moving onto UC from Housing Benefit so do not help those without an existing HB claim. Secondly, UC’s increased conditionality can lead to rent arrears as sanctions can force claimants to spend their allocated housing costs money on other essentials, and this can be exacerbated further via other UC deductions (see Table 2) (McIvor, Reference McIvor2018; Wright et al., Reference Wright, Dwyer, Jones, McNeill, Scullion and Stewart2018). Thirdly, UC’s new system of monthly payments directly to claimants’ own bank accounts can potentially lead to difficulties meeting rent payments amongst those who are faced with unexpected costs, although safeguards such as Alternative Payment Arrangements and UC ‘Scottish Choices’ in Scotland are now in place to protect against this. Qualitative research suggests that these design issues have resulted in housing insecurity, particularly related to the earlier stages of insecurity set out in Figure 1. e.g. studies with UC claimants suggest that many struggle financially during the wait for the first payment, with often experiencing debt/arrears and are forced to ‘rotate’ which bills they pay each month (Bush et al., Reference Bush, Templer and Allen2019; Cheetham et al., Reference Cheetham, Moffatt, Addison and Wiseman2019; Robertson et al., Reference Robertson, Wright and Stewart2020).

Figure 1. The four stages of housing insecurity
Quantitative research on UC’s housing security impacts has also highlighted its detrimental impact on the early stages of insecurity, but has tended to be limited to small scale localised studies (e.g. see National Audit Office, 2018: 44–5; Smith Institute, 2017, 2019). Meanwhile, Hardie (Reference Hardie2021) does examine UC’s housing insecurity impacts across England and suggests that its rollout has been associated with increases in landlord repossession actions, but was unable to disaggregate the impact of UC in the social versus private rented sectors.
Examining UC’s impact in the social and private sector separately is important as its impact is likely to differ between sectors. Firstly, this is because UC’s monthly direct payment system is completely novel in the SRS but not in the PRS (where direct payment to claimants’ own bank accounts has been in place since 2008). Furthermore, as has been argued by Hickman et al. (Reference Hickman, Kemp, Reeve and Wilson2017), the impact of UC on the SRS is likely to be greater than in the PRS because those in the SRS are more likely to be vulnerable to arrears. Indeed, the initial reason why SRS tenants will have been accepted for social housing is because they are more likely to be vulnerable to rent arrears (Hickman et al., Reference Hickman, Kemp, Reeve and Wilson2017: 4). This is reflected by the fact that the majority of landlord repossession actions occur in the SRS (Ministry of Justice, 2019), and that despite spending a lower percentage of their income on housing costs, those in the SRS are most likely to have rent arrears than those in the PRS (MHCLG, 2018: 4). Taken together, this suggests that UC rollout is likely to adversely affect the SRS more than the PRS. However, there is currently a lack of robust quantitative analysis on UC’s varying impact between sectors. This article seeks to address this.
Data and methods
Setting
A quarterly local authority level panel dataset was compiled for an analytic sample of 323 English local authorities. The dataset covered 2014 Q1 – 2019 Q1. West Somerset, City of London and Isles of Scilly were excluded due to their small populations.
Citizens Advice data
Citizens Advice (aka Citizens Advice Bureau or CAB) are a network of local, independent charities providing free and confidential advice/information to people (face-to-face, online, or over the phone) in the UK (Citizens Advice, 2021). Key advice issues include problems relating to benefits, work, debt and money, consumer issues, housing, family, immigration and health (Citizens Advice, 2021).
The analysis here makes use of ‘advice trends’ data, which are collected by Citizens Advice on how many clients they see, who they are (including where they live) and what problems they are seeking advice on (Watson, Reference Watson2018). This can be used to gain insight into structural and policy issues and how these vary across space and time, as Citizens Advice is often the first place people will go when they are faced with a problem – in 2018/19 they gave advice to 1,273,000 people face-to-face, 867,000 people over the phone and 287,000 online through e-mail or webchat (Watson, Reference Watson2018).
These ‘advice trends’ data were used to create three main outcome variables: (1) rent arrears advice rate, (2) threatened homelessness advice rate, and (3) actual homelessness advice rate. Each variable indicates the quarterly number of people who were advised on rent arrears, threatened homelessness and actual homelessness (per local authority in the sample per quarter). The rent arrears advice rate was initially coded as a rate per 10,000 rented dwellings in the local authority; and, to examine variation between the SRS and PRS, it was subsequently disaggregated into an SRS rent arrears advice rate per 10,000 SRS dwellings and a PRS rent arrears advice rate per 10,000 PRS dwellings. The homelessness advice rates were coded per 10,000 households in the local authority. Each person who visits Citizens Advice is only counted once to avoid duplication when somebody has repeat visits for an ongoing issue.
Universal Credit data
UC data were collected from its official rollout schedule (UK Government, 2015a, 2015b, 2018b), and DWP Stat-Xplore benefit statistics (DWP, 2021a). This was used to create three main explanatory variables: (1) UC ‘Live Service’, which is a binary variable indicating whether UC ‘Live Service’ (i.e. early version of UC for new claims from single unemployed claimants without housing costs only) has rolled out yet in each local authority quarter, (2) UC ‘Full Service’, which is a binary variable indicating whether UC ‘Full Service’ (i.e. full version of UC available to new claims from all claimant types) had rolled out yet in each local authority quarter, and (3) UC ‘Full Service’ by length of rollout, which is a categorical variable indicating whether ‘Full Service’ had rolled out yet in each local authority quarter, and if so for how long. A table with a full list of the timing of UC ‘Live Service’ and UC ‘Full Service’ rollout within each English local authority is provided in the supplementary material: Appendix 1.
In addition, two further explanatory variables were created to examine the impact of UC rollout in the SRS and the PRS. The first is the SRS households on UC with housing costs rate, which indicates, per local authority quarter, the number of SRS households who are on UC and receive housing costs payments. This is coded as a rate per 10,000 SRS households in the local authority. The second is the PRS households on UC with housing costs rate, which indicates, per local authority quarter, the number of PRS households who are on UC and receive housing costs payments, as a rate per 10,000 PRS households in the local authority. These are not cumulative measures throughout each quarter, but rather are based on UC statistics recorded on the second Thursday the middle month of each quarter.
Control variables
The analysis includes three control variables, which attempt to control for housing/labour market factors affecting housing security. They are: (1) model-based unemployment rate, which indicates a quarterly estimate of local authority level unemployment rates (%) from NOMIS labour market statistics, (2) median weekly wages, which is a quarterly estimate of local authority level wages from full/part time work from the Office for National Statistics, and (3) mean weekly rents, which is a quarterly estimate of the amount of rent paid per week in the PRS (from ‘Valuations Office Agency Private Rental Statistics’) and SRS (from MHCLG).
Statistical analysis
The relationship between UC rollout and rent arrears/homelessness advice rates is formally examined using fixed effects panel models. This is a common method for analysing panel data, and measures change over time within local authorities. The key attractive property of using fixed effects regression is that it is able to control for unobserved differences between local authorities (Gayle and Lambert, Reference Gayle and Lambert2018: 61).
The statistical analysis is conducted in three parts, which each relate to one of the three research questions set out at the start of this article. The first part investigates the overall impact of UC rollout, on average within local authorities, up to 2019 Q1. This is as follows:
 $$\eqalign{CAB\ Advice\ Rat{e_{it}} &= {\rm{\;}}{\beta _0} + {\beta _1}UCL{S_{it}} + {\beta _2}UCF{S_{it}} + {\beta _3}Unemploymen{t_{it}}\cr &+{{\beta _4}Wage{s_{it}} + {\beta _5}Rent{s_{it}} + {\beta _6}Quarte{r_t} + {\alpha _{}} + {u_{it}}}} $$
In Equation 1, $CAB{\rm{\;}}Advice{\rm{\;}}Rate$
relates to the outcome variables set out above, whilst
$CAB{\rm{\;}}Advice{\rm{\;}}Rate$
relates to the outcome variables set out above, whilst $UCLS$
is the UC Live Service explanatory variable,
$UCLS$
is the UC Live Service explanatory variable, $UCFS$
is the UC Full Service explanatory variable.
$UCFS$
is the UC Full Service explanatory variable. $i$
is the local authority,
$i$
is the local authority, $t$
is the quarterly time point, and
$t$
is the quarterly time point, and $Unemployment$
,
$Unemployment$
, $Wages$
, and
$Wages$
, and $Rents$
are the three control variables set out above.
$Rents$
are the three control variables set out above. $Quarter$
is the time fixed effects,
$Quarter$
is the time fixed effects, ${\alpha _i}$
is the local authority fixed effects and
${\alpha _i}$
is the local authority fixed effects and ${u_{it}}$
is the error term.
${u_{it}}$
is the error term.
The second part of the analysis investigates whether the impact of UC increases when it has been rolled out for longer and reached more claimants. This is as follows:
 $$\eqalign{CAB\ Advice\ Rat{e_{it}} & = {\beta _0} + {\beta _1}UCFS\ Lengt{h_{it}} + {\beta _2}Unemploymen{t_{it}} \cr &+ {\beta _3}Wage{s_{it}} + {\beta _4}Rent{s_{it}} + {\beta _5}Quarte{r_t} + {\alpha _i} + {u_{it}}} $$
In Equation 2, all variables are the same as those outlined in equation 1, apart from UCFS Length, which is the UC ‘Full Service’ by length of rollout variable.
The third part of the analysis investigates whether the impact of UC varies between the SRS and the PRS. This is as follows:
 $$\eqalign{{CAB\ SRS/PRS\ RA\ Advice\ Rat{e_{it}}} = {\beta _0} + {\beta _1}UCF{S_{it}} + {\beta _2}Unemploymen{t_{it}} \cr &\hskip -255pt+ {{\beta _3}Wage{s_{it}} + {\beta _4}Rent{s_{it}} + {\beta _5}Quarte{r_t} + {\alpha _i} + {u_{it}}}}$$
 $$\begin{gathered}CAB\;SRS/PRS\;RA\;Advice\;Rat{e_{it}} = {\beta _0} + {\beta _1}UCFS\;Lengt{h_{it}} + {\beta _2}Unemploymen{t_{it}} \hfill \\ + {\beta _3}Wage{s_{it}} + {\beta _4}Rent{s_{it}} + {\beta _5}Quarte{r_t} + {\alpha _i} + {u_{it}} \hfill \\ \end{gathered}$$
 $$\begin{gathered}CAB\;SRS/PRS\;RA\;Advice\;Rat{e_{it}} = \;{\beta _0} + \;{\beta _1}SRS/PRS\;HHUC{R_{it}} + \;{\beta _2}Unemploymen{t_{it}} \hfill \\
+ \;{\beta _3}Wage{s_{it}} + \;{\beta _4}SRS/PRS\;Rent{s_{it}} + {\beta _5}Quarte{r_t} + {\alpha _i} + {u_{it}} \hfill \\ \end{gathered} $$
$$\begin{gathered}CAB\;SRS/PRS\;RA\;Advice\;Rat{e_{it}} = \;{\beta _0} + \;{\beta _1}SRS/PRS\;HHUC{R_{it}} + \;{\beta _2}Unemploymen{t_{it}} \hfill \\
+ \;{\beta _3}Wage{s_{it}} + \;{\beta _4}SRS/PRS\;Rent{s_{it}} + {\beta _5}Quarte{r_t} + {\alpha _i} + {u_{it}} \hfill \\ \end{gathered} $$
In Equations 3-5, ‘CAB SRS/PRS RA Advice Rate’ are the rent arrears outcome variables disaggregated by rented sector. ‘SRS/PRS HHUCR’ are the rate of households on UC with housing costs explanatory variables. All other variables are the same as those in Equations 1-2, except $Rents$
, which is disaggregated into SRS and PRS.
$Rents$
, which is disaggregated into SRS and PRS.
Results
Trends in advice rates
Overall trends in mean advice rates are provided in Figures 2 and 3. In Figure 2, trends in advice on mortgage arrears are shown alongside rent arrears, for comparison. All rates tend to vary seasonally (they are lowest in Q2 and Q4 due to office closures for Easter/Christmas holidays, and highest in Q1 due to post Christmas rush of people seeking advice). Unrelated to seasonal fluctuations, there was a slight downward trend in rent arrears and mortgage arrears advice between 2014 Q1 and 2017 Q1 before a subsequent rise until 2019 Q1 (particularly for rent arrears). The actual homelessness advice rate remained fairly constant throughout the analysis period, with just a slight downward trend from 1.98 in 2014 Q1 to 1.42 in 2019 Q1 (per 10,000 households). Meanwhile, there was a downward trend in threatened homelessness advice rate between 2014 Q1 and 2017 Q4, after which this trend reversed.

Figure 2. Quarterly trends in mean rent arrears and mortgage arrears advice rates across 323 English Local Authorities, Q1 2014 – Q1 2019

Figure 3. Quarterly trends in homelessness advice rates across 323 English Local Authorities, Q1 2014 – Q1 2019
Overall impact of Universal Credit rollout
Trends in mean advice rates before and after ‘Full Service’ rolled out within local authorities are plotted in Figures 4 and 5. In these Figures, time is adjusted to be relative to ‘Full Service’ rollout in each local authority. Figure 4 highlights a clear and immediate rise in rent arrears advice rates following ‘Full Service’ rollout. For comparison, it also shows rates of mortgage arrears advice – these should not be impacted by UC as almost all UC housing element claimants live in rented accommodation (DWP, 2018b: 8). Mortgage advice rates follow a very similar trend to rent arrears advice rates before UC ‘Full Service’ rollout but, importantly, this trend continues unaffected after ‘Full Service’ has rolled out. Figure 5 suggests that trends in threatened and actual homelessness advice rates appear to also continue unaffected by UC ‘Full Service’ rollout during the analysis period.

Figure 4. Quarterly trends in mean rent arrears and mortgage arrears advice rates within 323 English Local Authorities, before and after UC ‘full service’ rollout
Notes. Due to UC’s gradual rollout, the sample size of local authorities decreases in the quarters post rollout. Data were available for 323 local authorities in the first quarter post rollout, 272 in the second, 208 in the third, 136 in the fourth, 117 in the fifth and eighty-two in the sixth quarter post rollout.

Figure 5. Quarterly trends in mean homelessness advice rates within 323 English Local Authorities, before and after UC ‘full service’ rollout
Notes. Due to UC’s gradual rollout, the sample size of local authorities decreases in the quarters post rollout. Data were available for 323 local authorities in the first quarter post rollout, 272 in the second, 208 in the third, 136 in the fourth, 117 in the fifth and eighty-two in the sixth quarter post rollout.
The relationship between UC rollout and rent arrears/homelessness advice rates is modelled in Table 3. The results suggest no significant relationship between UC ‘Live Service’ rollout and rent arrears/homelessness advice rates. This is consistent with the results of previous research on UC and housing insecurity (Hardie, Reference Hardie2021), and is most likely because ‘Live Service’ involved a relatively small number of claims and mostly affected those not claiming housing costs. The results do suggest a significant relationship between UC ‘Full Service’ rollout and rent arrears advice rates. ‘Full Service’ rollout was associated with an increase of 2.97 rent arrears advice issues within local authorities (per 10,000 rented dwellings). To put this into context, the mean rate of rent arrears advice issues in the four quarters prior to ‘Full Service’ rollout (2015 Q1 – 2015 Q4) was 26.9 (per 10,000 rented dwellings). Consequently, the 2.97 increase represents around an 11 per cent increase on pre rollout rates. No significant relationship was found between UC rollout and rates of actual or threatened homelessness advice issues.
Table 3 Relationship between UC Rollout and rent arrears/homelessness advice rates within 323 English Local Authorities, 2014 Q1 - 2019 Q1.

Notes. Driscoll-Kraay standard errors shown in brackets under coefficients. All models include local authority and (quarterly) time fixed effects. Rent arrears advice rate is per 10,000 rented dwellings in the local authority, whilst both homelessness advice rates are per 10,000 households in the local authority. Median weekly wages includes both part-time and full-time work. +p<0.10, *p<0.05, **p<0.01, ***p<0.001.
Impact by length of Universal Credit rollout
The relationship between UC rollout (by rollout length) and advice rates is modelled in Table 4. Broadly, the results suggest the impact of UC ‘Full Service’ on rent arrears advice rates does tend to increase the longer it has been rolled out. It is associated with an increase of 1.65 rent arrears advice issues in the first quarter post rollout, rising to 2.81 in the second quarter post rollout, 4.77 in the third quarter post rollout and finally (after a slight fall) 4.84 in the sixth quarter post rollout. In line with the results from Table 3, no clear significant relationship was found between UC rollout and rates of threatened/actual homelessness advice.
Table 4 Relationship between UC rollout, by rollout length, and rent arrears/homelessness advice rates within 323 English Local Authorities.

Notes. Driscoll-Kraay standard errors shown in brackets under coefficients. All models include local authority and (quarterly) time fixed effects. Rent arrears advice rate is per 10,000 rented dwellings in the local authority, whilst both homelessness advice rates are per 10,000 households in the local authority. Median weekly wages includes both part-time and full-time work. +p<0.10, *p<0.05, **p<0.01, ***p<0.001.
Impact on rent arrears advice rates in the social versus private rented sector
To investigate any variation in UC’s impact between the SRS and the PRS, the analysis was repeated with rent arrears advice rates disaggregated by sector. In Figure 6, quarterly trends in mean advice rates across the 323 English local authorities are plotted relative to the timing of UC rollout. Rent arrears advice rates are, in general, much higher in the SRS than in the PRS, and whilst rent arrears advice rates rose in both sectors following ‘Full Service’ rollout, this was more pronounced in the SRS.

Figure 6. Quarterly trends in mean rent arrears advice rates in the social and private rented sectors within 323 English Local Authorities, before and after UC ‘full service’ rollout
Notes. Due to UC’s gradual rollout, the sample size of local authorities decreases in the quarters post rollout. Data were available for 323 local authorities in the first quarter post rollout, 272 in the second, 208 in the third, 136 in the fourth, 117 in the fifth and eighty-two in the sixth quarter post rollout.
These relationships are modelled in Tables 5 and 6. To ease interpretation and comparison, the coefficients from Table 6 are also shown graphically alongside the coefficients from Table 4 in Figure 7. The results from Table 5 suggest that up to 2019 Q1, UC ‘Full Service’ rollout was, on average, associated with an increase of 5.24 rent arrears advice issues in the SRS and 0.96 rent arrears advice issues in the PRS (per 10,000 rented dwellings in sector). Given that the mean rent arrears advice rates in the pre-UC ‘Full Service’ rollout period (2015 Q1 – 2015 Q4) were 44.05 in the SRS (per 10,000 social rented dwellings) and 12.17 in the PRS (per 10,000 private rented dwellings), these coefficients correspond to approximately a 12 per cent increase in SRS rent arrears advice rates and a 8 per cent increase in PRS rent arrears advice rates. Furthermore, the results from Table 6 and Figure 7 suggest that the impact of UC rollout on rent arrears advice rates increased in the SRS the longer that UC had rolled out, but did not clearly in the PRS.
Table 5 Relationship between UC rollout and rent arrears advice rates in the social vs. private rented sectors within 323 English Local Authorities, 2014 Q1 - 2019 Q1.

Notes. Driscoll-Kraay standard errors shown in brackets under coefficients. All models include local authority and (quarterly) time fixed effects. SRS rent arrears advice rates are per 10,000 social rented dwellings in the local authority. PRS rent arrears advice rates are per 10,000 private rented dwellings in the local authority. Median weekly wages includes both part-time and full-time work. +p<0.10, *p<0.05, **p<0.01, ***p<0.001.
Table 6 Relationship between UC rollout, by rollout length, and rent arrears advice rates in the social vs. private rented sectors within 323 English Local Authorities, 2014 Q1 - 2019 Q1

Notes. Driscoll-Kraay standard errors shown in brackets under coefficients. All models include local authority and (quarterly) time fixed effects. SRS rent arrears advice rates are per 10,000 social rented dwellings in the local authority. PRS rent arrears advice rates are per 10,000 private rented dwellings in the local authority. Median weekly wages includes both part-time and full-time work. +p<0.10, *p<0.05, **p<0.01, ***p<0.001.

Figure 7. Relationship between UC ‘Full Service’ rollout on rent arrears advice rates within 323 English Local Authorities, by rollout length, 2014 Q1 – 2019 Q1
Notes. Point estimates are derived from coefficients in regression models in Tables 2 and 4. Vertical bars represent 95 per cent confidence intervals. Coefficients are less precise in quarters further post rollout (exemplified by wider confidence intervals) due to decreasing sample size of local authorities.
A key limitation of using the timing of UC rollout as the explanatory variable here is that this measure does not take into account that the rate at which households move onto UC (with housing costs) is slightly higher in the SRS than the PRS (see supplementary material: Appendix 2). This means that the greater impact observed in the SRS may potentially be partly due to the SRS having a higher rate of households on UC (with support for housing costs). In order to account for this, the analysis was repeated using the rate of households on UC (with housing costs), in each sector, as the explanatory variables. The results are set out in Table 7. They suggest that every 100 additional households (in sector) on UC with housing costs are associated with a 0.43 increase in SRS rent arrears advice issues and a 0.18 increase in PRS rent arrears advice issues (per 10,000 households in sector). To put this into context, the mean rates of households on UC with housing costs by 2019 Q1 were 1000.65 in the SRS (per 10,000 SRS households) and 843.68 in the PRS (per 10,000 PRS households) (see supplementary material: Appendix 2). This means that the coefficients in Table 7 correspond to around 4.3 additional rent arrears advice issues in the SRS (per 10,000 SRS households) and 1.52 additional rent arrears advice issues in the PRS (per 10,000 PRS households) in an average local authority. These estimates differ slightly from those in Table 5. However, in general they back up the results: in that they again suggest that UC rollout was associated with increased rent arrears advice rates in the SRS and PRS but that the impact was greater in the SRS.
Table 7 Relationship between households on UC with housing costs rate and rent arrears advice rates in the social and private rented sectors within 323 English Local Authorities, 2015 Q3 - 2019 Q1.

Notes. Driscoll-Kraay standard errors shown in brackets under coefficients. All models include local authority and (quarterly) time fixed effects. The households on UC with housing costs rate is per 10,000 SRS dwellings in model 1 and per 10,000 PRS dwellings in model 2. SRS rent arrears advice rates are per 10,000 social rented dwellings in the local authority. PRS rent arrears advice rates are per 10,000 private rented dwellings in the local authority. Median weekly wages includes both part-time and full-time work. +p<0.10, *p<0.05, **p<0.01, ***p<0.001.
Falsification test
To test the validity/specificity of the above results, a falsification test was carried out using the mortgage advice rate as a non-equivalent outcome variable (similar to that conducted in other similar studies, e.g. Hardie, Reference Hardie2021). A non-equivalent outcome variable is expected to respond to some or all of the contextually important internal validity threats as the main outcome variable, but, importantly, should not be impacted by the treatment of interest (Shadish et al., Reference Shadish, Cook and Campbell2002). Here, the mortgage advice rate makes a suitable non-equivalent outcome variable as it is impacted by the same housing/labour market factors as rent arrears but should not be impacted by UC rollout as almost all UC claimants receiving housing costs support live in rented accommodation (DWP, 2018b: 8). The results of the falsification test are provided in the supplementary material: Appendix 3. No significant relationship was found between UC rollout and the Citizens Advice mortgage advice rate, which suggests it is unlikely the results of the main analysis are due to confounding.
Discussion
UC represents a major change to the UK’s welfare system. Whilst some of its principles – particularly its attempt to simplify the welfare system – have been widely supported, it has a number of design features which have been problematic for housing security. In particular, a number of qualitative research studies (e.g. Britain Thinks, 2018; Wright et al., Reference Wright, Dwyer, Jones, McNeill, Scullion and Stewart2018; Bush et al., Reference Bush, Templer and Allen2019; Cheetham et al., Reference Cheetham, Moffatt, Addison and Wiseman2019; Robertson et al., Reference Robertson, Wright and Stewart2020) have highlighted the detrimental impact of: (a) UC’s long wait periods, which can leave claimants without money for rent whilst waiting for the first payment; (b) UC’s increased use of conditionality/sanctions, which can reduce claimants income and force them to cut back spending on housing costs; and (c) UC’s system of, by default, paying housing costs directly into claimants’ own bank account, which can result in arrears amongst claimants who prioritise other essential costs over rent.
The research outlined in this article backs up these qualitative studies in further highlighting the detrimental impact of UC rollout on housing insecurity, through making use of Citizens Advice ‘advice trends’ data. This study also builds on some of the limitations of existing quantitative studies on UC’s housing insecurity impacts, which have tended to be limited to specific local areas (e.g. Smith Institute, 2017, 2019) or have been unable to disaggregate the impact of UC between the SRS and PRS (Hardie, Reference Hardie2021). The results suggest that UC ‘Full Service’ rollout, on average, was associated with an increase of 2.97 rent arrears advice issues within English local authorities by 2019 Q1 (per 10,000 rented dwellings). This represents an 11 per cent increase on rent arrears advice rates pre ‘Full Service’ rollout. UC’s impact on rent arrears advice rates tended to be greater where it had been rolled out for longer (and therefore affected more claimants). For example, when ‘Full Service’ had been rolled out for six or more quarters it was associated with an increase of 4.84 rent arrears advice issues (per 10,000 rented dwellings), which is an 18 per cent increase on pre rollout rates. Finally, the results suggest that UC’s housing insecurity impacts have been particularly detrimental to the social rented sector.
Whilst this study found a significant relationship between UC rollout and rent arrears advice issues, it did not find any evidence of a significant relationship between UC rollout and homelessness advice issues. This suggests that whilst UC is associated with financial problems and arrears, cases were being resolved before the most extreme forms of housing insecurity arise, e.g. due to Citizens Advice supporting clients out of arrears, or due to other protective barriers, such as social support networks (see Bramley and Fitzpatrick, Reference Bramley and Fitzpatrick2018). However, it should be noted that this research was limited to data up to 2019 Q1, so does not provide insight into the potential longer-term impacts of UC rollout on homelessness.
Whilst the research outlined in this article was able to use a robust methodology by exploiting the staggered nature of UC rollout to measure its impact, there are some limitations. Firstly, using local authority level data creates potential for ecological fallacy. Secondly, the most common way of receiving advice from Citizens Advice during the analysis period was face-to-face. Therefore, people who have better access to Citizens Advice offices are more likely to approach them. However, the use of local authority fixed effects in the analysis should control for this and avoid bias unless there were new Citizens Advice offices opened up in new areas as a direct result of UC being introduced. Finally, the rent arrears advice rates used in the analysis do not provide information on the severity of rent arrears (e.g. the size of arrears) and some people who received rent arrears advice may not actually have arrears but instead may be worried about falling in arrears. Nevertheless, it remains a novel and useful indicator of the likely scale of rent arrears and housing insecurity more broadly.
The findings of this study have a number of implications for UC claimants and for landlords. Firstly, the negative impact of UC on rent arrears advice issues suggests that UC rollout has had a detrimental impact on the household finances of claimants. UC claimants who are facing rent arrears may be forced to cut back spending on food/bills to pay off arears. This is likely to have contributed to the increased rates of food bank use observed throughout the rollout of UC (Thompson et al., Reference Thompson, Jitendra and Rabindrakumar2019; Reeves and Loopstra, Reference Reeves and Loopstra2021). Secondly, housing insecurity is a key determinant of poor mental health (Reeves et al., Reference Reeves, Clair, McKee and Stuckler2016; Preece and Bimpson, Reference Preece and Bimpson2019), and consequently UC’s housing insecurity impacts are likely to have contributed to negative mental health outcome that have been linked to UC rollout (Wickham et al., Reference Wickham, Bentley, Rose, Whitehead, Taylor-Robinson and Barr2020).
With regards to landlords, increased rent arrears associated with UC will reduce their incomes. The DWP have introduced safeguards like Alternative Payment Arrangements (APAs) to give claimants who require additional support the option of receiving payment of housing costs to their landlord rather than to their own bank account, or to receive more frequent payments (in Scotland these are also available through UC ‘Scottish Choices’). However, rent arrears associated with UC have still caused landlords to lose income (Hickman et al., Reference Hickman, Pattison and Preece2018; Simcock, Reference Simcock2018), and the findings of this study suggest that this problem is greatest in the social rented sector.
In policy terms, the analysis outlined in this article were unable to distinguish between the impacts of different design features of UC. However, when considered alongside the results of existing qualitative studies (e.g. Britain Thinks, 2018; Wright et al., Reference Wright, Dwyer, Jones, McNeill, Scullion and Stewart2018; Bush et al., Reference Bush, Templer and Allen2019; Cheetham et al., Reference Cheetham, Moffatt, Addison and Wiseman2019; Robertson et al., Reference Robertson, Wright and Stewart2020) the findings highlight a need to address some of UC’s design features which are most likely to have contributed to housing insecurity. Firstly, there is a need to end UC’s long wait period for the first payment, e.g. by making advance payments non-repayable and available to all claimants, or by giving all claimants a two-week initial grant as suggested by House of Lords Economic Affairs Committee (2020). This would help claimants to avoid rent arrears at the start of their UC claim. Secondly, there is a need to reduce the severity of benefit sanctions to ensure that claimants are not placed at risk of arrears. Importantly, research carried out during the COVID-19 pandemic suggests that the temporary suspension of conditionality and sanctions led to claimants finding it easier to manage financially (Edmiston et al., Reference Edmiston, Robertshaw, Gibbons, Ingold, Baumberg Geiger, Scullion, Summers and Young2021). Finally, the value of UC payments will play an important role in determining the housing security of claimants. The UC standard allowance was temporarily uplifted by £20 per week during the COVID-19 pandemic, and qualitative research suggests that this helped claimants but even with the uplift the value of UC was still inadequate to prevent arrears (Summers et al., Reference Summers, Scullion, Baumberg Geiger, Robertshaw, Edmiston, Gibbons, Karagiannaki, De Vries and Ingold2021). Whilst measures recently announced by the government to reduce UC’s taper rate will help working claimants, this is outweighed by the negative impacts of the ending of the £20 uplift (Bell et al., Reference Bell, Brewer, Cominetti, Handscomb, Henehan, Judge, Leslie, Marshall, Shah, Smith, Tomlinson and Try2021). Reinstating the £20 uplift and increasing it further would help protect UC claimants from rent arrears.
Supplementary material
To view supplementary material for this article, please visit https://doi.org/10.1017/S1474746422000379.
Acknowledgements
This research was conducted as part of a PhD thesis and was funded by the Economic and Social Research Council (ESRC) (grant number: ES/P000681/1). I would like to thank Nick Bailey and Ken Gibb for their excellent supervision and support throughout the PhD. I would also like to thank the Citizens Advice data team for their help and support in accessing the data used in this analysis.


 Open access