


This article is concerned with the prevalence of rare autosomal dominant disorders that are maintained in the population by the opposing forces of mutation and selection. Neurofibromatosis type 1 or NF1 (OMIM # 162200) is used to give a concrete basis to the calculations here developed. NF1 is a fairly well-known condition in the literature of medical genetics; comprehensive reviews are found in the articles by Ferner (Reference Ferner2010) and Jouhilahti et al. (Reference Jouhilahti, Peltonen, Heape and Peltonen2011). Updated summaries of clinical and genetic — formal as well as molecular — aspects of NF1 are found in the www OMIM database (https://www.omim.org/) mentioned above.
Poyhonen et al. (Reference Poyhonen, Kytola and Leisti2000) cite several studies of NF1, quoting various estimates of prevalence, incidence and mutation rate. Their findings are employed to illustrate the model given below.
Many other traits apart from NF1 could be included in the scope of the model of occurrence presented here. The main object of the paper is to describe a simple model incorporating random elements to convey some impression of the level of variability in the prevalence of an inherited disorder. The model could be used in an experimental way to try various combinations of parameter values to match the output against observations. The outline of the model is given in the next section and a realization in the following section, followed by some discussion.
The Model
The object is to chart the numbers affected over a sequence of time points separated by short intervals of time, in this study, weeks. The number of cases, denoted by A, is replenished by mutation that randomly compensates for the loss of cases. The prevalence of the trait is controlled by parameters b (b > 0) and d (d > 0). The number with the trait (A) depends on the size (S) of the source population, the reproduction rate (r) and the mutation rate (m). The balance between selective loss and mutational gain is expressed by the equation
 $$2Srm + Arb/2 = Ard,$$
(1)
$$2Srm + Arb/2 = Ard,$$
(1)
whose solution leads to equilibrium
 $$\tilde{A}=\frac{4Sm}{2d-b}.$$
(2)
$$\tilde{A}=\frac{4Sm}{2d-b}.$$
(2)
In Eq. (1), the rates of reproduction of cases b and removal d are measured against the general population reproduction rate r together with condition 2d – b > 0. As shown in Eq. (1), reproduction and removal are proportional to r. The possible coincidence of birth and death among those with the trait is ignored, as is the possibility of a new mutant among the offspring of those with the trait.
In equilibrium, the expected number of individuals with the trait contributed by transmission from possessors in each year is Ãrb/2. The expected number of mutants is 2Srm, and the expected net number of removals per year is Ãrd — Ãrb/2. The expected proportion of incident cases contributed by mutation is
 $$\tilde{M} = {{2d - b} \over {2d}}.$$
(3)
$$\tilde{M} = {{2d - b} \over {2d}}.$$
(3)
In equilibrium, the incidence of the trait is equal to the number of deaths, so the incidence rate is
 $$\tilde{I} = {\tilde{A}rd \over {Sr}} = {{4Smd} \over {(2d - b)S}} = {{4md} \over {2d - b}}.$$
(4)
$$\tilde{I} = {\tilde{A}rd \over {Sr}} = {{4Smd} \over {(2d - b)S}} = {{4md} \over {2d - b}}.$$
(4)
The product of (3) and (4) gives the rate due to mutation:
 $$\tilde{I} \cdot \tilde{M} = 2m.$$
(5)
$$\tilde{I} \cdot \tilde{M} = 2m.$$
(5)
Equation (5) suggests that m could be estimated indirectly from the incidence of the trait combined with the proportion of nonfamilial cases.
The expected prevalence of the trait expressed as a proportion of the population is
 $$\tilde{N} = {\tilde{A} \over S} = {{4m} \over {2d - b}}.$$
(6)
$$\tilde{N} = {\tilde{A} \over S} = {{4m} \over {2d - b}}.$$
(6)
A simulation is made by choosing an arbitrary number of cases A 0 to start the time series. The process proceeds week by week: a random number of mutants, which may be zero, is generated by choosing a random number from the Poisson distribution whose mean is 2Srwm, where w is the fraction of a year taken up by a week; from the current number of cases A, a number of births inheriting the trait are chosen from the binomial distribution with a number of ‘trials’ A and probability of ‘success’ rwb/2; the number of deaths among cases is chosen from the binomial distribution with a number of trials A and probability of success rwd. The number of cases is then updated by adding to A the number of mutants and inherited cases and subtracting the number of deaths from among the cases. The process is repeated for the desired number of weeks.
In order to apply the model to a particular condition, such as NF1, it is necessary to provide the estimates of the parameters S, r, m, b and d. The population size and reproduction rate come from national vital statistics. Exploiting the formulae given above, rough estimates of d and b can be formed successively as
 $${\hat{d}} = 2m/(\tilde{M} \times \tilde{N}\,\,)$$
(7)
$${\hat{d}} = 2m/(\tilde{M} \times \tilde{N}\,\,)$$
(7)
and
 $${\hat{b}} = 2{\hat d }\,(1 - \tilde{M}\,\,).$$
(8)
$${\hat{b}} = 2{\hat d }\,(1 - \tilde{M}\,\,).$$
(8)
Obviously, there is some circularity in the following reasoning, and with some rounding, but taking the report of Poyhonen et al. (Reference Poyhonen, Kytola and Leisti2000) (prevalence of NF1: 1 in 4436; proportion due to de novo mutation: 0.4; mutation rate per gamete: 5/100,000, gives ${\hat d } = 1.1$
and
${\hat d } = 1.1$
and ${\rm{}}{\hat b} = 1.3$
). Taking the base population S = 733,037 and substituting in formula (2) give prevalence à = 163, that is, 1 in 4497.
${\rm{}}{\hat b} = 1.3$
). Taking the base population S = 733,037 and substituting in formula (2) give prevalence à = 163, that is, 1 in 4497.
Realization of the Model
The key findings of Poyhonen et al. (Reference Poyhonen, Kytola and Leisti2000) were used to simulate changes in the numbers affected. The population size quoted by Poyhonen et al. was used. The mutation rate was taken to be 5 × 10⁻⁵ together with d (1.1) and b (1.3), giving expected prevalence of about 163 affected individuals. The model was simulated over a period of 1000 years, starting with 165 individuals with the trait. We assume a gross reproduction rate of 15 births per thousand inhabitants per year. This figure is similar to that reported by Evans et al. (Reference Evans, Howard, Giblin, Clancy, Spencer, Huson and Lalloo2010) from their study of north-west England over a 50-year period. Some of the key outcomes are independent of the rate of reproduction.
In the virtual population, the expected number of births per year is 10,996. Taking the mutation rate per gamete as 5/100,000 gives an expected number of mutant individuals per year 1.10. Using the expected number with the trait (163), the expected number inheriting NF1 per year is 1.59 and the number with the trait dying per year is 2.69. In the simulation, the numbers (in 1000 years) were, respectively, 1128, 1657 and 2757. The median number with the trait was 165. The expected proportion of sporadic cases is 0.409. The simulated percent was 40.9%. Poyhonen et al. (Reference Poyhonen, Kytola and Leisti2000) write: ‘It can be estimated that three new NF1 children will be born in the area annually’. The virtual picture agrees well with the actual.
Figure 1 depicts the number with the trait over a 5-year interval, displaying typical variation in prevalence from week to week. A year is composed of 52 seven-day weeks. Figure 2 displays the empirical stationary distribution, ranging from 125 to 201, which gives an impression of the states occupied by the numbers affected over the period of 1000 years. The fitted curve is of the negative binomial distribution with parameters k = 1244.8 and p = .8831. From observation, it may not be a good choice, although initially appealing. The median number of the distribution in Figure 2 is 165, compared to prediction 163.
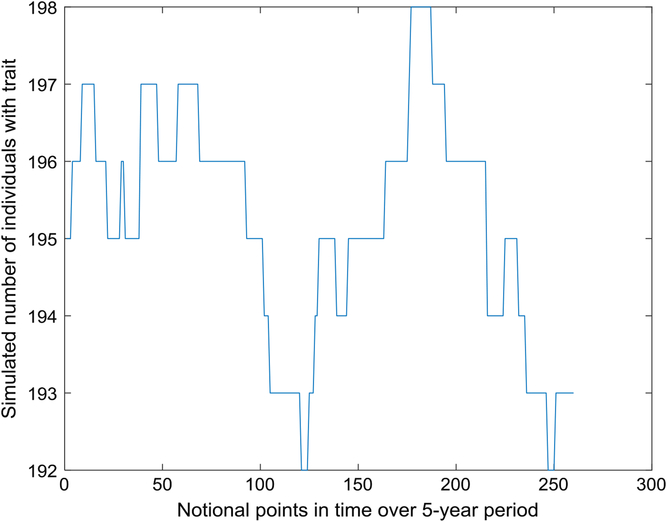
Fig. 1. Part of time series of simulated number of individuals with trait (S = 733,037, m = 5 × 10⁻⁵, b = 1.3, d = 1.1).
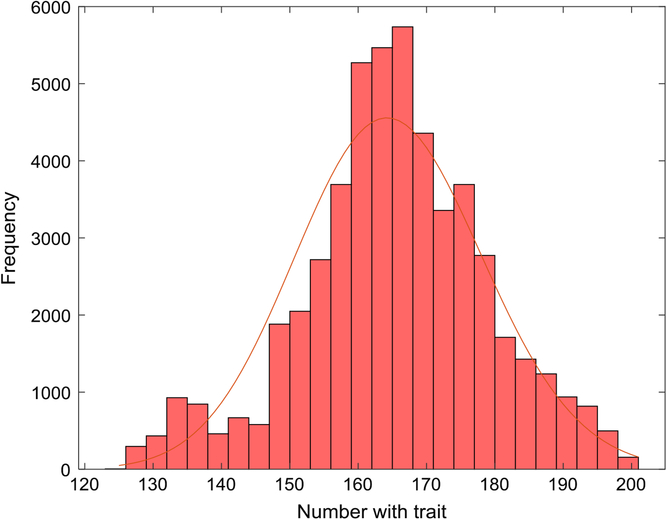
Fig. 2. Empirical stationary distribution of number of individuals with trait (S = 733,037, m = 5 × 10⁻⁵, b = 1.3, d = 1.1) and fitted negative binomial distribution.
Table 1 gives the empirical frequencies of changes (‘jumps’) in A from week to week over 1000 years. The mean of the distribution of changes is less than 0.001 and the variance is 0.1063. The theoretical variance is approximately
 $$2Srwm + \tilde{A}\,(rwb/2)(1 - rwb/2) + \tilde{A}\,rwd(1 - rwd).$$
(9)
$$2Srwm + \tilde{A}\,(rwb/2)(1 - rwb/2) + \tilde{A}\,rwd(1 - rwd).$$
(9)
Table 1. Simulated frequencies of changes in prevalence from week to week over 1000 years.

Using the values of parameters given above yields estimated variance of 0.1031.
Discussion
The extensive literature on NF contains many varying estimates of fitness of bearers of NF, of incidence, prevalence, de novo proportions and mutation rates. There is also the difficulty of identifying which type of NF a patient may have. Simulation is one way of exploring the epidemiology of such a trait by trial and error, even if the assumptions made gloss over details. For example, no account is taken here of the age or sex of affected individuals or germinal mutation rates in males and females separately.
Jouhilahti et al. (Reference Jouhilahti, Peltonen, Heape and Peltonen2011) write:
Mild forms of NF1 can be caused by mosaicism, a situation in which the NF1 mutation occurs after fertilization. Somatic mutations occurring early during embryonic development produce generalized mosaicism, which is characterized by a mild disease indistinguishable from classic NF1. Mutations occurring at a later stage of embryonic development result in segmental NF1, where manifestations are restricted to one segment of the body. Gonadal mosaicism is a rare form of mosaicism, the mutation is present only in the gonads, and it can be suspected if two or more children of unaffected parents have NF1. (p. 1933)
Samuelsson and Åkesson (Reference Samuelsson and Åkesson1988) estimated the relative fertility of NF1 patients to be 78% and the mutation rate ‘somewhere between 2.4 and 4.3 × 10⁻⁵’ (p. 169). They made an indirect estimate of mutation rate using the formula
 $$m = 0.5(1 - f)P$$
where m is the mutation rate per gene per generation, f is the relative fertility and P is the prevalence of the disease.
Applying the formula, they obtained the estimate:
 $$m = 0.5(1 - 0.78) \times 1/4600 = 2.4 \times {10^{ - 5}}.$$
The original survey of 74 adult patients in Gothenburg (Sweden), believed to be exhaustive, was done by the first author (Samuelsson). Details are given about children of patients (45% were childless) and marital status (47% were married or cohabiting).
Huson et al. (Reference Huson, Compston, Clark and Harper1989) ascertained cases of NF1 in south-east Wales during the period from October 1983 to February 1986. Detailed descriptions of the patients are given in an earlier paper (Huson et al., Reference Huson, Harper and Compston1988). In the later article, the authors estimated mean fitness of individuals with NF1 to be 0.47. Relative fitness was calculated as the ratio of proportion of parents of index cases who are affected and the proportion of children of index cases who are affected. Fitness unity is obtained when these proportions are the same. An arbitrary formula with some desirable properties is
 $${\hat f} = {1 \over 4}\left( {b + {2 \over d}} \right).$$
(10)
$${\hat f} = {1 \over 4}\left( {b + {2 \over d}} \right).$$
(10)
Taking b = 1.3 and d = 1.1 in (10) yields ${\hat f } = 0.78$
; using b = 2 and d = 1 gives
${\hat f } = 0.78$
; using b = 2 and d = 1 gives ${\hat f } = 1.$
However, Eq. (10) does not yield an estimate of mutation rate consistent with that given by Samuelsson and Åkesson (Reference Samuelsson and Åkesson1988), but a correction leads to the estimate of fitness:
 $$\tilde{f} = 1 - d + b/2.$$
(11)
$$\tilde{f} = 1 - d + b/2.$$
(11)
If d is a known fixed quantity, $\tilde{f}$
is a linear function of b. For example, if d = 6/5 and b = 7/4,
$\tilde{f}$
is a linear function of b. For example, if d = 6/5 and b = 7/4, $\tilde{f} = 27/40 = 0.675$
, and this value could be used in the formula of Samuelsson and Åkesson (Reference Samuelsson and Åkesson1988).
$\tilde{f} = 27/40 = 0.675$
, and this value could be used in the formula of Samuelsson and Åkesson (Reference Samuelsson and Åkesson1988).
Evans et al. (Reference Evans, Howard, Giblin, Clancy, Spencer, Huson and Lalloo2010) give a succinct summary of data on five dominantly inherited ‘tumor-prone’ syndromes: NF1, NF2, Gorlin syndrome, familial adenomatous polyposis and von Hippel Lindau disease. The data were obtained from genetic and cancer registries maintained in the Manchester region, north-west England, over the period 1953–2003. Here, we extract some highlights relating to NF1 only. In the population of 4.1 million people, there were 899 cases of NF1 alive in 2008 — a prevalence rate of 1/4560. In their summary, Evans et al. make some arbitrary choices of summary statistics, as we do in what follows.
The data are given in five 10-year periods. In 50 years, there were 3,050,409 births, a gross birth rate of approximately 14.88 per 1000 persons per year. From their summary, we estimate that there were, respectively, 41, 51, 64, 64 and 61 in all 281 inherited cases over that period. If the birth rate of the general population (14.88) is applied to the NF1 cases (899), the predicted number of inherited cases would be 334, bearing in mind that the probability of transmitting the gene is ½. So, the relative rate of transmission is approximately 281/334 = 0.85. The corresponding value of b is 1.7. This is much higher than the value estimated from the data obtained in Finland, as detailed in the previous section.
In the section on methodology Evans et al. (Reference Evans, Howard, Giblin, Clancy, Spencer, Huson and Lalloo2010) write: ‘All deceased cases were confirmed, if possible, either from medical records, cancer registry data, or death certificates’ (p. 328). In results: ‘There were 539 families containing 979 affected individuals with NF1’. As noted below, the first of these quotations is important because it is not clear how complete is the record of the number of deaths among cases identified over the 50-year period of observation.
Evans et al. (Reference Evans, Howard, Giblin, Clancy, Spencer, Huson and Lalloo2010, p. 329) state: ‘For those with dates of birth after December 31, 1952; 39/819 (4.8%) of those with NF1 have died’. They point to a comparison: ‘The death rates expected from the general population for a matched group can be found in Table I’. The estimate given there is 13.15. In the Methods section, the authors state that all deceased cases were confirmed. The quotation in the Methods section of Evans et al. would suggest that only 39 deaths occurred among all cases ascertained over the 50-year period. It is not obvious how to interpret this. If deaths occur at the same rate as births, as would be assumed for a stable population, in the final few years of the 50-year period, we estimate that the expected number of deaths from the case numbers given in Table I of Evans et al. would be more than 200 out of 819.
Evans et al. (Reference Evans, Howard, Giblin, Clancy, Spencer, Huson and Lalloo2010) estimate the de novo proportion of NF1 cases to be 42%. From their summary, we estimate that there were, respectively, 81, 126, 114, 142 and 75 in all 538 newly mutant cases over 50 years, that is, on average 10.76 per year. At a birth rate of 14.88 per 1000, 4.1 million people transmit 122,016 chromosomes per year, with a mutation rate approximately 8.8 ×10⁻⁵. In their Table III, they give mutation rate as 10 × 10–5, with a median age at diagnosis of de novo cases as 9.5 years and of familial cases as 5 years.
Substituting S = 4,100,000, m = 8.8 ×10⁻⁵, b = 0.91, d = 1.26 in Eq. (2) gives à = 896, which is consistent with the prevalence given by Evans et al. (Reference Evans, Howard, Giblin, Clancy, Spencer, Huson and Lalloo2010). The corresponding fitness is ${\rm{}}{\hat f } = 0.624$
. Taking r = 15/1000, Ã = 896 and the above values of b and d, the predicted mean number of mutant NF1 cases per year is 10.82, the number of inherited affected individuals per year is Ãrb/2 = 6.12, and the predicted number of deaths of affected individuals is Ãrb = 16.93. These predictions agree closely with the numbers reported by Evans et al.
${\rm{}}{\hat f } = 0.624$
. Taking r = 15/1000, Ã = 896 and the above values of b and d, the predicted mean number of mutant NF1 cases per year is 10.82, the number of inherited affected individuals per year is Ãrb/2 = 6.12, and the predicted number of deaths of affected individuals is Ãrb = 16.93. These predictions agree closely with the numbers reported by Evans et al.
Evans et al. (Reference Evans, O’Hara, Wilding, Ingham, Howard, Dawson and Huson2011) wrote:
The current study has shown that most of the excess mortality in NF1 exists before 50 years of age and that NF1 does not clearly contribute to more than a small minority of deaths after that age. Therefore individuals living beyond 50 years without a serious NF1 complication could expect to live a near normal life expectancy. (p. 1191)
James V. Neel (Reference Neel1994, p. 214) summarizes his work on mutation and human disease. He writes: ‘… multiple neurofibromatosis … Even today, although the gene involved has now been identified, neurofibromatosis remains a poorly understood disease … Although they only rarely develop into a cancer, the tumors are disfiguring and can cause difficulties as they expand’. He gives an estimate of mutation rate — between 14 and 16 events per 100,000 germ cells — ‘the highest yet reported for any human condition’. He says also that this estimate may be too high.
Morton (Reference Morton1982, p. 152) gives a table of estimated dominant mutation rates. The rate for NF is 73 ×10–6, exceeded only by that of polycystic disease of kidneys (92 × 10–6).
Ferner (Reference Ferner2010) writes: ‘Genetic counselling is advised for everyone with NF1 before they attempt to have children; both prenatal mutation testing and pre-implantation genetic diagnosis are available’ (p. 91). She notes that neurofibromin acts as a tumor suppressor ‘which explains why NF1 patients are prone to developing benign and malignant tumours’. Perhaps because she is concerned with practical outcomes, she says little more about the mechanism of gene action such as a two-hit model.
If Ferner’s advice is taken, it can be expected that the incidence of NF1 will fall so that some adjustments would need to be made to the static model presented here.
Acknowledgment
I thank a reviewer for advice on how to improve the manuscript.


