


Introduction
Glufosinate can be applied POST in crops with a glufosinate-resistance trait, including: LibertyLink® soybean and cotton, Enlist™ soybean and cotton, Bollgard® II XtendFlex® cotton, and LibertyLink® GT27® soybean. Glufosinate will control a broad spectrum of grass and broadleaf weeds, and the utilization of various technologies with glufosinate-resistant traits will probably increase the use of glufosinate POST in the coming years. As a single application of glufosinate is not always enough to control emerged grasses (Culpepper et al. Reference Culpepper, York, Batts and Jennings2000; Meyer et al. Reference Meyer, Norsworthy, Stephenson, Bararpour, Landry and Woolan2015b), a detailed investigation on the performance of glufosinate in mixtures on common, hard-to-control grass weeds in the Midsouth United States is needed. Four common and troublesome grass weeds in this region are barnyardgrass, broadleaf signalgrass, large crabgrass, and johnsongrass (Webster Reference Webster2012, Reference Webster2013).
Many herbicides (e.g., glyphosate, clethodim, sethoxydim, and quizalofop) are available for use in soybean and cotton that provide adequate control of barnyardgrass and other troublesome grass species (Culpepper et al. Reference Culpepper, York, Batts and Jennings2000; Jordan Reference Jordan1995; Scott et al. Reference Scott, Barber, Boyd, Seldon, Norsworthy and Burgos2015; Sikkema et al. Reference Sikkema, Shropshire, Hamill and Cavers2005; Vidrine et al. Reference Vidrine, Reynolds and Blouin1995); however, these herbicides must be managed appropriately to minimize the risk of evolving further resistance. Barnyardgrass has been positively identified as resistant to nine sites of action globally, seven of those in southern U.S. states, with several instances of multiple resistance (Heap Reference Heap2019). Large crabgrass populations with resistance to various acetolactate synthase–, acetyl CoA carboxylase–, and photosystem II–inhibiting herbicides have been documented (Heap Reference Heap2019). Glyphosate-resistant johnsongrass populations were identified in 2007 in Arkansas, in 2008 in Mississippi, and in 2010 in Louisiana (Heap Reference Heap2019; Riar et al. Reference Riar, Norsworthy, Johnson, Scott and Bagavathiannan2011), requiring alternative herbicides for adequate control.
In a crop with a glufosinate-resistant trait, sequential applications of glufosinate, mixtures, or a PRE followed by a POST herbicide program, is needed to provide adequate control of johnsongrass (Johnson et al. Reference Johnson, Norsworthy and Scot2014a; Johnson and Norsworthy Reference Johnson and Norsworthy2014; Meyer et al. Reference Meyer, Norsworthy, Stephenson, Bararpour, Landry and Woolan2015b). Similarly, a PRE followed by POST application of glufosinate or sequential applications of glufosinate was needed to control broadleaf signalgrass in glufosinate-resistant soybean (Culpepper et al. Reference Culpepper, York, Batts and Jennings2000). As mixing glufosinate with another effective graminicide is needed in a glufosinate-tolerant crop system to provide adequate control of troublesome grass weeds, utilizing effective mixtures is a critical component of resistance management (Norsworthy et al. Reference Norsworthy, Ward, Shaw, Llewellyn, Nichols, Webster, Bradley, Frisvold, Powles, Burgos, Witt and Barrett2012).
Unfortunately, some mixtures containing glufosinate have been reported as antagonistic, meaning that the benefit of applying two effective sites of action may not provide the control that would be expected. Colby (Reference Colby1967) defined antagonism as a result of applying two herbicides in combination that is less than what would be expected based on how the individual herbicides perform alone. Gardner et al. (Reference Gardner, York, Jordan and Monks2006) determined that glufosinate antagonized the activity of clethodim on a mixed population of annual grass species: large crabgrass and fall panicum (Panicum dichotomiflorum Michx.). Antagonism has been observed between glufosinate and clethodim on goosegrass (Eleusine indica L.) (Burke et al. Reference Burke, Askew, Corbett and Wilcut2005) and glyphosate + glufosinate on giant foxtail (Setaria faberi Herrm.) (Bethke et al. Reference Bethke, Molin, Sprague and Penner2013). However, Eytcheson and Reynolds (Reference Eytcheson and Reynolds2019) did not identify antagonism of glufosinate + clethodim on barnyardgrass, indicating that identification of antagonism may be dependent upon the weed species and the specific mixtures evaluated.
Although the effect of droplet size on herbicide efficacy has been documented, little research has been conducted to evaluate if droplet size could influence herbicide interactions. The efficacy of contact herbicides such as glufosinate is more dependent upon the droplet size and resultant coverage of the application than is the case for systemic herbicides (Etheridge et al. Reference Etheridge, Hart, Hayes and Mueller2001; Meyer et al. Reference Meyer, Norsworthy, Kruger and Barber2015a). In the case of droplet size, nozzle selection can greatly affect droplet size and resulting efficacy of glufosinate (Creech et al. Reference Creech, Moraes, Henry, Luck and Kruger2016; Meyer et al. Reference Meyer, Norsworthy, Kruger and Barber2015a, Reference Meyer, Norsworthy, Kruger and Barber2016a, Reference Meyer, Norsworthy, Kruger and Barber2016b). Thus, adding another herbicide to glufosinate that causes an increase to the droplet spectra has the potential to reduce the efficacy of glufosinate, similar to the way nozzle selection influences efficacy.
Interactions between glufosinate, glyphosate, and clethodim are not well documented on barnyardgrass and other common grass weeds in the Midsouth United States, so research was justified to determine if antagonism is occurring with these applications. The hypotheses tested by these experiments were that (1) increasing the rate of herbicides in mixture would mitigate antagonism observed at lower rates, (2) instances of antagonism will vary by the grass species evaluated, and (3) the addition of glyphosate or clethodim to glufosinate would increase the droplet spectra compared to glufosinate alone, which may affect the performance of glufosinate in mixture.
Materials and Methods
Two experiments were conducted at the Arkansas Agricultural Research and Extension Center (36.093307°N, 94.174219°W) in Fayetteville, AR, on a Leaf silt loam (Fine, mixed, active, thermic Typic Albaquults). Plot sizes were 2.4 by 9.1 m, and the entire experimental area was disked and field-cultivated prior to planting. At the time of trial establishment, johnsongrass seed was sown in two rows spaced 1.5 m apart by filling a planter unit for one row on a Hege 500 (Hege Equipment Inc., Colwich, KS) and making two passes across the plots in each replication (i.e., perpendicular to the spray direction). In addition, 1-L volumes each of barnyardgrass, broadleaf signalgrass, and large crabgrass seed were broadcasted across the experimental area. The barnyardgrass, broadleaf signalgrass, johnsongrass, and large crabgrass seed were obtained from Azlin Seed Services (Leland, MS). The field contained a native population of broadleaf signalgrass and barnyardgrass. Planting occurred June 24, 2015 and June 9, 2016 for both experiments. Herbicide applications were made with a CO2-pressurized backpack sprayer calibrated to deliver 143 L ha–1 spray volume at 276 kPa at 4.8 km h–1 through nozzles spaced 51 cm apart. The boom was equipped with Turbo TeeJet (TT) 110015 nozzles (TeeJet Technologies, Springfield, IL). Weed sizes at the time of herbicide application were recorded and are listed in Table 1.
Table 1. Weed sizes and densities of four grass weeds at the time of herbicide application evaluated in Experiments 1 and 2 in 2015 and 2016.

a Plant density is given as number of plants per 1 m of row.
Experiment 1
In Experiment 1, glufosinate (Liberty herbicide; Bayer CropScience, Research Triangle Park, NC) was applied at 451, 595, and 738 g ai ha–1 alone and in combination with various rates (76, 136, and 204 g ai ha–1) of clethodim (Select Max® herbicide; Syngenta Crop Protection LLC, Greensboro, NC). Additionally, S-metolachlor at 1,389 g ai ha–1 (Dual Magnum®; Syngenta Crop Protection LLC, Greensboro, NC) was included as a mixture for three glufosinate treatments (Table 2). At the time these studies were conducted, 451 and 595 g ai ha–1 were the recommended use rates for soybean, and 738 g ai ha–1 was the burndown rate. The current glufosinate label allows for applications of 595 to 738 g ai ha–1 in soybean (Anonymous 2017). A nontreated check was included for comparison (Table 2). Treatments containing clethodim included 1.0% v/v of Agridex (Helena Chemical Co., Collierville, TN), a crop oil concentrate (COC), unless S-metolachlor was included as a part of the mixture, because the herbicide label does not recommend S-metolachlor in mixture with COC (Anonymous 2015). The glufosinate label allows for COC in solution, and so COC was used for mixtures of glufosinate and clethodim (Anonymous 2017). Following application of the herbicide treatments, all plots that did not receive S-metolachlor as part of the experimental treatment received an application of S-metolachlor (1,389 g ai ha–1) within 24 h to help prevent new flushes of native grass populations. Treatments were applied at 9:00 a.m. on July 24, 2015, and 8:00 a.m. on July 7, 2016. Air temperature was 25 C and 27 C, relative humidity was 59% and 70%, and wind speed was 3 and 2 km h−1 in 2015 and 2016, respectively, based on in-field observations. Applications in both years occurred during what would be considered typical weather for the Midsouth United States, and no severe weather events (e.g., drought) occurred in either year that would have influenced results.
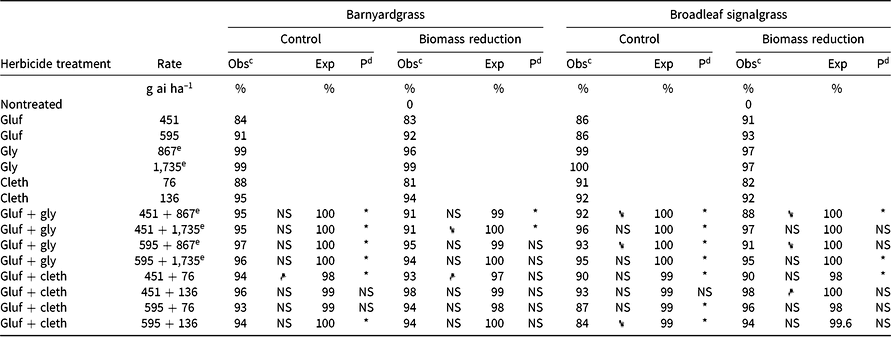
Table 2. Effect of glufosinate alone and in combinations with clethodim on observed and expected control 4 wk after treatment and aboveground biomass of barnyardgrass and broadleaf signalgrass in Experiment 1 at Fayetteville, AR.a,b

a Abbreviations: Cleth, clethodim; gluf, glufosinate; S-met, S-metolachlor; Obs, observed value; Exp, expected value; NS, not significant.
b Biomass is expressed as a percent of the nontreated control.
c A caret ∧ indicates a mixture that provided significantly greater observed control than both herbicides alone, based on the ANOVA and Fisher’s protected LSD (α = 0.05). A reversed caret ∨ indicates a mixture that provided significantly less observed control compared to at least one of the herbicides alone. NS (not significant) indicates that the control provided by the mixture was similar to both of the herbicides alone.
d An asterisk * denotes significant antagonism based on a two-sided t-test between observed and expected values. Expected values are based on Colby’s equation [E = (X + Y) – (XY)/100]. Expected values can only be calculated when two herbicides in the mixture have POST activity on the species.
Experiment 2
In Experiment 2, various rates of glufosinate, clethodim, and glyphosate (Roundup Powermax II® herbicide; Monsanto Co., St. Louis, MO) alone, and combinations of glufosinate + clethodim or glyphosate, were applied as herbicide treatments (Table 3). As mentioned previously, COC was included if the treatment contained clethodim alone, or clethodim + glufosinate. COC was not added if glyphosate was part of the treatment, as the glyphosate formulation used was an adjuvant-loaded formulation. Ammonium sulfate was not included, as hard water is not a common issue in the Midsouth, and it is a common practice in Arkansas not to include ammonium sulfate with glyphosate. Similar to Experiment 1, the entire experimental area received an application of S-metolachlor 24 h after treatment application to minimize further weed emergence. Treatments were applied at 2:00 p.m. on July 24, 2015, and 6:30 a.m. on July 7, 2016. Air temperature was 27 C and 26 C, relative humidity was 51% and 75%, and wind speed was 1 and 3 km h−1 in 2015 and 2016, respectively, based on in-field observations. Applications for both experiments occurred on the same day in both years, and no severe weather events (e.g., drought) occurred in either year that would have affected results of Experiment 2.
Table 3. Effect of glufosinate alone and in combinations with glyphosate or clethodim on observed and expected control 4 wk after treatment and aboveground biomass of barnyardgrass and broadleaf signalgrass in Experiment 2 at Fayetteville, AR.a
a Abbreviations: Cleth, clethodim; gluf, glufosinate; S-met, S-metolachlor; Obs, observed value; Exp, expected value; NS, not significant.
b Biomass is expressed as a percent of the nontreated control.
c A caret ∧ indicates a mixture that provided significantly greater observed control than both herbicides alone, based on the ANOVA and Fisher’s protected LSD (α = 0.05). A reversed caret ∨ indicates a mixture that provided significantly less observed control compared to at least one of the herbicides alone. NS (not significant) indicates that the control provided by the mixture was similar to both of the herbicides alone.
d An asterisk * denotes significant antagonism based on a two-sided t-test between observed and expected values. Expected values are based on Colby’s equation [E = (X + Y) – (XY)/100]. Expected values can only be calculated when two herbicides in the mixture have POST activity on the species.
e Rate is in g ae ha–1.
Weed control ratings were collected 4 wk after treatment (WAT) in both experiments for barnyardgrass, broadleaf signalgrass, johnsongrass, and large crabgrass. Weed control was visually evaluated on a scale of 0 (no control) to 100% (complete death of all plants) relative to the nontreated check. Weed biomass was collected by species within 3 d of the 4-WAT assessment. Biomass of barnyardgrass, broadleaf signalgrass, and large crabgrass was collected by species from a 1-m–2 quadrat in each plot. Johnsongrass biomass was collected from 1 m of row in each plot, as johnsongrass was sown with a planter as previously described. Following collection, biomass was dried at 40 C for 7 d and weighed to determine dry biomass relative to the nontreated check.
Wind Tunnel Experiment
Droplet size spectra for each herbicide treatment were analyzed in a low-speed wind tunnel at the University of Nebraska–Lincoln West Central Research and Extension Center in North Platte, NE (41.08989°N, 100.7698°W). Droplet spectra were determined using a Sympatec Helos Vario KR particle-size analyzer (Sympatec GmbH, Clausthal-Zellerfeld, Germany) equipped with an R7 lens capable of detecting particle sizes in a range from 18 to 3,500 μm as described by Creech et al. (Reference Creech, Henry, Fritz and Kruger2015) and Henry et al. (Reference Henry, Kruger, Fritz, Hoffmann, Bagley and Sesa2014). The laser was positioned 30 cm from the tip of the nozzle, and a linear actuator moved the width of the nozzle plume across the laser. Droplet spectra were analyzed with a wind speed of 24 km h–1 to mitigate spatial sampling bias. Each herbicide treatment in Experiments 1 and 2 was analyzed in the wind tunnel and replicated three times. The nozzle used in the wind tunnel experiment was the same used in the field experiment (TT 110015 nozzle). The same formulated products used in the field experiments were used for particle size analysis. Spray parameters determined from the droplet spectra analysis were the Dv10, Dv50 Dv90, relative span (RS), and the percentage of driftable fines. Dv10 is a calculated value describing the droplet diameter below which 10% of the liquid volume of all droplets is contained. Dv50 and Dv90 are similar parameters for 50% and 90% of the volume, respectively. For simplicity of reporting, the percentage of driftable fines was classified in this study as the percentage of the volume containing droplets with a diameter <150 μm (%vol fines). The RS is a parameter describing the range of droplet sizes of the spray plume calculated using Equation 1.
 $$RS = {{\left( {{D_{V90}}{\rm{}} - {\rm{}}{D_{V10}}} \right)} \over {{D_{V50}}}}$$
Data Analysis
Data were subjected to an ANOVA using JMP 13 (SAS Institute Inc., Cary, NC), and means were separated using Fisher’s protected least significant difference (LSD) test (α = 0.05). Data from 2015 and 2016 were combined, and the ANOVA conducted in JMP Pro 13 included year and replication (year) as random effects. Biomass data were converted to a percent reduction relative to the nontreated control (e.g., 100% reduction equals 0 kg of biomass). A natural-log transformation of biomass data was used to improve normality when needed. An arcsine square root transformation was used on the percent control data to improve normality when needed. ANOVA was conducted on the transformed values, and values were back-transformed for discussion and reporting.
For the wind tunnel experiment, a completely randomized design was used for the ANOVA. Means were separated using a more conservative Tukey adjustment (α = 0.05). Variability in particle size analysis tends to be much lower compared to biological assessments such as percent control or biomass, and a Tukey adjustment is commonly used for particle size analyses (Creech et al. Reference Creech, Henry, Fritz and Kruger2015).
In Experiments 1 and 2, herbicide mixture interactions were identified using Colby’s method (Colby Reference Colby1967) on the percent control data and biomass data. For Colby’s method, an expected value (E) is calculated using Equation 2.
 $$E = {\rm{ }}\left( {X + Y} \right){\rm{ }}-{\rm{ }}\left( {XY} \right)/100$$
where E is the expected level of control (or biomass reduction) of a given species when two herbicides are applied in a mixture, and variables X and Y represent the level of control of a given weed species provided by each herbicide applied individually. The observed and expected values were compared using a two-sided t-test (α = 0.05). If E was significantly greater than the observed value for a given mixture, it was deemed antagonistic. When a mixture included three herbicides with one herbicide that had no POST activity (e.g., S-metolachlor), the calculation for the expected value (Equation 2) used the values from the two herbicides that had POST activity.
The results from both the ANOVA means separation and Colby’s method were used to interpret the data and evaluate the mixtures. Colby’s method was used to determine if an herbicide interaction was present (e.g., antagonism), and the ANOVA means separation was used to determine if the mixtures provided control that was different from the component herbicides. For example, a given mixture may be considered additive (i.e., neither synergistic or antagonistic) but may not actually provide control that is greater than the component herbicides by themselves, suggesting that mixing the two herbicides does not provide an increase in control.
Results and Discussion
Barnyardgrass
Experiment 1
Control and biomass reduction of barnyardgrass with glufosinate, clethodim, and mixtures of glufosinate + clethodim were >88% for all treatments (Table 2). Antagonism was identified only for glufosinate at 451 g ha–1 + clethodim at 76 g ha–1 (biomass reduction) and glufosinate at 595 g ha–1 + clethodim at 76 g ha–1 (percent control). As all mixtures provided >90% control, glufosinate + clethodim may be an acceptable mixture for controlling barnyardgrass when the density of large plants (18 to 25 cm tall) is low (1 to 1.5 plants m–2). However, it should be noted that both glufosinate at ≥595 g ha–1 and clethodim at ≥136 g ha–1 provided a high level of control alone (≥94% control). The addition of another herbicide with POST activity on barnyardgrass may not be needed for acceptable control and may be better suited as a follow-up application at a later time.
The addition of S-metolachlor to glufosinate at 451 g ha–1 improved control from 88% to 94% despite S-metolachlor having no measurable POST activity. It should also be noted that all treatments that did not contain S-metolachlor received the same rate of S-metolachlor 24 h after treatments, applied primarily to prevent further emergence. However, the application of S-metolachlor within 24 h would probably mitigate any physiological synergy that could occur, meaning that any improvements in control are probably due to the adjuvants contained in the formulated product of S-metolachlor, or a reduction in droplet size of the treatment application, which tends to improve glufosinate efficacy (Etheridge et al. Reference Etheridge, Hart, Hayes and Mueller2001; Meyer et al. Reference Meyer, Norsworthy, Kruger and Barber2015a).
Experiment 2
Similar to Experiment 1, antagonism on barnyardgrass was identified for the mixture of the low rates of glufosinate + clethodim (451 + 76 g ha–1, respectively) for the biomass-reduction assessment, as well as for percent control (Table 3). Antagonism was identified for all mixtures of glufosinate + glyphosate for percent control evaluations. For biomass reduction, the mixtures of glufosinate at 451 g ha–1 + glyphosate at 867 and 1,735 g ae ha–1 were also antagonistic. When glyphosate at 1,735 g ha–1 was applied with glufosinate at 451 g ha–1, the biomass reduction was significantly less (91%) than for glyphosate alone (99%). Although the differences between mixtures and individual components can be subtle, having survivors of glufosinate + glyphosate application could lead to the evolution of herbicide resistance to either, or even both, herbicides.
Broadleaf Signalgrass
Experiment 1
The response of broadleaf signalgrass to the various rate structures of glufosinate + clethodim mixtures supports the concept of increasing the rate of the systemic herbicide in a mixture to help mitigate antagonism. Glufosinate at 451 g ha–1 + clethodim at 76 g ha–1 was antagonistic for both percent control (91% observed vs. 99% expected) and biomass reduction (Table 2). Increasing the rate of clethodim from 76 to 204 g ha–1 increased control numerically to 95% and mitigated antagonism. Increasing the rate of clethodim in mixture with glufosinate may improve clethodim uptake and translocation, thereby increasing control. In contrast, mixtures utilizing the high rate of glufosinate (738 g ha–1) were antagonistic for biomass reduction.
Even though the addition of S-metolachlor to glufosinate at 451 g ha–1 improved barnyardgrass control in Experiment 1, it did not affect broadleaf signalgrass control. The mixture of glufosinate + clethodim + S-metolachlor (451 + 76 + 1,389 g ai ha–1) did not have improved percent control over glufosinate + S-metolachlor (451 + 1,389 g ai ha–1). Control with glufosinate + clethodim + S-metolachlor was less than with clethodim alone (76 g ha–1) (86% compared to 93% control for the mixture and clethodim alone, respectively). The results from broadleaf signalgrass and barnyardgrass suggest that the response of control to additional herbicides, even S-metolachlor, which has no measurable POST activity, is dependent upon the species being evaluated.
Experiment 2
A clear indication of the impact of rate structure on observed antagonism was present with broadleaf signalgrass control and biomass reduction in Experiment 2. When glufosinate at either 451 or 595 g ha–1 was mixed with glyphosate at 867 g ha–1, a reduction in control occurred for the mixture compared to glyphosate alone (Table 3). When the glyphosate rate was increased to 1,735 g ha–1, antagonism was still present but control or biomass reduction was no longer less than glyphosate alone. Therefore, using a high rate of glyphosate (the systemic herbicide in the mixture) may be of value when the mixture is needed to control a broad weed spectrum present in a given field, even though the mixture is considered antagonistic on some species within the field.
For the glufosinate + clethodim mixtures in Experiment 2, the only mixture that had less control than one of its components (i.e., clethodim) was glufosinate at 595 g ha–1 + clethodim at 136 g ha–1 (84% control vs. 92% with clethodim alone). Based on the control values for the mixtures evaluated, glyphosate at 1,735 g ha–1 + glufosinate at 451 or 595 g ha–1 and glufosinate at 451 g ha–1 + clethodim at 136 g ha–1 provided the greatest control and did not have a reduction in control relative to one of the components in the mixture.
Seedling Johnsongrass
Experiment 1
The combination of glufosinate at 451 g ha–1 + clethodim at 76 g ha–1 had improved control and biomass reduction over either component of the mixture alone (Table 4). This rate structure (451 + 76 g ha–1) was identified as antagonistic for broadleaf signalgrass (both assessments) and for barnyardgrass biomass reduction; however, the combination also had greater barnyardgrass control than either component. These results demonstrate some of the limitations of evaluating various rate structures of the same herbicides on different species using Colby’s method and the difficulty of drawing broad conclusions from those results.
Table 4. Effect of glufosinate alone and in combinations with clethodim on observed and expected control 4 wk after treatment and aboveground biomass of johnsongrass and large crabgrass in Experiment 1 at Fayetteville, AR.a
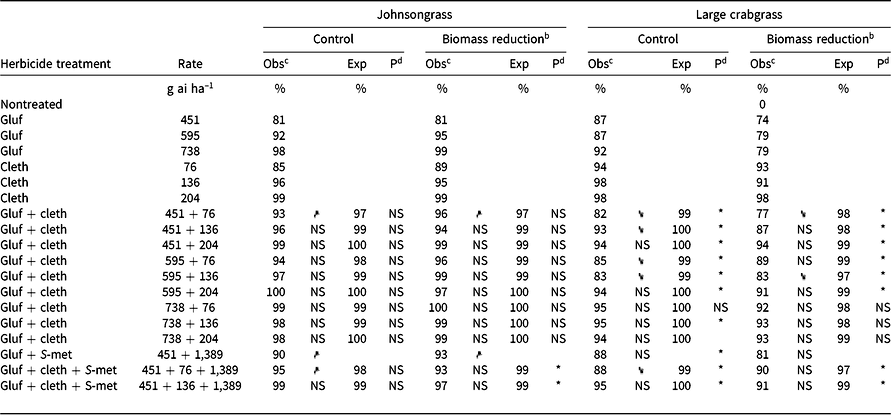
a Abbreviations: Cleth, clethodim; gluf, glufosinate; S-met, S-metolachlor; Obs, observed value; Exp, expected value; NS, not significant; NS, not significant.
b Biomass reduction is expressed as a percent of the nontreated control.
c A caret ∧ indicates a mixture that provided significantly more observed control compared to at least one of the herbicides alone, based on the ANOVA and Fisher’s protected LSD (α = 0.05). An inverted caret ∨ indicates a mixture that provided significantly less observed control compared to at least one of the herbicides alone. NS, (not significant) indicates that the control provided by the mixture was similar to both of the herbicides alone.
d An asterisk * denotes significant antagonism based on a two-sided t-test between observed and expected values. Expected values are based on Colby’s equation [E = (X + Y) – (XY)/100]. Expected values can only be calculated when two herbicides in the mixture have POST activity on the species.
As was observed with barnyardgrass, glufosinate + S-metolachlor had greater percent control and biomass reduction of johnsongrass than glufosinate alone (Table 4). Glufosinate at 451 g ha–1 provided 81% control of seedling johnsongrass 4 WAT, and the addition of S-metolachlor increased control to 90%. Similarly, glufosinate at 451 g ha–1 + clethodim at 76 g ha–1 + S-metolachlor at 1,389 g ha–1 had greater control (95%) over both glufosinate alone (81%) and clethodim alone (85%).
Experiment 2
Glufosinate alone at 451 g ai ha–1 provided only 79% control and 78% biomass reduction of seedling johnsongrass. No antagonism was identified for mixtures of glufosinate + glyphosate (Table 5). Whenever glyphosate was applied to johnsongrass, whether alone or in a mixture, control of johnsongrass was ≥98%. Although glyphosate was very effective at controlling johnsongrass, glyphosate-resistant populations have been identified in the Midsouth United States (Riar et al. Reference Riar, Norsworthy, Johnson, Scott and Bagavathiannan2011), and other herbicides or mixtures will have to be used for effective control.
Table 5. Effect of glufosinate alone and in combinations with glyphosate or clethodim on observed and expected control 4 wk after treatment and aboveground biomass of johnsongrass and large crabgrass in Experiment 2 at Fayetteville, AR.a
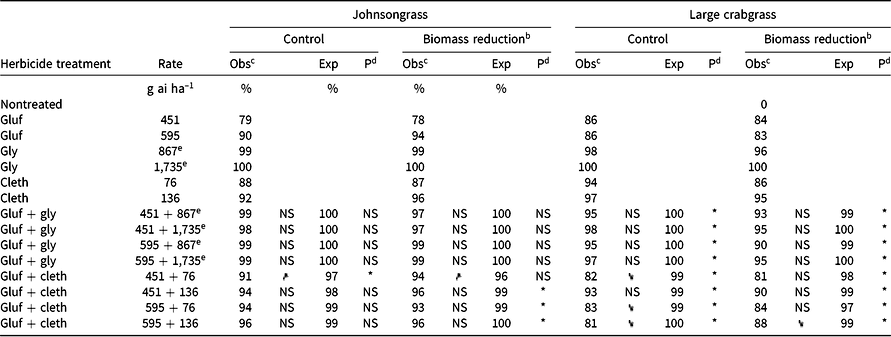
a Abbreviations: Cleth, clethodim; gluf, glufosinate; gly, glyphosate; Obs, observed value; Exp, expected value; NS, not significant.
b Biomass is expressed as a percent of the nontreated control.
c A caret ∧ indicates a mixture that provided significantly greater control compared to at least one of the herbicides alone, based on the ANOVA and Fisher’s protected LSD (α = 0.05). An inverted caret ∨ indicates a mixture that provided significantly less observed control compared to at least one of the herbicides alone. NS (not significant) indicates that the control provided by the mixture was similar to both of the herbicides alone.
d An asterisk * denotes significant antagonism based on a two-sided t-test between observed and expected values. Expected values are based on Colby’s equation [E = (X + Y) – (XY)/100]. Expected values can only be calculated when two herbicides in the mixture have POST activity on the species.
e Rate is in g ae ha–1.
Antagonism was identified for various combinations of glufosinate + clethodim for seedling johnsongrass biomass reduction (Table 5). Glufosinate (451 g ai ha–1) + clethodim (76 g ai ha–1) was identified as antagonistic for johnsongrass control (91% observed control compared to an expected value of 97%). However, the same mixture of glufosinate + clethodim (451 + 76 g ai ha–1) had significantly greater control (91%) and biomass reduction (94%) compared to glufosinate alone (79% and 78% control and biomass reduction, respectively). Therefore, if seedling johnsongrass is present in a field, and glufosinate will be used as a broad-spectrum herbicide, adding clethodim to the mixture may improve control.
Some of the conclusions from Experiment 2 do not agree with the results of the same treatments, which are also found in Experiment 1 (Table 4). For example, glufosinate at 451 g ha–1 + clethodim at 76 g ha–1 was considered antagonistic in Experiment 2 for percent control, but was classified as additive in Experiment 1. The discrepancies between Experiment 1 and Experiment 2 may be explained by taller average plant heights of johnsongrass, particularly in 2015 (33 cm and 41 cm in height for Experiments 1 and 2 in 2015, respectively). Although direct comparisons cannot be made between experiments, this may suggest the importance of weed size on the identification of herbicide interactions (Miller et al. Reference Miller, Norsworthy, Bond, Stephenson, Everman, Marshall, Meyer and Cotie2015).
It is important to reiterate that both Experiment 1 and 2 evaluated a population consisting of only seedling johnsongrass. The trials were initiated in fields that did not have a native population of johnsongrass, and the johnsongrass evaluated was easily identified as plants sown into rows using a planter. Single applications of glufosinate at ≥595 g ha–1 or clethodim at ≥136 g ha–1 provided >90% control of seedling johnsongrass in both experiments, whereas both Johnson et al. (Reference Johnson, Norsworthy and Scot2014b) and Meyer et al. (Reference Meyer, Norsworthy, Stephenson, Bararpour, Landry and Woolan2015b) reported that two applications of glufosinate were needed to control rhizomatous johnsongrass.
Large Crabgrass
Experiment 1
Glufosinate + clethodim mixtures were antagonistic for large crabgrass control, except for glufosinate at 738 g ha–1 + clethodim at 76 g ha–1 (Table 4). Even more concerning, when clethodim was applied at 76 or 136 g ha–1 with glufosinate 451 or 595 g ha–1, a reduction in control was observed compared to clethodim alone (Table 4). The observed value for control with glufosinate at 451 g ha–1 + clethodim at 76 g ha–1 was 82%, and the expected value was 99%, indicating a considerable deviation from the expected response. Increasing the rate of clethodim from 76 to 136 g ha–1 in mixture with glufosinate at 451 g ha–1 increased control from 82% to 93%, although the mixture was still antagonistic. The addition of S-metolachlor to glufosinate (451 g ai ha–1) + clethodim (76 g ai ha–1) was not different from glufosinate + clethodim at the same rate, although numerically it had greater control (88%). Both the three-way mixture glufosinate (451 g ai ha–1) + clethodim (76 g ai ha–1) + S-metolachlor (1,389 g ai ha–1) and the two-way mixture of glufosinate + clethodim (at the same rate) resulted in less large crabgrass control than glufosinate alone.
Experiment 2
Rate structures of both glufosinate + glyphosate and glufosinate + clethodim mixtures were antagonistic for percent control and biomass reduction of large crabgrass (Table 5). A reduction in control was also observed for glufosinate at 451 g ha–1 + clethodim at 76 g ha–1 and glufosinate at 595 g ha–1 + clethodim at 76 or 136 g ha–1 compared to the appropriate rate of clethodim alone. Glufosinate at 451 g ha–1 + clethodim at 136 g ha–1 proved to be superior with 93% control, whereas the other glufosinate + clethodim combinations only provided ≤83% control. These results may be explained by examining the ratio of glufosinate to clethodim in the mixtures. If glufosinate is limiting the activity of the systemic herbicide, a higher amount of clethodim relative to glufosinate should improve control. The ratios of glufosinate to clethodim were 5.9 for 451 + 76 g ha–1, 4.4 for 595 + 136 g ha–1, and 3.3 for 451 + 136 g ha–1; the treatment with the lowest glufosinate-to-clethodim ratio also had the greatest control. Although it is considered a systemic herbicide, only a fraction (≤20%) of clethodim that is absorbed is translocated out of the treated leaf when applied alone (Nandula et al. Reference Nandula, Poston, Reddy and Koger2007), meaning that slight reductions in translocation may have a profound impact on clethodim efficacy. Furthermore, adjuvant selection and the addition of contact herbicides (i.e., bromoxynil) are both known to have an impact on uptake and transport of clethodim in barnyardgrass (Culpepper et al. Reference Culpepper, Jordan, York, Corbin and Sheldon1999).
Combinations of glufosinate + glyphosate had ≥95% control and ≥90% biomass reduction, although none of them had improved control over the appropriate rate of glyphosate alone. Unfortunately, applications of mixtures will be needed in most farmer fields to control a broad spectrum of weeds, with some species resistant to glyphosate. These results suggest that if glufosinate is to be applied to a field with large crabgrass, glyphosate should be added to glufosinate instead of clethodim, if the crop technology allows (e.g., Glytol® LibertyLink® cotton). In the case of large crabgrass, glufosinate + glyphosate may be better than glufosinate + clethodim from a resistance management perspective, because the performance of the mixture is less likely to be reduced relative to the systemic herbicide alone across a range of rates.
Droplet Spectra Analysis
A possible explanation for the improved control of glufosinate at 451 g ha–1 + S-metolachlor at 1,389 g ha–1 over glufosinate alone for barnyardgrass and johnsongrass control is the effect the addition of S-metolachlor has on the droplet spectra compared to the same rate of glufosinate alone. However, if a reduction in droplet size was improving efficacy, it would be expected to enhance efficacy on all grass species, and no differences were observed between glufosinate and glufosinate + S-metolachlor for broadleaf signalgrass and large crabgrass control. The addition of S-metolachlor reduced the Dv50 of the droplet spectra from 296 µm to 238 µm and increased the percentage of volume containing fine droplets (%vol <150 µm) from 12.4% to 17.4% (Table 6). Smaller droplet size and increased percent fines has been documented to increase coverage and improve weed control with glufosinate (Etheridge et al. Reference Etheridge, Hart, Hayes and Mueller2001; Meyer et al. Reference Meyer, Norsworthy, Kruger and Barber2015a).
Table 6. Spray characteristics of various herbicide combinations in Experiment 1 including Dv10, Dv50, Dv90, relative span, and percent of the volume (%vol) containing droplets with diameters <150 µm when applied using a TT 110015 nozzle at 276 kPa.
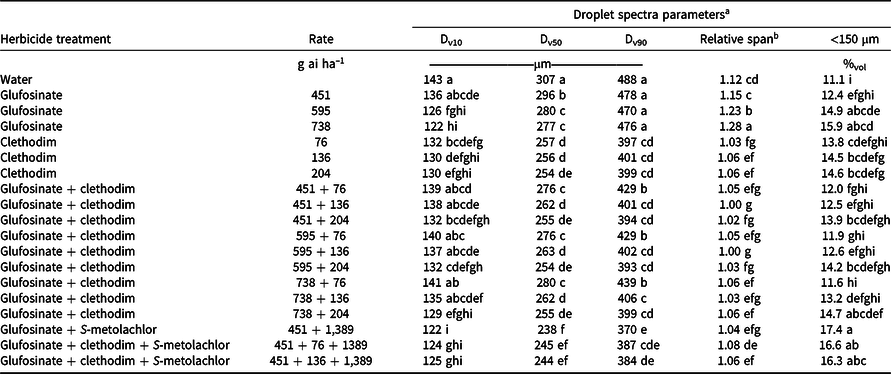
a Means followed by the same letter within a column are not statistically different according to Fisher’s protected LSD with a Tukey adjustment (α = 0.05).
b Relative span is a unitless index of the uniformity of droplet size distribution. Smaller values represent more uniformity in droplet size distribution.
The effect of the addition of clethodim to glufosinate on the droplet spectra is dependent upon the rate of both herbicides used in the mixture. When the low rate of glufosinate (451 g ha–1) is considered, the addition of clethodim at 76 g ha–1 reduces the Dv50 from 296 to 276 µm, and when more clethodim is added, the Dv50 is further reduced (Table 6). In contrast, glufosinate at 738 g ha–1 has a Dv50 of 277 µm and a %vol fines of 15.9%. When clethodim at 76 g ha–1 is added to this rate of glufosinate, Dv50 does not change but %vol fines is reduced to 11.6%. A change in %vol fines without a change in Dv50 is explained by a change in RS of the droplet size spectra, meaning that the distribution of droplet sizes for the application is more focused around the Dv50. Ultimately, the slight differences in droplet size spectra for glufosinate + clethodim mixtures are unlikely to fully account for the antagonism observed in the field.
The addition of glyphosate to glufosinate also had variable effects on droplet size, depending on the rates of both herbicides in the mixture. When glyphosate at 867 g ha–1 was added to both rates of glufosinate, no change in Dv50, RS, or %vol fines was observed (Table 7). When glyphosate at 1,735 g ha–1 was added to the higher rate of glufosinate (595 g ha–1), an increase in Dv50 was observed and %vol fines decreased from 14.9% to 10.3%. It should be noted that droplet size of a mixture is affected by the formulation of a given herbicide and any adjuvants in the system (Holloway et al. Reference Holloway, Butler Ellis, Webb, Western, Tuck, Hayes and Miller2000; Mueller and Womac Reference Mueller and Womac1997). An increase in Dv50 and a decrease in %vol fines is not favorable for glufosinate efficacy and may affect the performance of the mixture. However, as glufosinate + glyphosate was generally antagonistic across rate structures, the impact of the change in droplet spectra is probably minimal and the antagonism is more likely a result of limited translocation of glyphosate (Besançon et al. Reference Besançon, Penner and Everman2018; Bethke et al. Reference Bethke, Molin, Sprague and Penner2013; Meyer et al. Reference Meyer, Norsworthy and Beffa2018).
Table 7. Spray characteristics of various herbicide combinations in Experiment 2 including Dv10, Dv50, Dv90, relative span, and percent of the volume (%vol) containing droplets with diameters <150 µm when applied using a TT 110015 nozzle at 276 kPa.

a Means followed by the same letter within a column are not statistically different according to Fisher’s protected LSD with a Tukey adjustment (α = 0.05).
b Relative span is a unitless index of the uniformity of droplet size distribution. Smaller values represent more uniformity in droplet size distribution.
c Rate is in g ae ha–1.
The impact one herbicide has on the droplet spectra of another, when mixed, is dependent on a variety of factors and the conditions under which the mixture was applied. These experiments were applied with a TT nozzle at 143 L ha–1. Moreover, mixtures of glufosinate + clethodim always had COC, and a change in adjuvant will influence the droplet spectra (Spanoghe et al. Reference Spanoghe, De Schampheleire, Van and Steurbaut2007) and may alter the interaction occurring in the mixture. Different formulations of the same herbicide can differ in droplet spectra (Mueller and Womac Reference Mueller and Womac1997), meaning that the individual product is also likely to influence the droplet spectra of the mixture. Further convoluting this issue, the formulation of an active ingredient will also affect the identification of herbicide interactions. For example, Kudsk and Mathiassen (Reference Kudsk and Mathiassen2004) reported higher levels of synergism for mixtures of commercial products compared to the technical-grade laboratory products, indicating that the adjuvants in the commercially available products may improve uptake of both products in mixture. Identification of herbicide interactions can also differ between commercial formulations of the same active ingredient (Nalewaja and Matysiak Reference Nalewaja and Matysiak1992).
Practical Implications
The antagonism that was observed for both mixtures of glufosinate + glyphosate and glufosinate + clethodim was dependent upon the rate and weed species evaluated. For mixtures of glufosinate + clethodim and glufosinate + glyphosate, increasing the rate of either herbicide in the mixture increased control and decreased the likelihood of identifying antagonism using Colby’s method. It is generally accepted that contact herbicides inhibit the activity of systemic herbicides (Bethke et al. Reference Bethke, Molin, Sprague and Penner2013; Chuah et al. Reference Chuah, Teh, Cha and Ismail2008; Fish et al. Reference Fish, Webster, Blouin and Bond2015; Norsworthy et al. Reference Norsworthy, Bangarwa, Scott, Still and Griffith2010). This research suggests that if glufosinate is to be mixed with glyphosate or clethodim, a high labeled rate of either glyphosate or clethodim should be used. Glufosinate has previously been reported to antagonize clethodim (Burke et al. Reference Burke, Askew, Corbett and Wilcut2005) and glyphosate (Bethke et al. Reference Bethke, Molin, Sprague and Penner2013). Furthermore, the identification of antagonism is dependent not only upon weed species evaluated but also upon the conditions of a given experiment.
For glufosinate at 451 g ha–1 + clethodim at 76 g ha–1, an improvement in control was observed over the individual herbicides for barnyardgrass and johnsongrass control, whereas a reduction was observed for large crabgrass and no difference for broadleaf signalgrass. The inconsistencies in the performance of glufosinate (451 g ha–1) + clethodim (76 g ha–1) across species, coupled with the identification of antagonism for various assessments, suggests that higher rates are needed when many species are present in a given field. For example, if large crabgrass is present in a field, glufosinate alone does not provide sufficient control and the addition of clethodim may be warranted. Although data from these experiments lead to the conclusion that the mixture of glufosinate + clethodim is antagonistic, the improvement in control over glufosinate alone for some species and overall high levels of control for the higher use rates indicate that this mixture may be more beneficial than glufosinate alone. Thus, when mixtures are needed to improve control or broaden the weed control spectrum, high rates of the individual herbicides should be utilized to minimize the risk for evolving resistance.
Although clethodim at 76 g ha–1 is a labeled rate, performance of the herbicide at this rate was not consistent across Experiments 1 and 2 for either broadleaf signalgrass, johnsongrass, or large crabgrass control. Therefore, the recommended use rate for clethodim alone or in mixture should be at least 136 g ha–1. For control of barnyardgrass, broadleaf signalgrass, seedling johnsongrass, and large crabgrass, the optimum mixture would depend on the trait technology used. For instance, in a glufosinate-resistant soybean system, glufosinate should be applied at 595 g ha–1 with clethodim at 136 g ha–1, and glyphosate- and glufosinate-resistant cotton, glufosinate should be applied at 595 g ha–1 with glyphosate at 1,735 g ha–1.
Acknowledgments
Funding for this research was provided by the Arkansas Soybean Promotion Board and Bayer CropScience. No conflicts of interest have been declared.


 Open access