


Introduction
In cells, ion channels and transporters located in the plasma and organellar membranes generate ion-specific fluxes (reviewed by Meissner, Reference Meissner1983; Zhu et al., Reference Zhu, Ma, Parrington, Galione and Evans2010; Szabo and Zoratti, Reference Szabo and Zoratti2014; Xu et al., Reference Xu, Martinoia and Szabo2015; Carraretto et al., Reference Carraretto, Teardo, Checchetto, Finazzi, Uozumi and Szabo2016). These generate electrical or chemical signals that play vital roles in specific biological events. The coordinated action of all the channels and transporters located in a membrane within a cell in so-called ‘ion channel networks’, results in the differential accumulation of ions (and therefore electric charge) across this membrane (Longden et al., Reference Longden, Hill-Eubanks and Nelson2016). It is these distinct heterogeneities in charge across membranes that govern the overall electrical properties and therefore the signalling properties of a particular cell, tissue, organ or organism (Talevi and Dale, Reference Talevi and Dale1986; Gusovsky and Daly, Reference Gusovsky and Daly1988; De Simone et al., Reference De Simone, Grumetto, Tosti, Wilding and Dale1998; Monteiro et al., Reference Monteiro, Aires, Becker, Jacinto, Certal and Rodríguez-León2014; Luxardi et al., Reference Luxardi, Reid, Ferreira, Maillard and Zhao2015; Longden et al., Reference Longden, Hill-Eubanks and Nelson2016).
It is well established that ion fluxes either into or out of cells are correlated with fertilization, development, differentiation, growth, regeneration, pattern formation and homeostatic regulation in a diverse array of biological systems, including animals, fungi and plants (Jaffe, Reference Jaffe, Cone and Dowling1979; De Simone et al., Reference De Simone, Grumetto, Tosti, Wilding and Dale1998; Tosti, Reference Tosti2010; Tosti et al., Reference Tosti, Gallo and Silvestre2011; Hunter et al., Reference Hunter, Crawford, Genkins and Kiehart2014; Tosti et al., Reference Tosti, Boni and Gallo2016; Carvacho et al., Reference Carvacho, Piesche, Maier and Machaca2018; McLaughlin and Levin, Reference McLaughlin and Levin2018). In addition to intracellular ion fluxes, developing organs and organisms often also require the activity of ions in the localized extracellular environment (Slack and Warner, Reference Slack and Warner1973; Jaffe, Reference Jaffe, Cone and Dowling1979, Reference Jaffe1981; Jaffe and Stern, Reference Jaffe and Stern1979; Kline et al., Reference Kline, Robinson and Nuccitelli1983; Nuccitelli, Reference Nuccitelli1987; Rathore et al., Reference Rathore, Hodges and Robinson1988; Altizer et al., Reference Altizer, Moriarty, Bell, Schreiner, Scott and Borgens2001). In plants, for example, one of the earliest reports demonstrated that an endogenous Ca2+ current was driven through the eggs of the brown fucoid algae Pelvetia fastigiata during zygotic polarization (Robinson and Jaffe, Reference Robinson and Jaffe1975). Soon after, an influx of K+ and an efflux of H+ were described in extending lily (Lilium longiflorum) pollen tubes (Weisenseel and Jaffe, Reference Weisenseel and Jaffe1976), and H+ currents were reported to traverse the growing roots and root hairs of barley (Hordeum vulgare; Weisenseel et al., Reference Weisenseel, Dorn and Jaffe1979). These early papers were quickly followed by a plethora of reports of ion fluxes entering and leaving a variety of tip-growing and polarizing plant structures from a wide range of different species (Miller et al., Reference Miller, Raven, Sprent and Weisenseel1986, Reference Miller, Shand and Gow1988; Miller and Gow, Reference Miller and Gow1989; Jones et al., Reference Jones, Shaff and Kochian1995; Kühtreiber and Jaffe, 1990; Feijó et al., Reference Feijó, Sainhas, Hackett, Kunkel and Hepler1999; Messerli et al., Reference Messerli, Danuser and Robinson1999; Zonia et al., Reference Zonia, Cordeiro, Tupý and Feijó2002; Xu et al., Reference Xu, Sun and Yin2006). With regards to fungi, early reports described ion currents traversing the growing hyphae of the water mould Achlya bisexualis (Kropf et al., Reference Kropf, Caldwell, Gow and Harold1984) as well as the bread mould Neurospora crassa (McGillviray and Gow, Reference McGillviray and Gow1987). More recently, transmembrane H+ and Ca2+ fluxes have also been reported during apical growth and gravi-reception in stage 1 sporangiophores of the fungi Phycomyces blakesleeanus (Živanović, Reference Živanović2012).
In animals, Na+ currents have been demonstrated in the near vicinity of regenerating limbs of the red-spotted newt Notophthalmus viridescens (Borgens et al., Reference Borgens, Vanable and Jaffe1977), as well as the regenerating tails of Xenopus laevis tadpoles (Tseng and Levin, Reference Tseng and Levin2008). Furthermore, transmembrane fluxes of H+ and K+ have been reported to play a role in the regulation of head and organ size during regeneration of the planaria Schmidtea mediterranea (Beane et al., Reference Beane, Morokuma, Lemire and Levin2013); and an efflux of H+ has been reported to occur during regeneration of the caudal fin in zebrafish (Danio rerio; Monteiro et al., Reference Monteiro, Aires, Becker, Jacinto, Certal and Rodríguez-León2014). In addition, during embryogenesis, an early report demonstrated that the membrane of early Xenopus embryos is highly permeable to K+ (Slack and Warner, Reference Slack and Warner1973). Furthermore, effluxes of H+, K+, and HCO3 – and influxes of K+ and Ca2+ have been reported around the oocytes of the African clawed frog (Xenopus laevis; Moreau et al., Reference Moreau, Vilain and Guerrier1980; Faszewski and Kunkel, Reference Faszewski and Kunkel2001). Ion fluxes have also been reported around the follicles and eggs of Drosophila melanogaster (Overall and Jaffe, 1985), an efflux of H+ is reported to initiate the development of sea urchin (Strongylocentrotus purpuratus) eggs just after fertilization (Johnson and Epel, Reference Johnson and Epel1976), and more recently Ca2+ fluxes were found in the cleavage furrow of dividing zebrafish embryos (Chan et al., Reference Chan, Chen, Hung, Miller, Shipley and Webb2015). An efflux of H+ coupled to an influx of Ca2+ has also been reported to create favourable alkaline internal conditions for calcification events during shell formation of the freshwater common pond snail Lymnaea stagnalis (Ebanks et al., Reference Ebanks, O’Donnell and Grosell2010).
Ion currents are also associated with key physiological processes, such as those required for homeostatic regulation. For example, transepithelial ion fluxes have been recorded from H+-pump rich cells located in zebrafish skin that help to regulate systemic acid–base homeostasis (Guh et al., Reference Guh, Yang, Liu, Huang and Hwang2016), and Ca2+ fluxes have been reported exiting and entering the scales of zebrafish (Hung et al., Reference Hung, Webb, Palumbo, Lesniak, Shipley, Rubinacci, Kunkel and Miller2019) and sea trout (Salmo trutta; Jamieson et al., Reference Jamieson, Waters, Ho, Chan, Hung, Webb, Chan, Shipley, Williamson, Beer, Angus and Miller2021) as a short-term mechanism that helps in the regulation of the blood/interstitial fluid Ca2+ concentration during environmental and behavioural-induced calcemic challenges. In addition, ion fluxes have been reported to traverse a wide variety of neurons from a diverse range of species. For example, Ca2+ fluxes cross the cell membrane of the abdominal ganglion of the sea slug Aplysia californica when it is under oxidative stress (Duthie et al., Reference Duthie, Shipley and Smith1994). It has also been proposed that endogenous electrical currents might guide the rostral migration of neuroblasts in the brain of the neonatal mouse (Mus musculus; Cao et al., Reference Cao, Wei, Reid, Zhao, Pu, Pan, Yamoah and Zhao2013).
The flux of ions into and out of cells can be measured in the extracellular medium using a scanning ion-selective electrode technique (SIET). This is an ultrasensitive technique for measuring extracellular ion fluxes in a non-invasive manner via the use of a single ion-sensitive microelectrode (ISM), which is moved repeatedly between two measuring points located in close vicinity to the sample (Kühtreiber and Jaffe, 1990; Kochian et al., Reference Kochian, Shaff, Kühtreiber, Jaffe and Lucas1992; Smith, Reference Smith1995; Felle and Hepler, Reference Felle and Hepler1997; Hung et al., Reference Hung, Webb, Palumbo, Lesniak, Shipley, Rubinacci, Kunkel and Miller2019). Indeed, when the appropriate ion-selective ionophore sensor is loaded into the ISM tip, the detection of various ions at concentrations as low as at the picomolar level is possible with the SIET. For example, in recent years this technique has been used to detect small Ca2+ fluxes at the surface of excised metatarsal bones in the mouse (Marenzana et al., Reference Marenzana, Shipley, Squitiero, Kunkel and Rubinacci2005; Dedic et al., Reference Dedic, Hung, Shipley, Maeda, Gardella, Miller, Divieti Pajevic, Kunkel and Rubinacci2018), and around the scales of adult zebrafish (Hung et al., Reference Hung, Webb, Palumbo, Lesniak, Shipley, Rubinacci, Kunkel and Miller2019) and sea trout (Jamieson et al., Reference Jamieson, Waters, Ho, Chan, Hung, Webb, Chan, Shipley, Williamson, Beer, Angus and Miller2021). It has also been used to measure effluxes of Na+, Cl–, K+, Ca2+ and H+ in wounds made in the skin of C57BL/6 mice (Sun et al., Reference Sun, Yue and Zhang2015), and an efflux of H+ in the excretory pore of Caenorhabditis elegans (Adlimoghaddam et al., Reference Adlimoghaddam, Weihrauch and O’Donnell2014). Prior to the development of the SIET, ion fluxes could still be identified using a simple voltage sensitive vibrating probe (Jaffe and Nuccitelli, 1974) in combination with an ion-substitution methodology (Reid et al., Reference Reid, Nuccitelli and Zhao2007), where ions were selectively removed from the measuring medium and the effect on the current density recorded. Alternatively, intracellular Na+ activity and pH could be measured continuously for several hours with sharp recessed-tip microelectrodes (prepared from Na+-sensitive or pH-sensitive glass, respectively), which were inserted into cells (Thomas, Reference Thomas1972, Reference Thomas1974).
Here, we used the SIET to measure H+ fluxes around X. laevis embryos between stage 9 to stage 12 (i.e. from ˜7 hpf to 13.25 hpf), for the duration of gastrulation (Harland, Reference Harland2000). Neural induction is initiated during blastula stage 8 and continues throughout the gastrula period (Baker et al., Reference Baker, Beddington and Harland1999; Kuroda et al., Reference Kuroda, Wessely and De Robertis2004), during which the ectodermal cells adopt either a neural or epidermal fate depending on their location with regards to the dorsal/ventral axis. The dorsal ectoderm is triggered to become neuroectoderm and, at the same time, the anterior–posterior axis is also initiated (Doniach et al., Reference Doniach, Phillips and Gerhart1992; Lamb and Harland, Reference Lamb and Harland1995; reviewed by Weinstein and Hemmati-Brivanlou, Reference Weinstein and Hemmati-Brivanlou1999; Harland, Reference Harland2000). It has been reported that in ex vivo planar explants of X. laevis, the intracellular pH (pHi) increases (indicating a decrease in intracellular [H+]) specifically in the dorsal ectoderm cells from stage 10.5 to stage 11.5 (i.e. 11–12.5 hpf) and it was suggested that this change in pHi plays a role in neural induction (Sater et al., Reference Sater, Alderton and Steinhardt1994). These experiments were conducted using the intracellular fluorescent pH indicator bis-carboxyethyl-carboxyfluorescein-dextran (BCECF-dextran), which was microinjected into 32-cell stage embryos, in conjunction with monitoring via emission ratio microfluorimetry. More recently, the SIET was used to measure distinct H+ effluxes in X. laevis embryos from the two-cell stage to stage 6 (i.e. ˜1.5 hpf to 3 hpf), and these were reported to play a role in left–right patterning (Adams et al., Reference Adams, Robinson, Fukumoto, Yuan, Albertson, Yelick, Kuo, McSweeney and Levin2006). However, these studies did not extend as far as neural induction. Therefore, it was of interest to confirm if distinct localized H+ fluxes could be measured around X. laevis embryos at the onset of neural induction using this non-invasive method. In addition, vacuolar H+-ATPases (V-ATPases) have been demonstrated to control the intracellular pH in many systems (Harvey, Reference Harvey1992). In X. laevis embryos, V-ATPase subunits have been shown to be localized asymmetrically as so-called ‘fingers’ extending from the vegetal cytoplasm into the animal hemisphere during the first few hours of development (Adams et al., Reference Adams, Robinson, Fukumoto, Yuan, Albertson, Yelick, Kuo, McSweeney and Levin2006). Therefore, we also investigated the activity of this ATP-driven H+ pump on neural induction by treating embryos from stage 9 to stage 12 with the V-ATPase inhibitor bafilomycin A1 (Bowman et al., Reference Bowman, Siebers and Altendorf1988). The embryos were then fixed at stage 22 (i.e. 24 hpf) and the expression of the early neural gene, Zic3 (Nakata et al., Reference Nakata, Nagai, Aruga and Mikoshiba1997), was determined by in situ hybridization. The possible role of H+ fluxes and the V-ATPase on neural induction in X. laevis is discussed.
Materials and methods
General X. laevis husbandry
Wild-type X. laevis were obtained from Nasco Agricultural Sciences (Fort Atkinson, WI, USA), and maintained in a custom-made recirculating system in the Animal and Plant Care Facility at the HKUST. The system had a 5-µm water filter and ultraviolet (UV) light for disinfection. X. laevis were kept in 17 × 11.5 × 5.5-inch clear plastic tanks at a density of either two or three females or four or five males per tank in 12 L of frog water, which consisted of dechlorinated tap water containing 0.06 g L–1 Instant Ocean synthetic sea salt (Aquarium Systems, Inc., Mentor, OH, USA). They were maintained on a 12-h light/12-h dark cycle at ˜18°C and with 70% humidity, and they were fed twice a week with ˜1 g of Purina LabDiet® frog brittle (5LP3; Purina Mills, LLC, Gray Summit, MO, USA) per animal and once a week with blood worms (Hikari, Japan). All the procedures used in this study were performed in accordance with the guidelines and regulations set out by the Animal Ethics Committee of the HKUST and by the Department of Health, Hong Kong.
Embryo production
The procedure used to harvest the embryos was as described previously (Kay and Peng, Reference Kay and Peng1991). Eggs were obtained from female X. laevis that had been primed between ˜3 to 5 days prior to ovulation with 75 IU pregnant mare serum gonadotropin (Sigma-Aldrich Corp., St. Louis, MO, USA) to reinitiate oocyte meiosis. The females were then given a second injection of 500 IU human chorionic gonadotrophin (hCG; Sigma-Aldrich Corp.) at ˜18–22 h prior to ovulation. The eggs were fertilized in vitro with macerated testis, and then dejellied with 0.1× Marc’s Modified Ringer’s solution (MMR: 100 mM NaCl, 2 mM KCl, 1 mM MgSO4, 2 mM CaCl2, 5 mM HEPES, pH 7.4) containing 2–3% l-cysteine hydrochloride (Sigma-Aldrich Corp.; pH 8.0) for ˜3–5 min with gentle shaking. After dejellying, the embryos were rinsed five times with 0.1× MMR to remove the l-cysteine hydrochloride and then incubated in 0.1× MMR at 23°C until required. Staging was according to Nieuwkoop and Faber (Reference Nieuwkoop and Faber1967).
SIET
Non-invasive measurements of real-time H+ fluxes (pmol cm–2 s–1) in the extracellular medium perpendicular to the surface of X. laevis embryos from stages 9–12 (i.e. from 7 hpf to 13.25 hpf) were accomplished using a SIET system (custom-designed and built by Applicable Electronics, LLC, New Haven, CT, USA) via an H+ ISM. The technique is described in detail in Hung et al. (Reference Hung, Webb, Palumbo, Lesniak, Shipley, Rubinacci, Kunkel and Miller2019) in which we used a Ca2+ ISM, with the following modifications for measuring H+ fluxes.
For the H+ flux measurements, silanized glass microelectrodes were back filled with pH-buffered electrolyte (100 mM KCl and 50 mM HEPES, pH 7) to a column length of ˜1 cm, and then front filled with Hydrogen Ionophore I Cocktail B (Sigma-Aldrich Corp.) to a column length of 25 µm. These glass microelectrodes were assembled and then connected to the microelectrode holder to form the ISM of the SIET system. ISMs were calibrated before every experiment to ensure their reliable performance during data collection (Fig. 1a). To achieve this, a three-point calibration was performed using three ion standard solutions. For H+ flux measurements, 0.05 M Tris buffers at pH 6, pH 7 and pH 8 were used. A voltage value was taken for each ion standard solution and the Nernstian slope was calculated using the automated scanning electrode technique (ASET) software (Science Wares Inc., Falmouth, MA). The Nernstian slope was accepted at a theoretical value ± 4 (i.e. for H+: 54.76–62.76), alternatively, the ISM was recalibrated or replaced (Kühtreiber and Jaffe, 1990). After calibration, the ISM was also checked before each experiment to ensure that the background system noise was close to 0 pmol cm–2 s–1 (Fig. 1b). This background recording was performed using the experimental bathing medium (i.e. 0.1× MMR) in the scanning chamber minus an embryo.
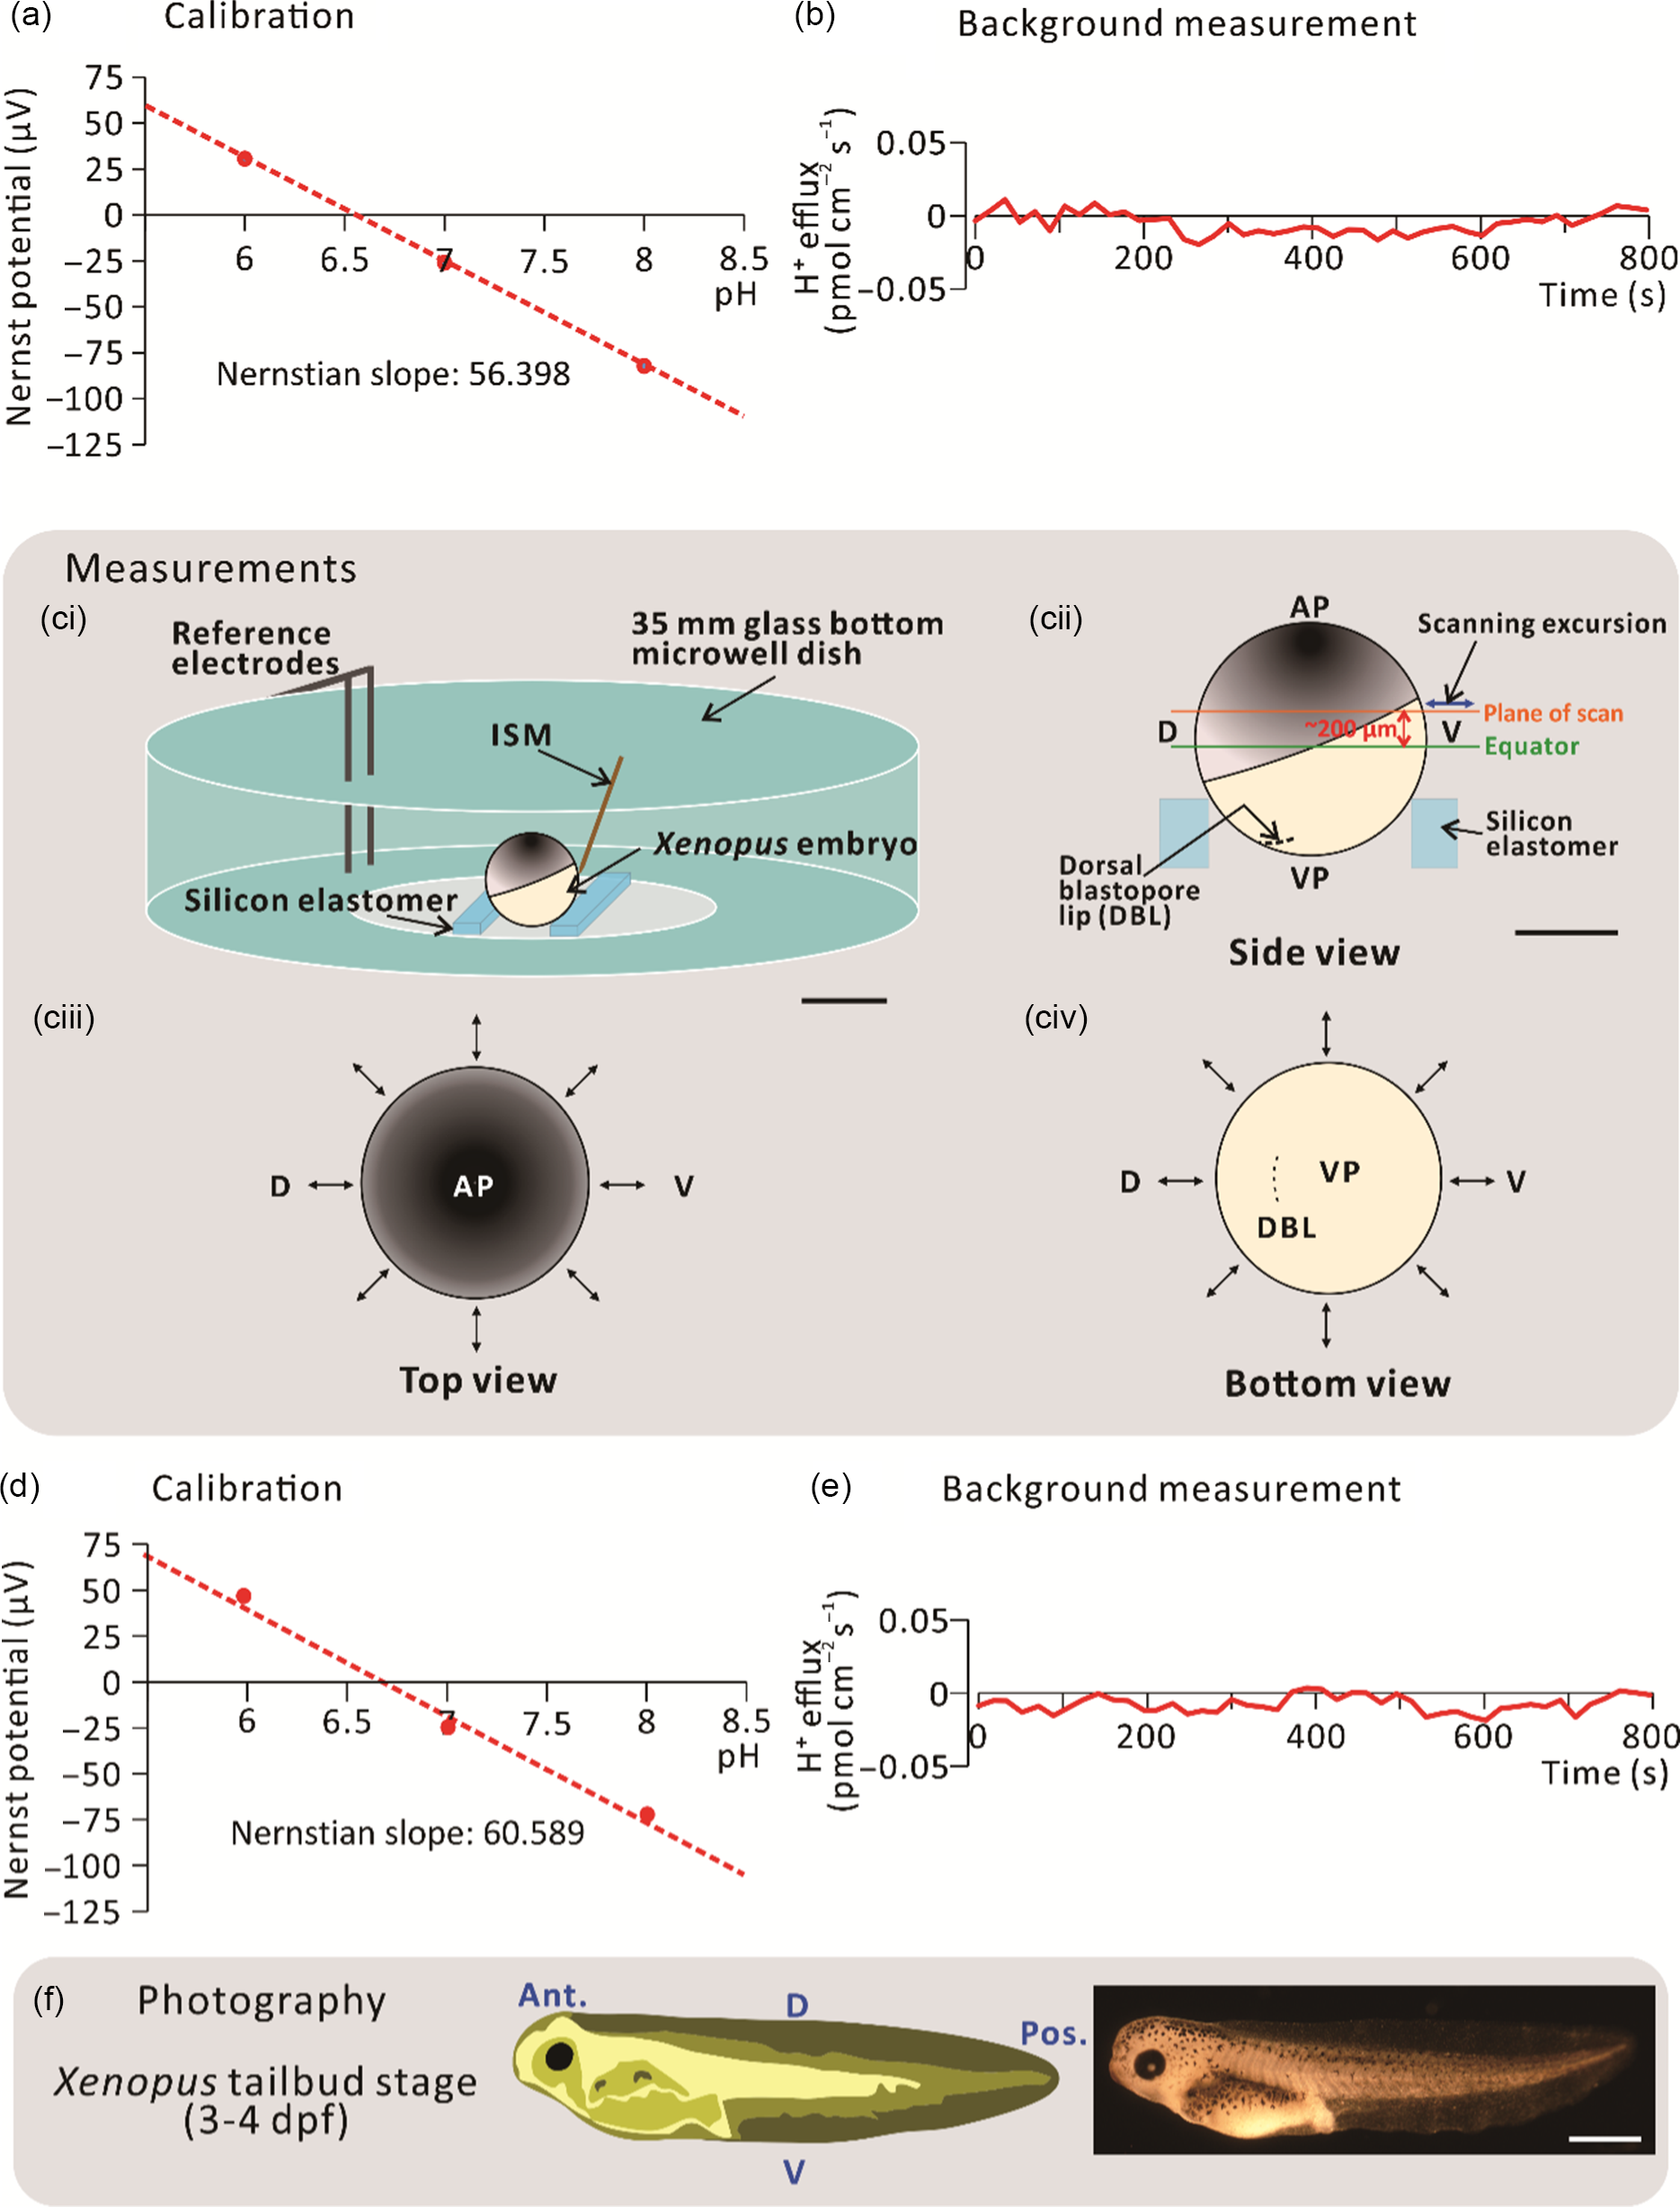
Figure 1. Schematic to show the SIET procedure. (a) An initial 3-point calibration was performed using three ‘ion standard solutions’, with a known concentration of H+. In this case, calibration was performed at pH 6, 7 and 8. (b) An initial background recording was performed in the centre of a scanning chamber in the absence of an experimental embryo. (ci) Experiments were performed in a scanning chamber made of a 35-mm glass-bottomed microwell dish with pieces of silicon elastomer in the centre. (cii) Typically, the plane of scan was set at ˜200 µm above the equator of the embryo. (ciii, civ) Images to show a representative sample scan around the embryo. Visualization at the (ciii) top and (civ) bottom of the embryo allows for precise positioning of the ion-selective microelectrode (ISM) close to the embryo surface. The ↔ symbol indicates the eight measuring positions around the circumference of embryos. (d) Recalibration and (e) background scans were also performed at the end of each experiment. (f) Scanned embryos were photographed at 3–4 dpf to ensure that they had developed normally. AP, VP, D, V, Ant., and Pos. are animal pole, vegetal pole, dorsal, ventral, anterior, and posterior, respectively. Scale bars, 1 mm (ci, f) and 500 µm (cii).
Measurement of extracellular endogenous ionic currents
Before scanning via the SIET began, a dejellied stage 9 embryo was placed in the centre of the scanning chamber mounted in a groove made between two strips of silicon elastomer (Fig. 1ci). The scanning positions of the ISM were then set at a circumferential plane ˜200 µm above the equator of the embryo using the computerized motion control system (Fig. 1cii–civ). In this way, the dorsal animal hemisphere could be scanned with the direction of ISM excursion being perpendicular to the surface of the embryo. An initial recording was acquired at a reference position ˜5 mm away from the measurement positions. This allowed any background noise to be subtracted from the ‘real’ signals generated at the embryo surface. In addition to stage 9, scans were also performed around the embryos at stages 10, 11 and 12. The direction of excursion was different at each measurement point as it had to be perpendicular to the surface of the embryo (Fig. 1cii–civ). The calibration and background values (Fig. 1d, e) were checked once again after each experiment to verify that the ISM had functioned in a Nernstian manner throughout the data collection period. After scanning, the embryos were raised until they were at 3–4 days post-fertilization (dpf) to ensure that they developed normally (Fig. 1f). No measurements were made after stage 12 because, during the neural stages (stages 13–21), embryos undergo highly dynamic movements (Vandenberg et al., Reference Vandenberg, Morrie and Adams2011), due in part to the dramatic extension of the dorsal marginal zone (Keller, Reference Keller1984). This prohibited close surface scanning due to potential damage to the delicate glass ISM.
Pharmacological treatment and in situ hybridization
The possible relationship between V-ATPase function and the development of neural structures was investigated by pharmacological means, using bafilomycin A1 (a V-ATPase antagonist; Bowman et al., Reference Bowman, Siebers and Altendorf1988). In situ hybridization was then conducted to detect the presence of the early neural gene, Zic3. The in situ hybridization method used was modified from Hemmati-Brivanlou et al. (Reference Hemmati-Brivanlou, Frank, Bolce, Brown, Sive and Harland1990). Linearized DNA fragments of pBluescript II KS-Zic3 were prepared by digestion with the restriction enzyme, BamH1, for 2–4 h at 37°C. To produce a Zic3 DIG-labelled RNA probe, in vitro transcription was then performed using the linearized pBluescript II KS-Zic3, DIG RNA labelling mix and T3 RNA polymerase (11277073910 and 11031163001; Roche Diagnostics) following the manufacturer’s instructions. The RNA pellets were then purified using phenol–chloroform extraction, as described in the manufacturer’s instructions of the mMESSAGE mMACHINE® transcription kit, and then dissolved in 20 µl RNase-free water. The final concentration of RNA synthesized was measured using a NanoDrop 1000 spectrophotometer (Thermo Fisher Scientific).
Embryos were incubated with 0.1× MMR containing either 0.5 µM bafilomycin A1 and 0.4% DMSO (EMD Millipore; stock solution: 160 µM in DMSO) or 0.4% DMSO alone (control) from ˜7 hpf to 13.25 hpf. At 13.25 hpf, the embryos were washed with 0.1× MMR for 3 × 5 min and then incubated in this same medium until they reached 24 hpf (i.e. equivalent to stage 22 in untreated, normally developing embryos). The bafilomycin A1 + DMSO-treated or DMSO-treated embryos were fixed with MEMFA solution [0.1 M MOPS (pH 7.4), 2 mM EGTA, 1 mM MgSO4 and 3.7% formaldehyde] at ˜22°C for 1 h, and then washed with 2 mM MgCl2 in PBS for 3 × 20 min. They were then dehydrated by sequential 5-min incubations through PBS containing increasing concentrations of methanol (i.e. 25%, 50%, 75% and 100%). The dehydrated embryos were stored for at least 1 week at −20°C, after which they were rehydrated by sequential 5-min incubations in PBS containing 0.1% Tween 20 (PBSTw) and decreasing concentrations (i.e. 100%, 75%, 50% and 25%) of methanol. The embryos were then permeabilized with proteinase K solution (10 µg proteinase K, 20 mM Tris (pH 7.6), 2 mM CaCl2) for 7 min. Permeabilized embryos were washed with 0.1 M triethanolamine, pH 7.8 for 2 × 5 min, and then acetylated with 0.25% acetic anhydride in 0.1 M triethanolamine for 5 min. After subsequent rinsing with PBSTw, the embryos were fixed in PBSTw containing 3.7% formaldehyde for 20 min. They were then washed with PBSTw for 5 × 5 min, and then pre-hybridized with hybridization buffer [Hyb: 50% deionized formamide, 5× saline sodium citrate (SSC), 8.7 IU heparin, 1 mg Torula RNA, 1× Denhardt’s solution, 0.1% Tween 20, 0.1% CHAPS, 50 mM EDTA] at 65°C for 4 h. The Zic3 DIG-labelled RNA probe (at 1 µg ml–1 in Hyb) was denatured at 80°C for 2 min before hybridization. Embryos were incubated with the denatured probe at 65°C overnight to allow time for it to hybridize with the endogenous target Zic3 mRNA. Embryos were then washed with Hyb for 10 min and 2× SSC for 3 × 20 min at 65°C. Non-hybridized RNA was then digested with 2 µg ml–1 RNase A in 2× SSC at 37°C for 30 min, after which embryos were washed with 2× SSC for 10 min at room temperature and 0.2× SSC at 65°C for 2 × 30 min. The embryos were then blocked with Blocking Reagent (2 g; 11096176001; Roche Diagnostics) in 1× maleic acid buffer (MAB) at room temperature for 1 h, after which they were incubated at room temperature with Blocking Reagent containing alkaline phosphatase-tagged anti-digoxigenin (11093274910; Roche Diagnostics), at a dilution of 1:4000 for 4 h. Embryos were then washed with 1× MAB overnight, after which they were stained with BM-Purple (11442074001; Roche Diagnostics) for ˜4 h until purple staining was observed. The embryos were then fixed in Fixative B (1× SSC containing 10% acetic acid and 9.25% formaldehyde) for 1 h and depigmented in bleach solution (1× SSC containing 5% formamide and 10% H2O2) for 2 h. After rinsing with 1× SSC, images were acquired using a Nikon AZ100 Multizoom microscope system.
Top-illuminated stereomicroscopy
To study the morphology of embryos and the localization of mRNA after in situ hybridization, top-illuminated microscopic images were obtained using an AZ100 Multizoom microscope system with a DS-5Mc Colour Digital Camera Head in conjunction with the Digital Sight DS-U2 microscope camera controller and ACT-1 Version 2.63 software (Nikon Instruments, Inc., Tokyo, Japan). Top illumination was provided by a Schott KL 1500 electronic light source (Schott AG, Mainz, Germany). For live imaging, embryos were anaesthetised with 0.1× MMR containing 0.2 g L–1 MS-222 just prior to imaging.
Statistical and computational analysis
IBM SPSS Statistics 23 (IBM, Armonk, NY, USA), Microsoft Office Professional Plus Excel 2013 (Microsoft Corp., Redmond, WA, USA), and CorelDRAW X8 (Corel Corp., Ottawa, ON, USA) were used for statistical analysis, graph plotting and figure preparation, respectively. Two-way analysis of variance (ANOVA) and post hoc Tukey’s honest significant difference tests were performed to analyze the significance of the data.
Results
Identification of endogenous H+ currents using the SIET
We conducted extracellular non-invasive SIET measurements around embryos between stages 9–12 (i.e. from ˜7–13.25 hpf) using an H+-specific ISM (Fig. 1). At each developmental stage, the H+ flux measurement made at a reference position ˜5 mm from the embryo surface was ˜0 pmol cm–2 s–1. In contrast, the minimum H+ efflux measured around the embryos was ˜0.1 pmol cm–2 s–1 (Fig. 2). At stage 9 (Fig. 2a), a near-constant H+ efflux of ˜0.1 pmol cm–2 s–1 was maintained at all the measuring locations around the embryos. At stage 10 (Fig. 2b), the H+ effluxes from the left (L), left dorsal (LD), dorsal (D) and right dorsal (RD) locations appeared to be slightly higher than from the other regions, but no significant differences were found between all the measurement locations around the embryos. At stage 11, the H+ efflux from the dorsal region (especially in positions LD and D) was elevated, showing values of ˜0.2 pmol cm–2 s–1, which were significantly higher than the effluxes of ˜0.1 pmol cm–2 s–1 detected on the left ventral (LV) side (Fig. 2c). At stage 12, a distinct H+ efflux of ˜0.55 pmol cm–2 s–1 was detected on the dorsal (D) side of embryos (Fig. 2d). This was significantly higher than the effluxes detected at all the other measurement positions. These same data are also presented on a radial column chart (Fig. 3), which clearly shows that there was an increase in H+ efflux from stage 9 to stage 12 in all the measurement locations, with a more prominent H+ efflux generated on the dorsal side of embryos. In addition, at stage 12 (i.e. the end of gastrulation), the H+ effluxes in the dorsal (D) and RD locations were significantly greater than those measured in the same locations between stages 9–11.
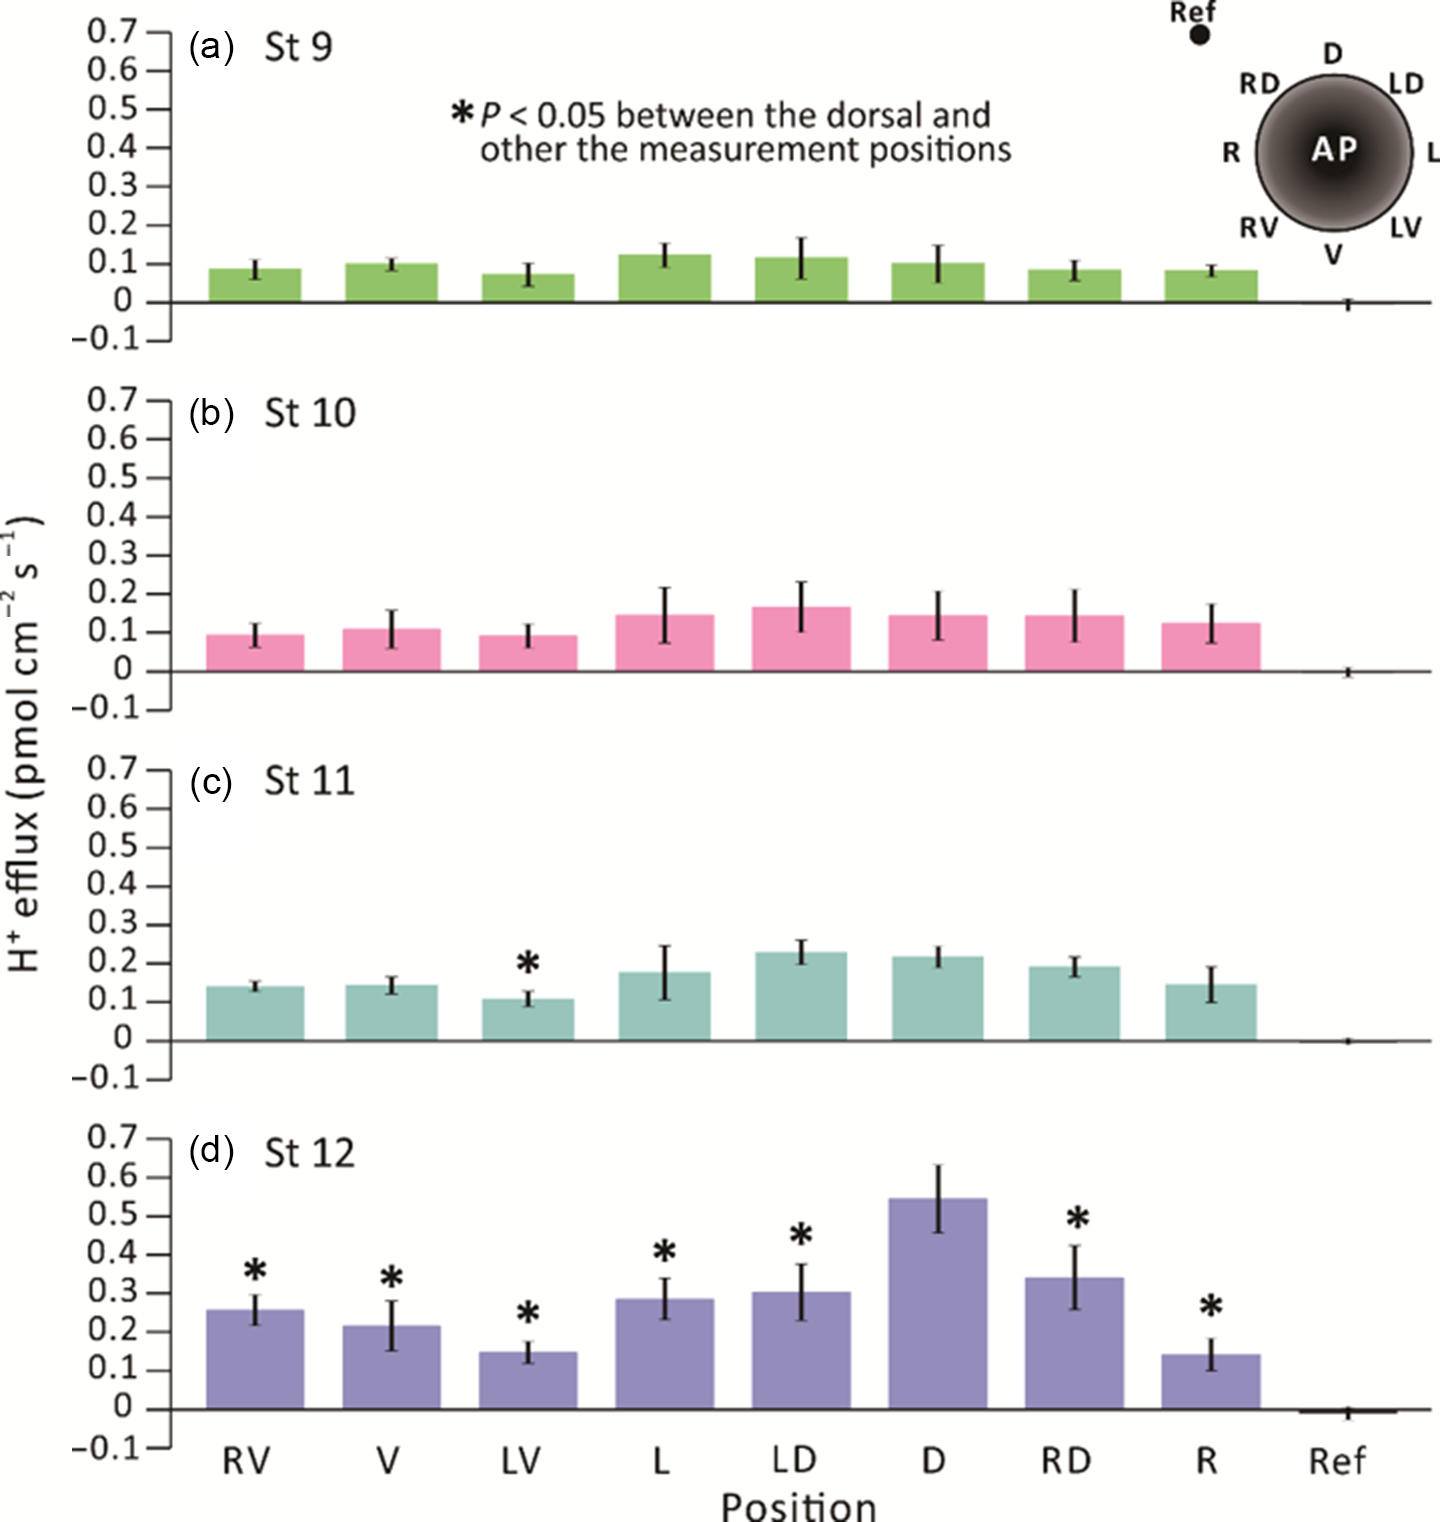
Figure 2. SIET measurements showing the H+ fluxes recorded around the equatorial circumference of X. laevis embryos from stages 9 to 12 (i.e. ˜7–13.25 hpf). H+ fluxes were measured in eight positions around embryos, as shown in the schematic on the upper right corner of panel (a). Fluxes were measured at (a) stage 9; (b) stage 10; (c) stage 11; and (d) stage 12 at an elevation of ˜200 µm above the embryonic equator. The data represent the mean ± standard error of the mean (SEM) of n = 5 embryos for each stage measured. The reference point (Ref) was measured at a distance of ˜5 mm away from the embryo. In (c) and (d), the asterisks indicate that H+ efflux data acquired around the embryo were significantly lower (P < 0.05) than those acquired on the dorsal side. Statistical significance was tested by two-way ANOVA and Tukey’s honest significant difference test.

Figure 3. Comparison of H+ flux data in different locations around the equatorial circumference of X. laevis embryos between stages 9 to 12 (i.e. ˜7–14.25 hpf). The data shown in Fig. 2 were also plotted as a radial column chart to allow comparison between the stages for each measurement position. The results show that, at stage 12, the H+ effluxes at all the measuring positions except the right side are significantly higher (P < 0.05) than those at the same side at stage 9 and stage 10. Similarly, the H+ effluxes on the right dorsal and dorsal sides at stage 12 are significantly higher (P < 0.05) than that on the same side at stage 11. Statistical significance was tested by two-way analysis of variance (ANOVA) test and Tukey’s honestly significant difference test.
Effect of bafilomycin A1 on the gross morphology and expression of Zic3 in embryos at 24 hpf
Following the discovery of a distinct H+ efflux at the dorsal animal hemisphere of embryos between stages 11 and 12, we investigated whether H+ signalling might play a role in neural induction. We treated embryos with bafilomycin A1 to block the activity of this ATP-driven H+ pump from stages 9–12, and then investigated the effect of this inhibition on the gross morphology of embryos, as well as the expression of the early neural gene Zic3 at 24 hpf. As the stock solution of bafilomycin A1 was prepared in DMSO, some embryos were treated with the same concentration of DMSO alone as controls. In the DMSO-treated control embryos, unfused and fused regions of the neural fold, as well as the cement gland and eye anlagen were all clearly visible at 24 hpf (i.e. stage 22; Fig. 4ai, 4aii, see white, blue, yellow, and black arrowheads, respectively), therefore suggesting normal development. In contrast, embryos treated with bafilomycin A1 (Fig. 4bi, 4bii), did not complete gastrulation, as shown by the obvious yolk plug at the vegetal pole (pink arrowheads). The DMSO- and bafilomycin A1-treated embryos were fixed at 24 hpf and then in situ hybridization was conducted to visualize the expression of Zic3. In the DMSO-treated embryos, Zic3 was expressed in the telencephalon, diencephalon, mesencephalon and rhombencephalon (Fig. 4c), as first described by Nakata et al. (Reference Nakata, Nagai, Aruga and Mikoshiba1997). In contrast, no Zic3 expression was detected in the bafilomycin A1-treated embryos (Fig. 4d).
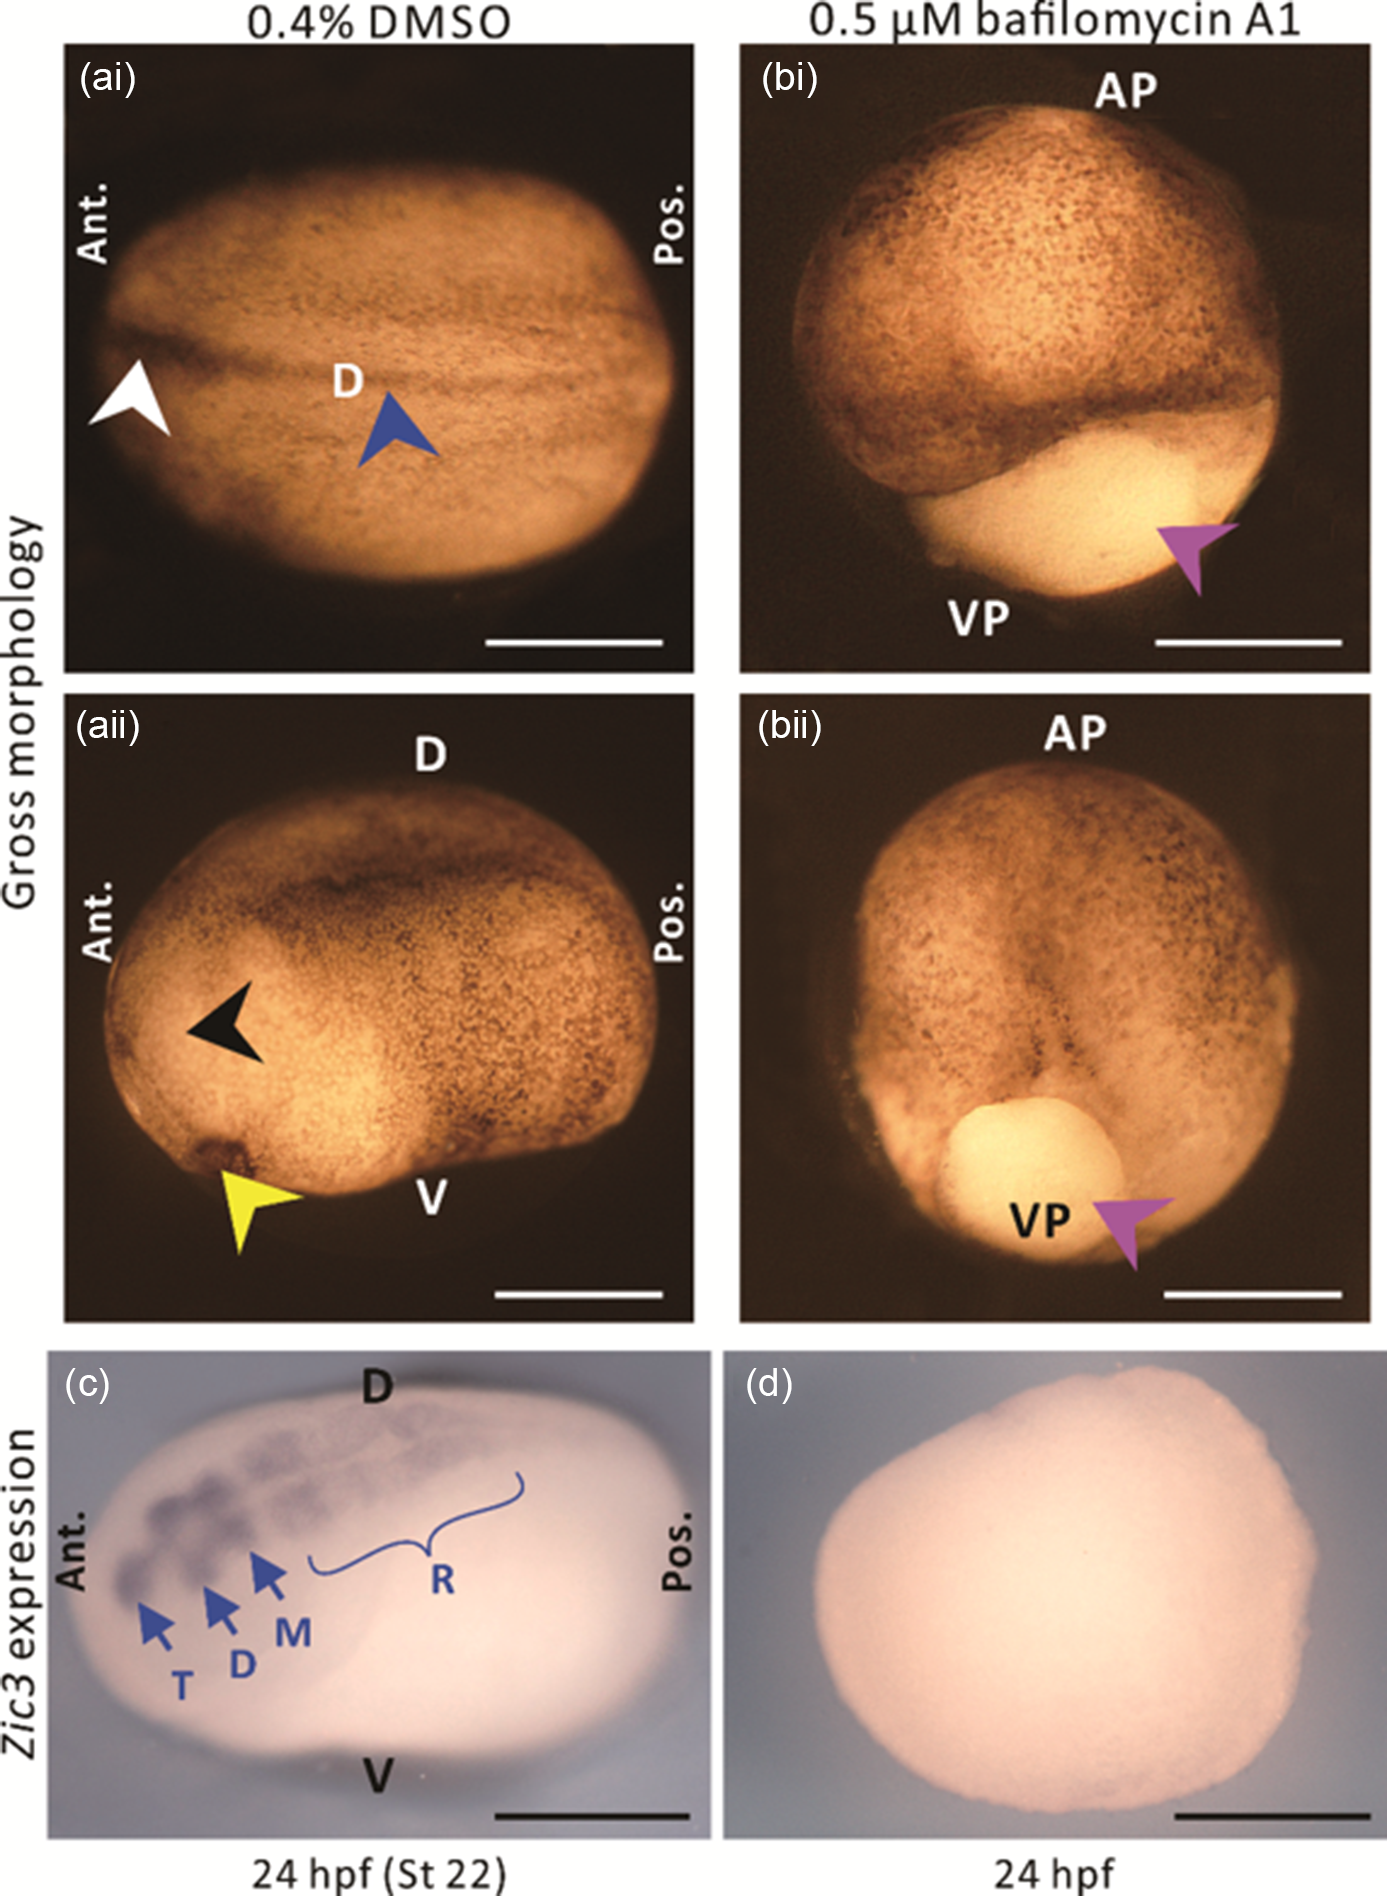
Figure 4. The effect of the V-ATPase blocker, bafilomycin A1 on the gross morphology and expression of the Zic3 gene in embryos at the neurula stage. (a, b) Gross morphology and (c, d) Zic3 gene expression of embryos treated with either (a, c) 0.4% DMSO or (b, d) 0.5 µM bafilomycin A1, from ˜7–13.25 hpf (i.e. equivalent to stages 9–12 in untreated, normally developing embryos). Embryos were fixed at ˜24 hpf (i.e. equivalent to stage 22 in untreated, normally developing embryos), and top-illuminated images were acquired either (a, b) immediately or (c, d) after in situ hybridization was conducted to detect Zic3 mRNA. Panels (ai), (aii), (bi) and (bii) show different embryos. In (ai, aii), the white, blue, black, and yellow arrowheads indicate the unfused and fused neural folds, eye anlage, and cement gland, respectively, whereas in (bi, bii), the purple arrowheads indicate the yolk plug. In (c), T, D, M and R indicate the telencephalon, diencephalon, mesencephalon and rhombencephalon, respectively. AP, VP, D, V, Ant., and Pos. are animal pole, vegetal pole, dorsal, ventral, anterior, and posterior, respectively. Scale bars, 500 µm.
Discussion
Transmembrane H+ fluxes are known to play a role in regulating the cytoplasmic pH of cells during fertilization and early animal development (Johnson and Epel, Reference Johnson and Epel1976; Gillespie and Greenwell, Reference Gillespie and Greenwell1988; Baltz et al., Reference Baltz, Biggers and Lechene1993; Faszewski and Kunkel, Reference Faszewski and Kunkel2001; Adams et al., Reference Adams, Robinson, Fukumoto, Yuan, Albertson, Yelick, Kuo, McSweeney and Levin2006; Ebanks et al., Reference Ebanks, O’Donnell and Grosell2010). Here, we applied the non-invasive extracellular SIET in an H+-sensitive configuration and demonstrated the presence of a significantly higher H+ efflux on the dorsal side of intact X. laevis embryos at stage 12 when compared with the H+ effluxes at the other measuring positions around the embryo (Figs 2 and 3). This is the first direct, truly non-invasive measurement of such a phenomenon during the late gastrula stage of X. laevis development. Our new data support and confirm those described previously, in which it was reported that X. laevis embryos exhibit an intracellular alkalinization in the dorsal ectoderm cells during neural induction (Sater et al., Reference Sater, Alderton and Steinhardt1994). In this earlier report, X. laevis planar explants loaded with the fluorescent pH indicator BCECF-dextran, were monitored by emission ratio microfluorimetry. As the increase in pHi was not detected in ectodermal cells in planar explants dissected from the ventral marginal zone or if the dorsal ectoderm was isolated from the inductive activity of the mesodermal cells, the authors suggested that it might be one of the factors required for determining the anterior neural fate of the ectoderm (Sater et al., Reference Sater, Alderton and Steinhardt1994). We suggest that this neutralizing intracellular alkalinization might, at least in part, contribute to the localized H+ efflux across the plasma membranes of the dorsal epithelial cells that we recorded.
We considered it important to confirm and extend the original data reported by Sater et al. (Reference Sater, Alderton and Steinhardt1994). For example, some problems have been reported when using BCECF-dextran to measure pHi due to prolonged photobleaching of the dye, which can result in erroneous measurements (Weiner and Hamm, Reference Weiner and Hamm1989; Han and Burgess, Reference Han and Burgess2010). However, Sater et al. (Reference Sater, Alderton and Steinhardt1994) adopted protocols to minimize possible photobleaching, such as utilizing both continuous and intermittent imaging strategies, as well as incorporating neutral density filters to reduce the intensity of the required excitation light. Another factor to consider is that the early BCECF-dextran imaging experiments were conducted ex vivo with planar embryonic explants (Keller and Danilchik, Reference Keller and Danilchik1988) rather than in intact embryos. The experimental protocol involved microinjecting the reporter dye into the dorsal blastomeres of 32-cell stage embryos, then planar explants were dissected from the dorsal or ventral marginal zones at the start of gastrulation. Furthermore, the external epithelium was removed from the planar explant prior to imaging to improve the optical conditions for microfluorimetry in the underlying layers. Any of these procedures, therefore, might have induced a pHi-related artefact. Therefore, we considered it important to conduct our experiments in intact, normally developing embryos. However, despite the differences in protocol, the similarities between the BCECF-dextran data reported by Sater et al. (Reference Sater, Alderton and Steinhardt1994) and our new SIET-derived data with respect to the spatial nature of the embryonic domain generating the efflux of H+ (and the developmental time window), suggest that the localized H+ flux is a reproducible phenomenon associated with neural induction in X. laevis. In addition, this suggests that the precautions taken by Sater et al. (Reference Sater, Alderton and Steinhardt1994) to limit the deleterious effects of photobleaching (and therefore dye reliability) were largely successful. Furthermore, the ability to recapitulate a developmental event from an intact embryo in an embryonic tissue explant illustrates the robust nature of X. laevis embryos as a developmental model (DeSimone et al., Reference DeSimone, Davidson, Marsden and Alfandari2005). It also demonstrates that tissue explants are effective ex vivo models for deciphering the complex three-dimensional signalling events that take place between different tissue layers (Keller and Danilchik, Reference Keller and Danilchik1988).
Proton pumping vacuolar-ATPases (V-ATPases) have diverse functions from acidifying the lumen of a variety of intracellular organelles (Futai et al., Reference Futai, Sun-Wada, Wada, Matsumoto and Nakanishi-Matsui2019; Banerjee and Kane, Reference Banerjee and Kane2020) to generating H+ effluxes across the plasma membranes of different cell types (Nanda et al., Reference Nanda, Brumell, Nordström, Kjeldsen, Sengeløv, Borregaard, Rotstein and Grinstein1996; Wagner et al., Reference Wagner, Finberg, Breton, Marshansky, Brown and Geibel2004; Jouhou et al., Reference Jouhou, Yamamoto, Homma, Hara, Kaneko and Yamada2007). As such, they play a key role in the regulation of intracellular and intercellular signalling pathways (Pamarthy et al., Reference Pamarthy, Kulshrestha, Katara and Beaman2018). For example, an active V-ATPase was reported to be expressed in the plasma membrane of X. laevis embryos as early as the 4-cell stage, where it was shown to play a key role in the left–right patterning of the embryo (Adams et al., Reference Adams, Robinson, Fukumoto, Yuan, Albertson, Yelick, Kuo, McSweeney and Levin2006). It has been suggested that the function of such a V-ATPase-dependent H+ efflux is to hyperpolarize the plasma membrane and increase the pH of the cytoplasm (Swallow et al., Reference Swallow, Grinstein and Rotstein1990; Adams et al., Reference Adams, Robinson, Fukumoto, Yuan, Albertson, Yelick, Kuo, McSweeney and Levin2006; Vandenberg et al., Reference Vandenberg, Morrie and Adams2011). Considering these reports, we treated X. laevis embryos with the specific V-ATPase inhibitor, bafilomycin A1 (Yoshimori et al., Reference Yoshimori, Yamamoto, Moriyama, Futai and Tashiro1991), from stages 9 to 12, and therefore began to explore the possible function(s) of the late gastrula period H+ efflux we detected. The inhibition of V-ATPase activity during this key developmental period led to a variable level of inhibition of blastopore closure and the subsequent failure to form early neural structures (Fig. 4b). Clearly, treatment with bafilomycin A1 will inhibit all the cellular V-ATPases located in the plasma membrane as well as those of the intracellular organelles, and therefore may result in numerous secondary developmental and physiological effects. For example, they are known to attenuate two-pore channel-mediated Ca2+ release from lysosomes (Patel et al., Reference Patel, Marchant and Brailoiu2010). This might, in turn, result in various developmental defects including those that arise during neurogenesis (Guo et al., Reference Guo, Webb, Chan and Miller2020). A similar finding has previously been described when X. laevis embryos were treated with bafilomycin for 24 h starting at the 2-cell stage; this led to an inhibition of gastrulation and convergent extension movements (Coombs et al., Reference Coombs, Yu, Canning, Veltri, Covey, Cheong, Utomo, Banerjee, Zhang, Jadulco, Concepcion, Bugni, Harper, Mihalek, Jones, Ireland and Virshup2010). We showed that bafilomycin A1 treatment also led to the downregulation of Zic3 expression (Fig. 4d). This suggests that V-ATPase activity and pHi might also play an important signalling role during the gastrula period with regards to neural gene expression. It is not possible at this time to determine if bafilomycin A1 had a direct effect on the signal transduction pathway leading to the expression of Zic3, or if the effect was secondary; for example, resulting from a cessation of the morphogenic movements that contributed to gastrulation. However, it is becoming clear that neural induction is regulated via a complex interplay between cell-to-cell signalling, inductive interactions, morphogenetic movements, and localized gene expression (Keller et al., 1992; Nakata et al., Reference Nakata, Nagai, Aruga and Mikoshiba1997; Muñoz-Sanjuán et al., Reference Muñoz-Sanjuán, Bell, Altmann, Vonica and Brivanlou2002; Leclerc et al., Reference Leclerc, Néant and Moreau2012; Stern, Reference Stern2006; Néant et al., Reference Néant, Leung, Webb, Miller, Moreau and Leclerc2019). It will, therefore, require careful and extended experimentation to decipher exactly where and when the H+ fluxes occur (perhaps at various times and in different intracellular and/or embryonic locations) during the extended process of neural induction and subsequent neurogenesis. For example, it has been shown via the use of voltage and pH dyes, that a wave of bioelectrical activity travels across the ectoderm of intact X. laevis embryos during neurulation, and that inhibiting V-ATPases leads to abnormalities in craniofacial morphogenesis (Vandenberg et al., Reference Vandenberg, Morrie and Adams2011). Furthermore, it has been demonstrated that a V-ATPase is expressed strongly in the neural tissues and head of X. laevis during the later tail bud stages (Rutenberg et al., Reference Rutenberg, Cheng and Levin2002).
We did not investigate the effect of bafilomycin A1 on the dorsal H+ fluxes. However, it has previously been reported that H+ fluxes measured using a SIET similar to ours across the pseudostratified epithelium in the proximal region of the vas deferens in rat (Breton et al., Reference Breton, Ruan, Park and Kim2016), were drastically reduced by treatment with bafilomycin A1 (Smith and Trimarchi, Reference Smith and Trimarchi2001). Bafilomycin A1 has also been shown to reduce [H+] gradients (again measured using a similar SIET to ours), in the anterior midgut of mosquito (Aedes sp.) larvae (Boudko et al., Reference Boudko, Moroz, Linser, Trimarchi, Smith and Harvey2001). Moreover, in X. laevis embryos, concanamycin (another specific H+-V-ATPase inhibitor; Whyteside et al., Reference Whyteside, Meek, Ball, Dixon, Finbow, Kee, Findlay and Harrison2005) was shown to reduce the efflux of H+ (and block the formation of left–right asymmetry) during early development (Adams et al., Reference Adams, Robinson, Fukumoto, Yuan, Albertson, Yelick, Kuo, McSweeney and Levin2006). This suggests that the H+ fluxes we recorded are likely to also be inhibited by an H+-V-ATPase inhibitor such as bafilomycin A1 (or concanamycin).
V-ATPase activity has also been shown to be required for (and in some situations it might directly regulate) Wnt signalling (Cruciat et al., Reference Cruciat, Ohkawara, Acebron, Karaulanov, Reinhard, Ingelfinger, Boutros and Niehrs2010; Sun-Wada and Wada, Reference Sun-Wada and Wada2015; Oginuma et al., Reference Oginuma, Harima, Tarazona, Diaz-Cuadros, Michaut, Ishitani, Xiong and Pourquié2020). In addition, a Wnt signal at the cleavage stage in X. laevis embryos has been reported to play a role in activating subsequent neural development (Baker et al., Reference Baker, Beddington and Harland1999). It has also been proposed that binding of the Wnt ligand to the Wnt receptor complex requires a V-ATPase-mediated H+ efflux (Sun-Wada and Wada, Reference Sun-Wada and Wada2015) and that bafilomycin A1 inhibits Wnt signalling (Cruciat et al., Reference Cruciat, Ohkawara, Acebron, Karaulanov, Reinhard, Ingelfinger, Boutros and Niehrs2010). Therefore, the precise relationship between V-ATPase activity, H+ efflux, and Wnt signalling is still far from clear. Our new data, however, add to the growing evidence first proposed by Sater et al. (Reference Sater, Alderton and Steinhardt1994) for an increase in pHi via a V-ATPase-mediated H+ efflux playing a role in regulating neural induction in X. laevis embryos. It has, however, also been reported in tail bud cells from chick embryos that increased pHi promotes acetylation of non-enzymatic β-catenin downstream of Wnt signalling (Oginuma et al., Reference Oginuma, Harima, Tarazona, Diaz-Cuadros, Michaut, Ishitani, Xiong and Pourquié2020), and that acetylated β-catenin promotes mesodermal rather than neural fate (Hoffmeyer et al., Reference Hoffmeyer, Junghans, Kanzler and Kemler2017). There is, therefore, still much to understand with regards to the relationship between pHi dynamics and Wnt signalling during the different phases of neurogenesis in different embryonic domains. In addition to accumulating evidence suggesting the function of a V-ATPase-driven H+ extrusion across the plasma membrane, alternate complementary mechanisms might also play a role in the alkalinization of dorsal ectoderm cell cytoplasm during neural induction. These include Na+/H+ exchange and Na+-dependent Cl–/HCO3 – exchange. While the former has been reported during fertilization in sea urchin eggs and in preimplantation mouse embryos (Epel, Reference Epel1980; Siyanov and Baltz, Reference Siyanov and Baltz2013), it does not appear to play a role in the early development of X. laevis embryos (Webb and Nuccitelli 1981; Sater et al., Reference Sater, Alderton and Steinhardt1994). For example, when dorsal marginal zone explants were treated with the protein kinase C and Na+/H+ exchange agonist TPA (12-O-tetradecanoyl phorbol-13-acetate), the cells experienced an immediate decrease (rather than the expected increase) in pHi and the explants dissociated rapidly (Sater et al., Reference Sater, Alderton and Steinhardt1994). There is, however, evidence for a role for Na+-dependent Cl–/HCO3 – exchange in the alkalinization that occurs during neural induction in X. laevis embryos. For example, when explants at early stage 10.5 were treated with the anion transport inhibitor 4,4′-dihydrodiisothiocyanatostilbene-2,2′-disulfonate, or when the [Na+] and [Cl–] in the bathing solution was decreased and increased, respectively, then the normal increase in pHi and tissue-specific expression of the neural gene engrailed-2 were both blocked (Sater et al., Reference Sater, Alderton and Steinhardt1994).
It is still unknown if the V-ATPase-generated H+ fluxes mediate their effect via hyperpolarization of the plasma membrane or due to an alkalization of the cytoplasm of dorsal ectoderm cells, or indeed via a combination of both processes. Although it has been reported that H+ pump-dependent changes in membrane voltage are an early and necessary mechanism to induce X. laevis tail regeneration (Adams et al., Reference Adams, Masi and Levin2007), we suggest that the relatively long lasting slow-changing H+ fluxes we recorded are likely to be involved in the intracellular alkalinization that has been reported to be important for some early development processes in several species (Winkler et al., Reference Winkler, Steinhardt, Grainger and Minning1980; Baltz et al., Reference Baltz, Biggers and Lechene1993; Phillips et al., Reference Phillips, Léveillé, Claman and Baltz2000).
It has previously been reported from X. laevis embryos that localized, intracellular Ca2+ transients triggered by planar signals can induce the expression of the Zic3 gene in the dorsal ectoderm during neural induction (Leclerc et al., Reference Leclerc, Lee, Webb, Moreau and Miller2003; Batut et al., Reference Batut, Vandel, Leclerc, Daguzan, Moreau and Néant2005; Néant et al., Reference Néant, Leung, Webb, Miller, Moreau and Leclerc2019). We propose that an increase in pHi might be associated in some required/synergistic way with these Ca2+ transients to induce the expression of important early primary genes known to regulate the subsequent expression of other essential neural genes (Nakata et al., Reference Nakata, Nagai, Aruga and Mikoshiba1997; Winata et al., Reference Winata, Kondrychyn, Kumar, Srinivasan, Orlov, Ravishankar, Prabhakar, Stanton, Korzh and Mathavan2013). Such ionic and multi-step regulation of gene expression is well recognized (Vanden Broeck et al., Reference Vanden Broeck, De Loof and Callaerts1992; Calkhoven and Ab, Reference Calkhoven and Ab1996). Indeed, it has previously been reported that when X. laevis dorsal marginal zone planar explants were treated with the anion transport inhibitor 4,4′-dihydrodiisothiocyanatostilbene-2,2′-disulfonate to block the normal intracellular alkalinization, then the expression of neural-specific genes (i.e. NCAM and otx2) were either reduced or completely missing (Uzman et al., Reference Uzman, Patil, Uzgare and Sater1998). In addition, when uninduced animal cap ectoderm was precociously alkalinized by treatment with methylamine or NH4Cl, then NCAM, otx2 and noggin (an anterior neural inducer gene) were all expressed. Furthermore, alkalinization of the ectoderm at stage 10.5 elicited a rapid increase (i.e. within ˜15 min) in the expression of otx2 (Uzman et al., Reference Uzman, Patil, Uzgare and Sater1998).
It is also known that gap junction conductance is sensitive to pHi (Spray et al., Reference Spray, Harris and Bennett1981; Peracchia, Reference Peracchia2004) and it has been suggested that localized Ca2+ transients generated in the anterior dorsal ectoderm, which that are required for neural induction, might pass from cell to cell through gap junctions (Leclerc et al., Reference Leclerc, Webb, Daguzan, Moreau and Miller2000, Reference Leclerc, Néant and Moreau2012; Belousov and Fontes, Reference Belousov and Fontes2013). We suggest that this might, therefore, provide a link between Ca2+ and H+ being involved in the synergistic regulation of Zic3 expression and subsequent neural induction in the dorsal ectoderm of X. laevis embryos. This adds another layer of complexity to the interaction between the multiple ectodermal and endomesodermal signals (including Chordin, Noggin, BMP4, Wnts, β-catenin, Cerberus, various Ca2+ channels and H+) and gene expression, which combine to regulate the complex process of neural induction in X. laevis (Sater et al., Reference Sater, Alderton and Steinhardt1994; Baker et al., Reference Baker, Beddington and Harland1999; Kuroda et al., Reference Kuroda, Wessely and De Robertis2004; Stern, Reference Stern2006; Moreau et al., Reference Moreau, Néant, Webb, Miller and Leclerc2008, Reference Moreau, Webb, Néant, Miller and Leclerc2009, Reference Moreau, Leclerc and Néant2020; Cho et al., Reference Cho, Tang, Davila, Deng, Chen, Miller, Wernig and Graef2014; Néant et al., Reference Néant, Leung, Webb, Miller, Moreau and Leclerc2019). Our new data therefore add to the accumulating evidence that suggests that intracellular alkalinization might contribute to establishing anterior neural fate in X. laevis embryos.
Acknowledgements
We thank Chris Shipley of Applicable Electronics, LLC (New Haven, CT, USA) and Eric Karplus of Science Wares Inc., (Falmouth, MA, USA) for donating equipment or software, and for technical support. We also thank H. Benjamin Peng and Frances SL Chan (Division of Life Science, HKUST) for teaching HCL the Xenopus laevis handling techniques described, and Isabelle Néant (CNRS, Université Paul Sabatier) for providing advice on the in situ hybridization protocol.
Financial support
This work was supported by the Hong Kong Research Grants Council General Research Fund (ALM, grant numbers 16100115, 16100719). We also acknowledge funding from the Hong Kong Innovation and Technology Commission (ITCPD/17-9).
Conflict of interest
The authors declare none.
Ethical approval
All the procedures used in this study were performed in accordance with the guidelines and regulations set out by the Animal Ethics Committee of the HKUST and by the Department of Health, Hong Kong.


 Open access