


Introduction
The cultivated peanut (Arachis hypogaea L.) is an allotetraploid (AABB) that originated in South America (Seijo et al., Reference Seijo, Lavia, Fernández, Krapovickas, Ducasse, Bertioli and Moscone2007; Bertioli et al., Reference Bertioli, Jenkins, Clevenger, Dudchenko, Gao, Seijo, Leal-Bertioli, Ren, Farmer, Pandey, Samoluk, Abernathy, Agarwal, Ballén-Taborda, Cameron, Campbell, Chavarro, Chitikineni, Chu, Dash, El Baidouri, Guo, Huang, Kim, Korani, Lanciano, Lui, Mirouze, Moretzsohn, Pham, Shin, Shirasawa, Sinharoy, Sreedasyam, Weeks, Zhang, Zheng, Sun, Froenicke, Aiden, Michelmore, Varshney, Holbrook, Cannon, Scheffler, Grimwood, Ozias-Akins, Cannon, Jackson and Schmutz2019, Reference Bertioli, Abernathy, Seijo, Clevenger and Cannon2020). This legume is grown on 23 million hectares, with a global production of 47.10 million metric tonnes (FAOSTAT, 2019). It is an important row crop rich in oil, protein, vitamins and micronutrients (Settaluri et al., Reference Settaluri, Kandala, Puppala and Sundaram2012), consumed worldwide as nuts, candy, peanut butter and oil. Cultivated peanut has been subject to intensive selection, resulting in favourable changes in yield, biochemical composition, and other agronomic traits (Holbrook and Stalker, Reference Holbrook and Stalker2003; Anderson et al., Reference Anderson, Holbrook and Timper2006; Anderson and Harvey, Reference Anderson and Harvey2006, p. 467; Mallikarjuna and Varshney, Reference Mallikarjuna and Varshney2014).
The low genetic variability of the commercial varieties of peanuts can be attributed to a single hybridization event that occurred approximately 10,000 years ago, followed by chromosome duplication, and most of them share common ancestors (Halward et al., Reference Halward, Stalker, Larue and Kochert1991, Reference Halward, Stalker, LaRue and Kochert1992; Seijo et al., Reference Seijo, Lavia, Fernández, Krapovickas, Ducasse and Moscone2004, Reference Seijo, Lavia, Fernández, Krapovickas, Ducasse, Bertioli and Moscone2007; Grabiele et al., Reference Grabiele, Chalup, Robledo and Seijo2012; Moretzsohn et al., Reference Moretzsohn, Gouvea, Inglis, Leal-Bertioli, Valls and Bertioli2013; García et al., Reference García, Ortiz, Silvestri, Custodio, Moretzsohn and Lavia2020). According to Stalker (Reference Stalker1997), Isleib et al. (Reference Isleib, Holbrook and Gorbet2001) and Ren et al. (Reference Ren, Jiang, Yan, Chen, Zhou, Lei, Huang, Yan, Qi, Wei and Liao2014), these events resulted in a limited genetic foundation for the creation of novel varieties with enhanced agronomic traits, primarily with resistance to the new agricultural stresses brought on by pests, diseases, and environmental challenges. In contrast, the wild Arachis species exhibit a high degree of interspecific genetic variability, making them significant reservoirs of genes that confer resistance against various pests, illnesses, and environmental stress (Stalker, Reference Stalker2017; Kumar and Kirti, Reference Kumar and Kirti2023, p. 2). Successful transfers of some resistances, such as those against nematodes (Meloidogyne arenaria), early and late leaf spot (Cercospora arachidicola and Phaeoisariopsis personata), Sclerotinia Blight (Sclerotinia minor), and peanut smut (Thecaphora frezzii), to commercial and experimental tetraploid genotypes are becoming a common breeding programme tactic (Stalker and Moss, Reference Stalker and Moss1987; Pasupuleti et al., Reference Pasupuleti, Nigam, Pandey, Nagesh and Varshney2013; Stalker, Reference Stalker2017; de Blas et al., Reference de Blas, Bressano, Teich, Balzarini, Arias, Manifesto, Costero, Oddino, Soave, Soave, Buteler, Massa and Seijo2019; Ballén-Taborda et al., Reference Ballén-Taborda, Chu, Ozias-Akins, Holbrook, Timper, Jackson, Bertioli and Leal-Bertioli2022; Rosso et al., Reference Rosso, de Blas, Massa, Oddino, Giordano, Seijo, Arias, Soave, Soave, Buteler and Bressano2023).
Due to the genetic barrier imposed by the diploid condition of most of the wild Arachis species, the artificial production of synthetic amphidiploids chromosomally compatible with A. hypogaea is necessary for the successful transfer of desirable agronomical traits from wild species to cultivated peanuts (Simpson, Reference Simpson1991; Simpson and Starr, Reference Simpson and Starr2001; Fávero et al., Reference Fávero, Simpson, Valls and Vello2006; de Blas et al., Reference de Blas, Bressano, Teich, Balzarini, Arias, Manifesto, Costero, Oddino, Soave, Soave, Buteler, Massa and Seijo2019; Ballén-Taborda et al., Reference Ballén-Taborda, Chu, Ozias-Akins, Holbrook, Timper, Jackson, Bertioli and Leal-Bertioli2022; Rosso et al., Reference Rosso, de Blas, Massa, Oddino, Giordano, Seijo, Arias, Soave, Soave, Buteler and Bressano2023). The crossing of these amphidiploids with elite varieties generates a series of undirected chromosomal recombinations that could introgress a set of genes, in addition to the desired ones, that may modify the chemical composition of the desirable wild peanuts.
Chemical composition influences the flavour and texture of peanuts and peanut products (Ahmed and Ali, Reference Ahmed and Ali1986; Arya et al., Reference Arya, Salve and Chauhan2016; Bonku and Yu, Reference Bonku and Yu2020), two of the aspects of sensory quality most often mentioned as important by industry and consumers. Therefore, the development of peanut cultivars whose seed chemical composition profiles do not vary greatly from those of existing cultivars is desirable. It is well documented that peanut chemical composition is influenced by several groups of variables, including environmental and genetic factors (cultivars or breeding lines) (Tai and Young, Reference Tai and Young1975; Grosso et al., Reference Grosso, Lamarque, Maestri, Zygadlo and Guzmán1994; Dwivedi et al., Reference Dwivedi, Nigam and Rao2000; Andersen and Gorbet, Reference Andersen and Gorbet2002; Isleib et al., Reference Isleib, Tillman, Pattee, Sanders, Hendrix and Dean2008; Sithole et al., Reference Sithole, Ma, Qin, Liu and Wang2022). To meet industrial and consumer demands, it is necessary to maintain the nutritional quality of grains while introducing resistant traits from wild Arachis species into elite cultivars. In this regard, the introduction of traits from wild species into new resistant cultivars presents significant challenges, especially those pertaining to chemical composition (Anderson et al., Reference Anderson, Holbrook and Timper2006). One way to measure the chemical composition of individual components of food, feed ingredients, biomass, and other materials is through proximate analysis. This analysis disassembles a sample into smaller parts, such as ash, protein, fat, moisture, and fibre (Suárez-Ruiz and Ward, Reference Suárez-Ruiz and Ward2008). They are important chemical composition traits due to their significant impact on the quality and shelf life of peanuts and their products, which breeding programmes take into account the most (Norden et al., Reference Norden, Gorbet, Knauft and Young1987; Chu et al., Reference Chu, Holbrook and Ozias-Akins2009, pp. 1–2; Pandey et al., Reference Pandey, Monyo, Ozias-Akins, Liang, Guimarães, Nigam, Upadhyaya, Janila, Zhang, Guo, Cook, Bertioli, Michelmore and Varshney2012; Reference Pandey, Wang, Qiao, Feng, Khera, Wang, Tonnis, Barkley, Wang, Holbrook, Culbreath, Varshney and Guo2014; Davis et al., Reference Davis, Price, Dean, Sweigart, Cottonaro and Sanders2016, pp. 3–5; Li et al., Reference Li, Yoo, Lee, Sung, Noh, Hwang, Desta and Lee2022; Tang et al., Reference Tang, Qiu, Hu, Li, Wu, Wang, Li, Li, Zhu, Sui, Wang and Qiao2022). Regarding the fatty acid composition of peanut seeds, two recessive genes, ahFAD2A and ahFAD2B (ol1 and ol2), largely regulate the highest oleic:linoleic acid ratio (O/L). High oleic/linoleic ratio and low iodine values indicate enhanced oil stability and prolonged peanut shelf-life (Branch et al., Reference Branch, Nakayama and Chinnan1990) and are key indicators for the peanut industry because they are crucial for assessing peanut oil stability (Ahmed and Young, Reference Ahmed and Young1982; Branch et al., Reference Branch, Nakayama and Chinnan1990). The appeal of high oleic acid stems from its tenfold greater antioxidative stability compared to linoleic acid, delaying the onset of a rancid taste in seeds. Beyond contributing to a longer shelf life, high oleic acid has additional health benefits, including reducing blood LDL levels, suppressing tumorigenesis, and ameliorating inflammatory diseases (O'Keefe et al., Reference O'Keefe, Wiley and Knauft1993; O'Byrne et al., Reference O'Byrne, Knauft and Shireman1997; Bolton and Sanders, Reference Bolton and Sanders2002), thereby playing a crucial role in human health.
To help improve chemical traits in peanuts and other oil crops, molecular markers have been used to identify quantitative trait loci (QTL) or chromosomal regions associated with the content of protein, oleic and linoleic fatty acids, and seed oil (Sarvamangala et al., Reference Sarvamangala, Gowda and Varshney2011; Eskandari et al., Reference Eskandari, Cober and Rajcan2013; Pandey et al., Reference Pandey, Wang, Qiao, Feng, Khera, Wang, Tonnis, Barkley, Wang, Holbrook, Culbreath, Varshney and Guo2014; Hu et al., Reference Hu, Zhang, Miao, Cui, Shen, Yang, Xu, Chen, Chi, Zhang and Chen2018). As part of a pre-breeding programme to introgress resistance to multiple diseases like sclerotinia blight, peanut smut, and late and early leaf spot, three wild Arachis species were used to develop a synthetic amphidiploid [(A. correntina × A. cardenasii) × A. batizocoi] 4 × (de Blas et al., Reference de Blas, Bressano, Teich, Balzarini, Arias, Manifesto, Costero, Oddino, Soave, Soave, Buteler, Massa and Seijo2019) with a genome composition of AABK. The amphidiploid and an experimental elite line of A. hypogaea were crossed to create a population of recombinant inbred lines (RILs) that underwent nine generations of development. The purpose of this study is to examine the impact on seed composition of using a single artificial amphidiploid in breeding programmes to introduce wild traits into elite lines of peanuts. We use the F7:9 lines of the above-mentioned RIL population to (1) characterize the proximate chemical composition and fatty acids of 103 lines of an interspecific RIL population, (2) investigate the frequency of genotypes in the RIL population for the AhFAD2A and AhFAD2B genes, (3) perform QTL detection for the major chemical traits using the ‘Axiom_Arachis 2’ 48K SNP genotyping platform, and (4) determine the phenotypic segregation pattern of the high oleic trait in the RIL population.
Materials and methods
Plant material
For all experiments in this work, seeds from 103 RIL were obtained by crossing a synthetic amphidiploid JS1806 (male), herein referred to as the amphidiploid, with a smut susceptible high-oleic (HO) A. hypogaea experimental elite line JS17304-7-B (female), herein referred to as the cultivated parent (de Blas et al., Reference de Blas, Bressano, Teich, Balzarini, Arias, Manifesto, Costero, Oddino, Soave, Soave, Buteler, Massa and Seijo2019). All of the experiments also included seeds from the cultivated elite line, the amphidiploid, and the wild progenitors of the amphidiploid [A. cardenasii Krapov. & W.C. Greg (KSSc 36015), A. correntina (Burkart) Krapov. & W.C. Greg (K 11905), and A. batizocoi Krapov. & W.C. Greg (K 9484)]. Seeds of the RIL were harvested over three years: 2015, 2016, and 2017 (F7:F9). Every year, the sowing was done at the beginning of November and the harvest at the beginning of April. Seeds were conserved at -20 °C until evaluation. For genotypic analysis of AhFAD2 genes, seeds of cv. Granoleico and A. ipaënsis were used as controls for [high oleic (HO)] and wild-type (WT) conditions, respectively. Seeds of the wild diploid species used in this study were obtained from the Instituto de Botánica del Nordeste, Corrientes, Argentina (IBONE) and the Instituto Nacional de Tecnología Agropecuaria, Estación Experimental Agropecuaria (INTA), Manfredi, Córdoba, Argentina. The voucher specimens of the original collections are deposited in the Herbarium of the Instituto de Botánica del Nordeste, Corrientes, Argentina (CTES). All wild materials were collected between 1958 and 1977 in Argentina and Bolivia before the Convention on Biological Diversity (CBD 1992, https://treaties.un.org) and deposited in national and international seed banks. Seeds of the A. hypogaea experimental elite line JS17304-7-B and amphidiploid JS1806 were provided by Criadero el Carmen S.A. for research purposes. They were cultivated in the experimental field of this peanut nursery, located in General Cabrera, Córdoba, Argentina. All field assays were conducted in accordance with local legislation (Law No. 9164, Decree 132/05). The experimental design included three complete randomized blocks, from which each block was considered a genotype replicate.
Determination of oil, ash, protein, raw fibre and total sugar contents
Composite samples totaling 60 g for each genotype were created by combining three sub-samples from each field replicate (block) across all harvested years (2015–2017) and their respective field replicates. Owing to the diminutive size of the seeds, samples from wild species and the amphidiploid consisted of 10 g of seeds harvested from each experimental plot.
Proximate analysis
Each genotype was evaluated for oil, ash, protein and carbohydrate content. Seeds belonging to the composite samples were milled, and oil was extracted for 8 h with petroleum ether (30–60°C, boiling range) in a Soxhlet apparatus. The extracted oils were kept to obtain fatty acid methyl esters by transmethylation. The oil, ash, protein, raw fiber, and total sugar contents were measured using a near-infrared spectroscopy (NIRS) device, Model DA 1650, standardized by ISO 12099 for NIRS analysis with a 256-pixel detector InGaAs array diode and a spectral resolution from 0.5 to 2.0 nm data point-1 at a 1100–1650 nm wavelength (FOSS, Hilleroed, Denmark). The NIRS proximate composition measurement consisted of an average of eight replicates of each seed sample. The procedure was repeated twice to obtain a second and third mean value for each parameter measured.
Fatty acid analysis
Fatty acid methyl esters (FAME) were obtained by transmethylation using a 3% solution of sulfuric acid in methanol (Martín et al., Reference Martín, Grosso, Nepote and Grosso2018). The FAME of each genotype was analyzed by gas chromatography on a Clarus 600 (Perkin-Elmer®) equipped with a flame ionization detector (FID). An AT-Wax superox II (Alltech, Deerfield, IL) capillary column (30 m × 0.25 mm i.d.) was used. Column temperature was programmed from 180°C (held for 10 min) to 250°C (4°C min−1). The injector temperature was 250°C. The carrier (nitrogen) had a flow rate of 1 ml min−1. The separated FAME were identified by comparing their retention times with those of standard samples (Sigma Chemical Co.). Quantitative analysis of the fatty acids was performed using an internal standard (Grosso et al., Reference Grosso, Nepote and Guzmán2000). Iodine values were calculated from fatty acid composition (Hashim et al., Reference Hashim, Koehler, Eitenmiller and Kvien1993) using the following formula:

A high oleic (24%) A. hypogaea commercial cultivar (Granoleico) was used as a control for HO trait.
RIL genotyping
Total genomic DNA of the RIL population, progenitors, and wild species was extracted using the DNeasy PowerPlant Pro Kit (Qiagen, Germantown, MD) according to manufacturer instructions. DNA was quantified with a DeNovix DS-11 FX+ spectrophotometer/fluorometer (DeNovix Inc., Wilmington, DE).
Genotyping for AhFAD2 genes by AS-PCR
Allele-specific polymerase chain reaction (AS-PCR) was used to detect the genotype (either mutant or WT) of the AhFAD2A and AhFAD2B genes. F435Fw and F435IC-Rv30 primers were used as internal amplification controls combined with F435Wt-Rv, F435subs-Rv, and F435ins-Rv30 42 (online Supplementary Table S1) that amplify the segments where the sequences WT, substitution, and insertion are located, respectively. The PCR thermocycling was performed in a MasterCycler Thermal Cycler model 5333 (Eppendorf Hamburg, Germany) with thermal conditions as defined by Chen et al. (Reference Chen, Wang, Barkley and Pittman2010. Finally, PCR products were separated in an acrylamide-bis-acrylamide 15% in 1 × tris-glycine buffer by electrophoresis at 70 V for 16 h. Amplicons were visualized by UV transillumination using a DigiDoc-It UVP (Analytik Jena US LLC, Upland, CA). Amplified fragments were analyzed and scored (in bp) using Peak ScannerTM Software 1.0 (© Copyright 2006, Applied Biosystems). After amplified fragments were recoded with one denoting presence and 0 denoting absence, each individual's genotype was determined. Each locus contained alleles for the WT and mutant types at subgenomes A and B, respectively (online Supplementary Table S1).
RIL population genotyping by 48K ‘Axiom_Arachis 2’ SNP array and QTL detection
The 48K ‘Axiom_Arachis 2’ SNP array was used to genotype the 103 RIL population and progenitors to evaluate the genomic structure and SNP association with oil and protein content (Clevenger et al., Reference Clevenger, Korani, Ozias-Akins and Jackson2018). The genotypic data was processed and analyzed using the Axiom Analysis Suite 5.0.1.38 software (https://www.thermofisher.com). Using the ‘R/qtl’ R package (Broman et al., Reference Broman, Wu, Sen and Churchill2003), QTL mapping and additive effect estimations were carried out based on the interspecific RIL genetic map previously published (de Blas et al., Reference de Blas, Bruno, Arias, Ballén-Taborda, Mamani, Oddino, Rosso, Costero, Bressano, Soave, Soave, Buteler, Seijo and Massa2021). Allele calls derived from the SNP data of the RIL and its progenitors were recorded as follows: homozygous as in the amphidiploid = A, and homozygous as in the cultivated parent = B. The mean phenotypic data (for oil, protein proximate content, and oleic and linoleic fatty acid content) of each line was estimated as the mean of the three years assayed and used for the QTL analysis. Since the RIL population segregates for the phenological trait ‘days to maturity’ and it is well documented that the proportion of oleic content (18:1) is affected by seed maturity (Dwivedi et al., Reference Dwivedi, Nigam and Rao2000), 14 RIL with maturity state < 4 (scale 1 = immature seed to 5 = mature seed) were discarded for the detection of QTL for oleic and linoleic fatty acids. Conditional genotype probabilities, given the observed marker data, were computed with an error of probability of 0.001. A 1.0 cM window size was set for the genome scan after the pseudo-markers function was performed. A Haley-Knott (H-K) regression was used to assess the association of each genome position with the trait of interest. The threshold LOD score was estimated empirically for each chromosome using 1000 permutations (α = 0.01), and a QTL was declared if the LOD score was over the empirical threshold (Broman and Sen, Reference Broman and Sen2009). A 95% Bayesian confidence interval was calculated with the Bayesint function and the LOD support interval with Lodint functions, while the percentage of phenotypic variance explained (PVE) by each QTL was computed with the function fitqtl as implemented in ‘R/qtl’ (Broman et al., Reference Broman, Wu, Sen and Churchill2003) by fitting a single linear model with each detected QTL. In addition, epistatic interactions were predicted using the function-effect plot of all possible associated-SNP pairwise combinations. QTL were designated following conventional nomenclature with the initial letter q followed by the first three letters that corresponded to the trait name (oil = oil, pro = protein, ole = oleic, lin = linoleic) and linkage group (LG).
Statistical analysis
All chemical analyses for each individual were done in triplicate. An analysis of variance was performed on the phenotypic data, and significant different means were determined using the Scott and Knott clustering method (α = 0.05) (Scott and Knott, Reference Scott and Knott1974) test in R package (Jelihovschi et al., Reference Jelihovschi, Faria and Allaman2014). Oleic acid phenotypic segregation was examined under the HO condition when the ratio of oleic (18:1) to linoleic (18:2) was 2.33 (Moore and Knauft, Reference Moore and Knauft1989). The analysis of the phenotypic effect of allelic variants at AhFAD2 genes for individuals with at least one wild type (WT) allele (not double recessive homozygous) was performed considering RIL with phenotype HO. A χ 2 test (α = 0.05) was performed to evaluate the fit goodness of the expected segregation frequency 15:1 (WT RIL : HO RIL) for the HO phenotypic trait (Moore and Knauft,1989). Seventeen RIL were excluded from this test because they presented an HO phenotype (oleic content >70%) but a genotype other than the expected double homozygous recessive. To evaluate if this incongruence was due to the different maturity stages of pods, a proportion analysis was performed. Similarly, using genotyping data, an χ 2 test (α = 0.05) was performed to test the fit goodness of the expected genotypic segregation frequency (1:14:1) for the double homozygous WT genotype, every other genotype and double homozygous mutant genotype (Moore and Knauft, Reference Moore and Knauft1989). The concordance between amplified genotypes and expected contents of oleic (18:1) and linoleic (18:2) was confirmed by estimating the percentage of oleic (18:1) and linoleic (18:2) means for each group of detected genotypes at the AhFAD2 locus. To test the probable genomic-poblational structure, SNP markers data was subjected to a conglomerate analysis from a Euclidean distance matrix between RIL population individuals using a Ward's hierarchical agglomerative clustering method (Ward, Reference Ward1963). Also a PCA analysis using ‘stats’ R package (R Core Team, 2020) was performed. Finally, a one-way ANOVA with a post-hoc TukeyHSD test and Bonferroni's correction (P = 0.05) was carried out to test statistically significant differences in oil, protein, oleic and linoleic fatty acid contents among groups of genotypes at the peak position of detected QTL using SNP markers.
Results
Oil, ash, protein, raw fibre and total sugar proximate contents
The oil, ash, protein, raw fiber, and total sugar mean proximate values of the RIL population, its progenitors (A. hypogaea 17304-7-B and the amphidiploid), and the three wild diploids used to develop the amphidiploid are shown in Fig. 1A and online Supplementary Table S2. The clustering analysis showed seven groups for oil and total sugar proximate content, eight groups for protein and raw fiber, and only four groups for ash proximate content (Figures 1B–1E).

Figure 1. Radial plots showing the distribution of the main proximal composition on dry weight of a 103 interspecific RIL population, its progenitors (A. hypogaea 17304-7-B and amphidiploid JS1806), and the wild species (A. batizocoi, A. cardenasii, and A. correntina) from which the amphidiploid was obtained. Mean clustering was done using the Scott and Knott (α = 0.05) (Scott and Knott, Reference Scott and Knott1974) for each proximate parameter, including all the materials. The mean values for each group are indicated in bold. The scale for each plot is indicated on the vertical at the beginning of each circle. A = average proximate composition. B = oil; C = ash; D = protein; E = raw fibre; and F = total sugar. Different groups represent cluster means with statistically significant differences.
Oil
The oil content ranged between 45.49 and 56.48%. The highest value (56%) and the lowest (47%) were found within groups exclusively composed of RIL. The tetraploid progenitors and wild species showed intermediate values; A. correntina and the amphidiploid were in a group with a mean of 49%; A. batizocoi was in a group with a mean of 52%; and A. cardenasii and the cultivated progenitor were in a group with a mean of 54%. Transgressive oil content segregation was observed in RIL 62, 47A, and 83 (56%), with statistically significant differences from the group that the cultivated parent was located in (54%).
Ash
The ash content ranged from 2 to 3.23%, and the RIL population covered the whole range. The trait showed a relative variation of 75%, with four statistically significant groups (Fig. 1B). The wild species showed high ash content; that is, A. cardenasii and A. correntina were included in the cluster with the highest values (mean 3%), and A. batizocoi was included in a group with an average of 2.65%. The lowest values were found within a group of RIL and the cultivated parent (mean 2%), and the amphidiploid clustered in a group with a mean of 2.45%.
Protein
The protein content ranged from 21 to 36%, with 71% of the relative protein content variation arranged in eight groups (Fig. 1C). The three wild species and amphidiploid were set in the three groups with the highest values of protein content (32, 33, and 35%), while the elite peanut line was included in one medium-low content group (mean 28%).
Raw fibre
The raw fibre proximate content showed a 50% variation, ranging from 8 to 12%, arranged in eight groups with statistically significant different means. The group with the highest value (mean 12%) included only RIL and was more close to the value of the cultivated parent (11.3%) than the wild species. The latter species and the amphidiploid showed the lowest mean values, with A. cardenasii having the lowest one with 8.15%.
Total sugar
The sugar content showed statistically significant differences between genotypes clustered in seven groups, with values that ranged from 3 to 6%. All wild species showed low values of sugar content, while the cultivated line was included in a group with medium values. The three groups with the highest values were exclusively composed of RIL, revealing a large effect of transgressive segregation.
Fatty acid composition
The content of the fatty acids in the RIL population, its progenitors, and the three wild-type progenitors of the amphidiploid are presented in online Supplementary Table S3. Clustering analysis generated five groups for palmitic (16:0) and linoleic (18:2), four groups for oleic (18:1), arachidic (20:0), and eicosenoic (20:1), three groups for stearic (18:0), two groups for linolenic (18:3), erucic (22:1), and lignoceric (24:0), and a single group for behenic (22:0). The percentage of behenic acid in Arachis batizocoi (6.17%) was not statistically significantly different (α = 0.05) from any other of the materials analysed. The oleic and linoleic acids showed the highest values in all materials analysed. Figure 2 shows the clustering results for oleic (A), linoleic (B), and behenic (C) fatty acids. The fatty acid composition of the progenitors was contrasting for palmitic (16:0), oleic (18:1), and linoleic (18:2), which together comprised approximately 90% of the total fatty acid detected in seeds.

Figure 2. Radial plots showing the mean clustering of oleic, linoleic, and behenic acid compositions of a 103 interspecific RIL population, its progenitors (A. hypogaea and amphidiploid), and the wild species that were used to develop the amphidiploid. The mean values for each group are indicated in bold. The scale for each plot is indicated on the vertical at the beginning of each circle. A = oleic; B = linoleic; C = behenic. Different groups represent cluster means with statistically significant differences (α = 0.05) (Scott and Knott, Reference Scott and Knott1974).
The O/L ratio in the RIL population ranged between 0.74 (R63) and 22.5 (R78) (online Supplementary Table S3). Wild species, the amphidiploid, and 26 RIL were included in the group with a mean O/L ratio of 0.92, while six RIL (R05, R47A, R61, R66, R77, R78, R94B and R98A) were in a group with a mean O/L ratio = 21.7. The iodine values varied between 73.24 (RIL 11) and 135.28 (RIL 06), with an average of 96.38 for the RIL population (online Supplementary Table S3).
RIL genotyping
AS-PCR genotypic characterization of AhFAD2 genes
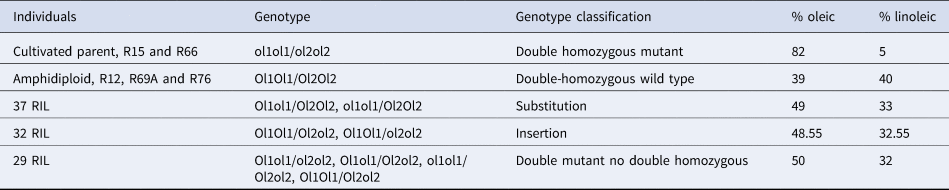
A table was generated from the PCR results of the RIL population, its progenitors, and control species, detailing the amplified fragments for each primer combination. The results of re-coded amplifications and probable genotypes are shown in online Supplementary Table S4. The control diploid species A. duranensis and A. ipaënsis amplified fragments that confirmed the presence of wild-type homozygous genotypes: Ol1Ol1 or Ol2Ol2, respectively. In addition, the amplification pattern for the tetraploid HO control (the commercial cultivar ‘Granoleico’) confirmed the double recessive homozygous mutant (dhmut) genotype: ol1ol1/ol2ol2. The results of the χ2 test showed that the phenotypic segregation of 87 wildtype RIL two HO in the RIL population fit best (P = 0.1188) to a bi-modal 15:1 (wild-type RIL:HO RIL) phenotypic segregation pattern. The genotypes of the cultivated parent, RIL15 and RIL66, were ol1ol1/ol2ol2 (dhmut), with an average of 82% oleic acid and 5% linoleic acid. The analysis of the RIL genotypes using a χ 2 test showed a good fit to a tri-modal genotypic segregation pattern of 1:14:1 (dhwt:dmndh, smsushm/ht, and sminshm/ht:dhmut) (P > 0.05) (Table 1). A summary of genotypic and chemical results for each RIL group and the progenitors is shown in Table 2.
Table 1. Results of χ 2 test to test the fit goodness to a bi-modal genotypic segregation pattern of 1:14:1 for fatty acid composition of 103 interspecific RIL population derived from the cross of a wild type (amphidiploid/JS1806) and a high oleic A. hypogaea (JS173047-B) progenitors

WT, wild type; HO, high oleic.
Table 2. Results of AS-PCR genotypic characterization of AhFAD2 genes and phenotypic fatty acid profile of 103 interspecific RIL population derived from the cross of a wild type oleic content (amphidiploid/JS1806) and a high oleic A. hypogaea (JS173047-B) progenitors
WT, wild type; HO, high oleic.
RIL population genotyping by 48K ‘Axiom_Arachis 2’ SNP array
The genotyping of the 103 RIL, parental lines, and diploid progenitors with the 48K ‘Axiom_Arachis2’ SNP array retrieved a total of 7496 polymorphic SNP markers (15.62%). No genomic structure was found within the RIL population.
Oil, protein, oleic and linoleic fatty acid QTL detection
Phenotypes of complex traits result from the presence of multiple QTL as well as from their interactions. All the traits tested here are polygenic in nature, and the detected QTL showed a phenotypic variance of <20.0%. The genetic architecture of chemical composition for oil, protein, oleic, and linoleic acid contents was dissected in a tetraploid context using the interspecific RIL population chemically characterized here.
Oil content
Three main genome regions (qOilB05, qOilB06, and qOilB07) were identified in this study, which together explained 27.70% of PVE (Table 3, Fig. 3). In addition, a positive epistatic interaction was detected between qOilB05 and qOilB06, and a negative epistatic interaction was detected between qOilB05 and qOilB07 (Fig. 3). The two epistatic interactions were detected between two oil content QTLs, which showed that AX-176808952 enhanced the proximate oil content effect of AX-176816690. That is, a given individual having a BB constitution at the AX-176808952 locus expresses similarly at the AX-176816690 either having an AA or BB constitution. However, when an individual is AA at AX-176808952, there is a significant difference between the two genotype means (49.6% AA versus 51.4% when BB) at AX-176816690. On the other hand, AX-176798630 seems to decrease the proximate oil content effect of AX-176816690. An individual that has AA at AX-176798630 has no difference in expression between being AA or BB at AX-176816690. However, when an individual is BB at AX-176798630, there is a significant difference between the two genotype means (52.1% BB versus 50.6% when AA) at AX-176816690.
Table 3. Detail of the QTLs detected oil, protein and oleic/linoleic contents on a RIL population of arachis based on a Halley-Knott genome scan QTL detection model
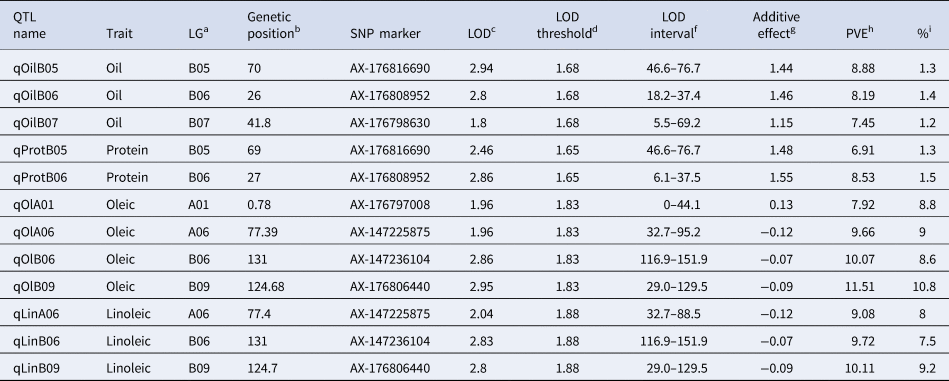
a Linkage group.
b Genetic position in Kosambi cM for each LG.
c LOD score at QTL peak.
d LOD threshold based on 1000 permutations at 1% level of significance.
eLOD support interval.
f Additive effect values; additive effect values; positive values indicate that alleles come from one of the wild diploid species (2n = 2x = 20) (A. correntina, A. cardenasii, or A. batizocoi), and negative values indicate that alleles come from A. hypogaea experimental elite line JS17304-7-B (2n = 4x = 40).
g Proportion of the phenotypic variance explained by the QTL.
h Percentage (%) of the increase in the trait.
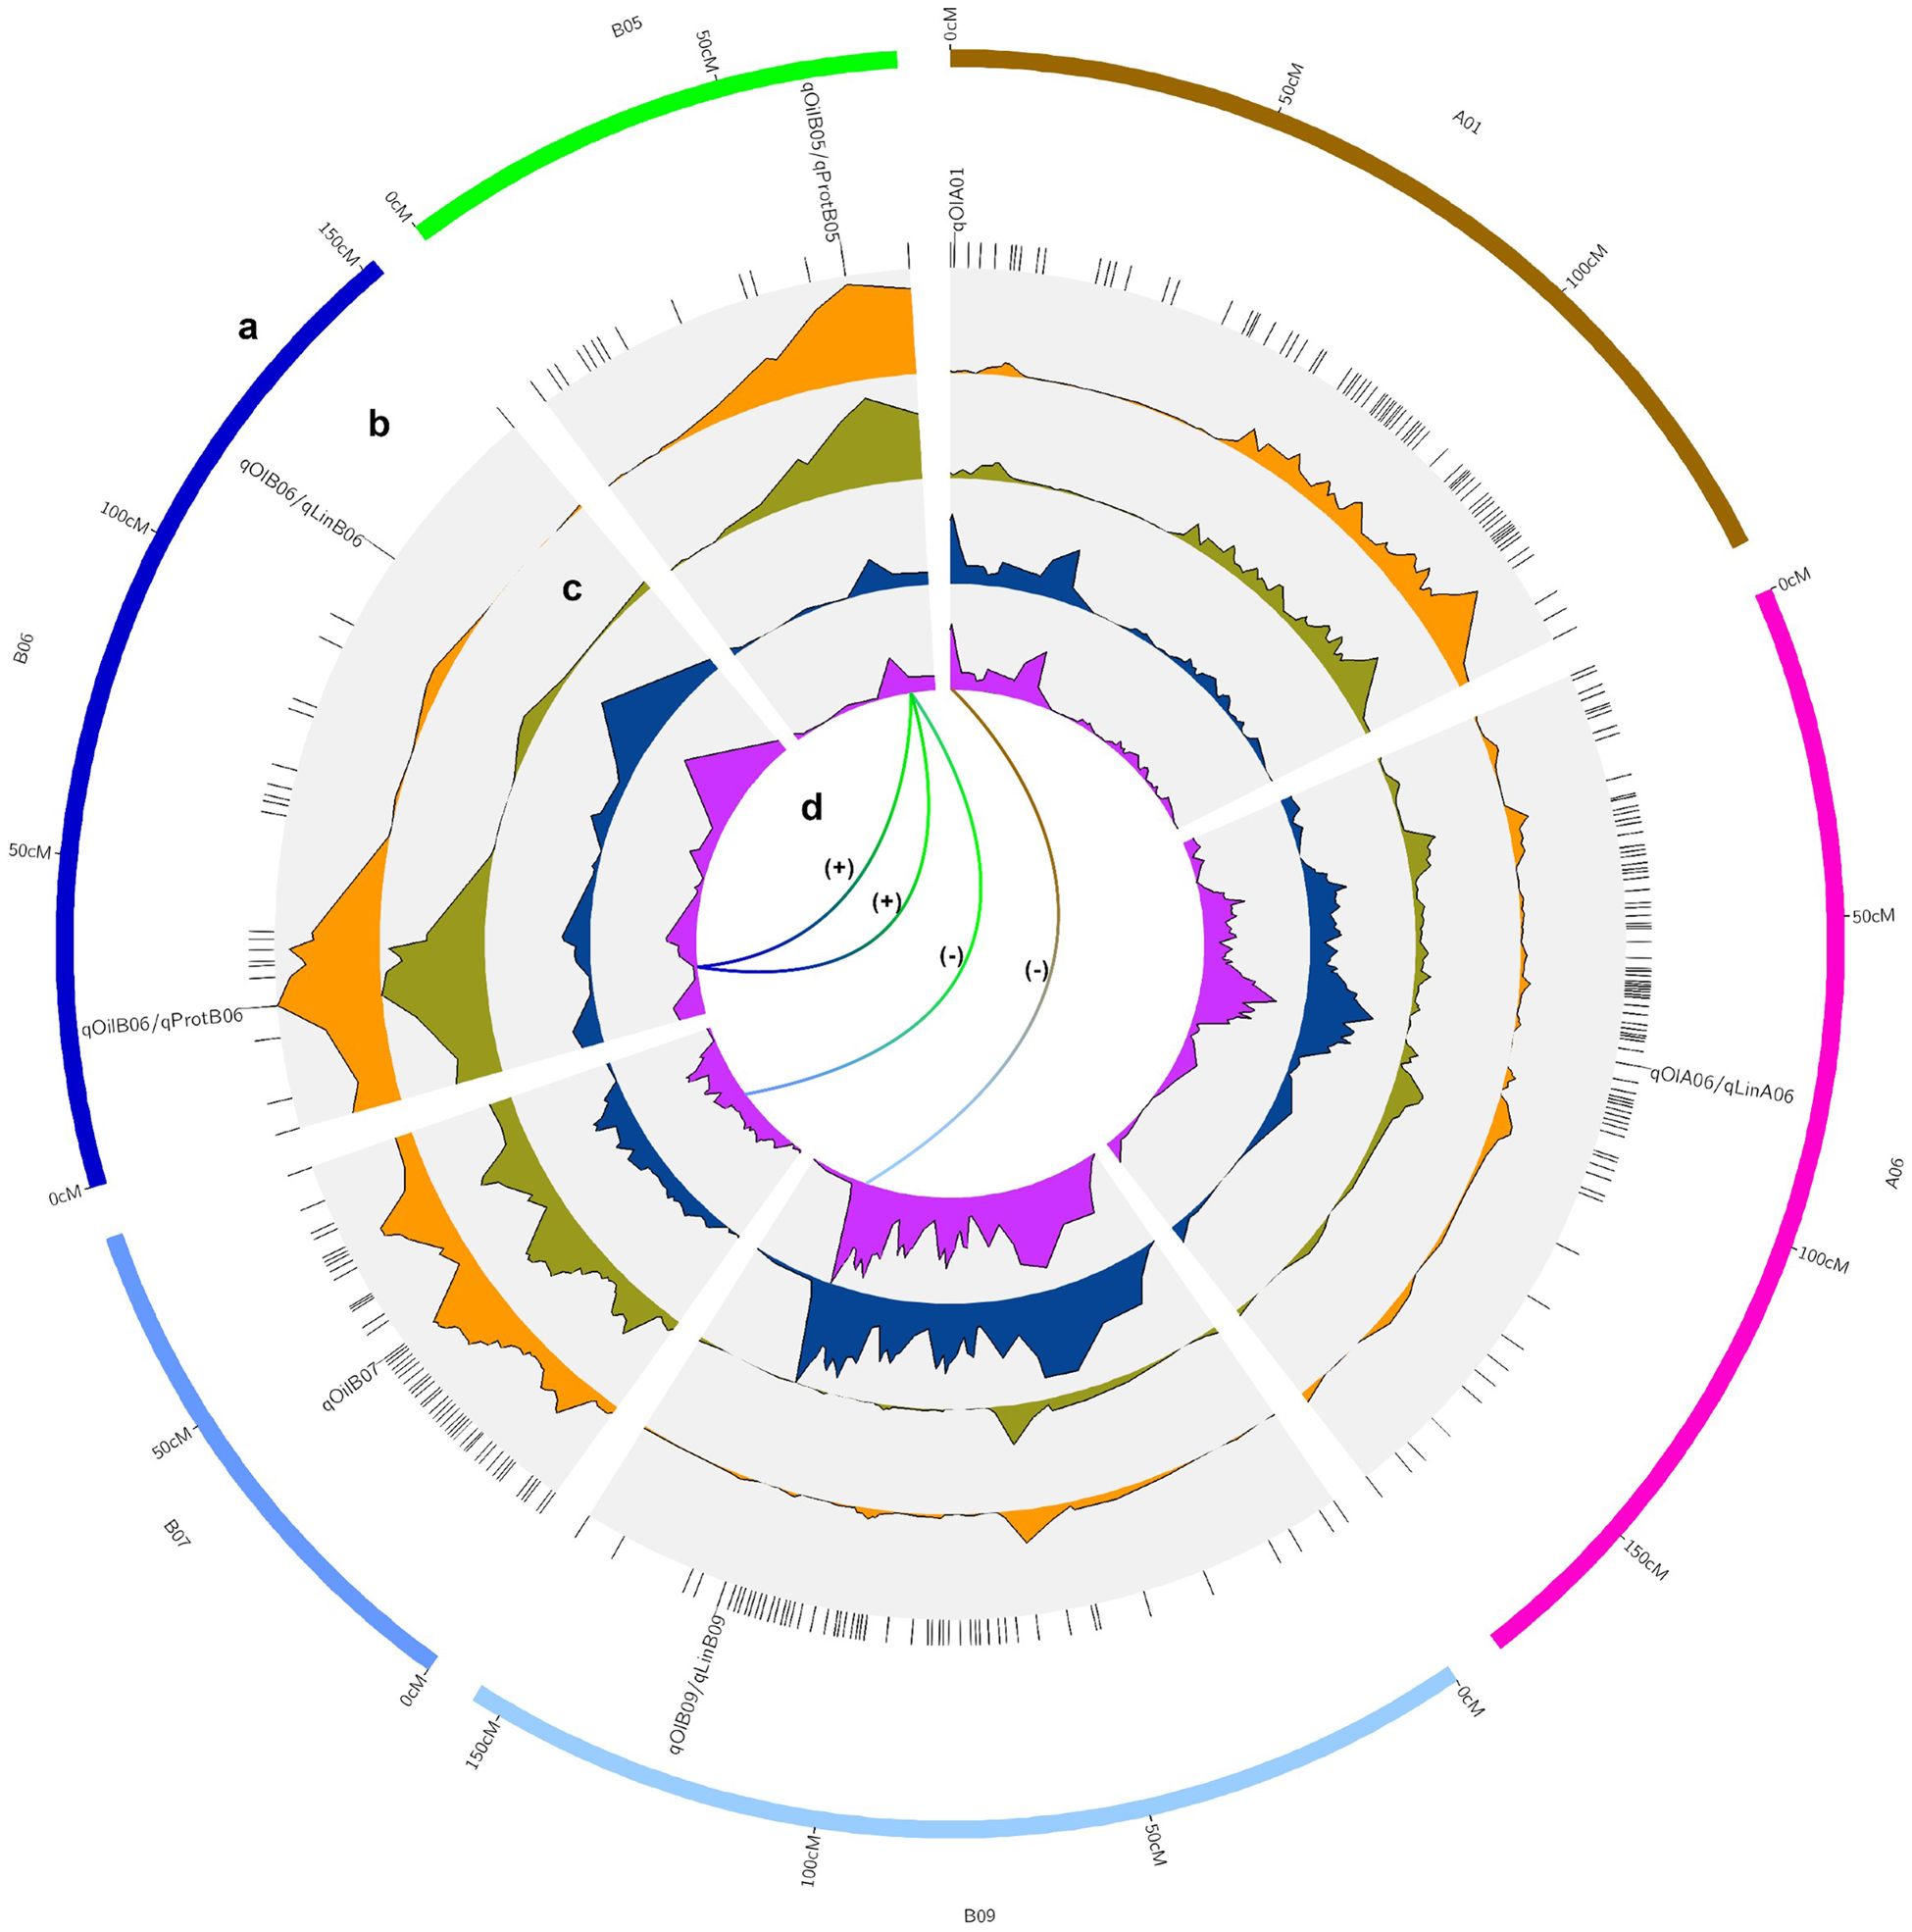
Figure 3. Circos-type plot (Diaz-Garcia et al., Reference Diaz-Garcia, Covarrubias-Pazaran, Schlautman and Zalapa2017), showing (a) QTL chromosome localization; (b) QTL names at the peak QTL interval, with co-located QTL names separated by a dash; (c) LOD values for oil (orange), protein proximate content (dark green), oleic (blue) and linoleic fatty acids (purple) from outside to inside of the plot; and (d) epistatic interactions indicated with (+) when positive and (−) when negative.
Protein
Two QTL were found located on chromosomes B05 and B06 (qProtB05 and qProtB06), which contributed 19.03% to the phenotypic variance of protein content (Table 3, Fig. 3). The individual qProtB05 and qProtB06 effect were 6.91 and 8.53%, respectively
Oil and protein QTL co-localize at chromosomes B05 and B06 (AX-176816690 and AX-176808952, respectively), though they display an inverse phenotypic effect. The epistatic interaction showed that the AX-176808952 locus enhances the proximate protein content effect of the AX-176816690 locus. A given individual with BB constitution at AX-176808952 has similar expression at AX-176816690, despite having AA or BB genotypes. However, when an individual is AA at AX-176816690, there is a higher expression at AX-176808952 when the genotype is AA (32.50%) than when it is BB (30.7%).
Oleic and linoleic fatty acids
Five major-effect QTLs qOlA01, qOlA06, qOlAB06, and qOlB09 were found to explain 40.88% PVE for the content of oleic fatty acid. The range of individual PVE varied from 7.92 to 11.51%. For linoleic acid, three major-effect QTLs, qLinA06, qLinB06, and qLinB09, were identified, explaining 32.86% of PVE with a range of 9.08–10.11 for individual QTL. A positive epistatic interaction was detected for oleic fatty acid between qOlA01 and qOlB09. The epistatic interaction detected between qOlA01 and qOlB09 showed that the AX-176806440 locus enhances the oleic fatty acid content at AX-176797008. Briefly, a given individual having a BB constitution at AX-176806440 expresses similarly at the AX-176797008 locus, either having an AA or BB genotype. However, when an individual is AA at AX-176816690, there is a clear difference between the two alternative genotype means (49.80 AA versus 62.4 when BB) at AX-176797008.
Discussion
The findings indicate that the synthetic amphidiploid developed from three wild species significantly contributed to broadening the genetic variability of chemical traits in the tetraploid context of peanut seeds. A significant portion of the observed variation can be attributed to the successful integration of new alleles from wild species into the tetraploid RIL background. This integration results in a novel combination of alleles that regulate these traits. As a consequence, progeny inherit a variable proximate chemical constitution, influenced by contrasting parental traits (Gao et al., Reference Gao, Araujo, Nascimento, Chavarro, Xia, Jackson, Bertioli and Leal-Bertioli2021; Jha et al., Reference Jha, Nayyar, Parida, Deshmukh, von Wettberg and Siddique2022). Proximate values found in some RILs were higher than those of the population progenitors, indicating transgressive segregation (Rieseberg et al., Reference Rieseberg, Archer and Wayne1999). The phenotypic variance observed (<20.0%) is likely explained by the fact that the phenotype of complex traits results from the presence of multiple QTL as well as from their interactions.
Selecting for higher oil content has been a primary goal in peanut breeding to develop new varieties (Holbrook et al., Reference Holbrook, Brenneman, Thomas Stalker, Johnson III, Ozias-Akins, Chu, Vellidis and McClusky2014). The transgressive segregation in some RILs with higher oil content than the cultivated parent demonstrates the potential for significant oil content increases using genetically distant progenitors. The results indicate the potential of wild species for enhancing oil content in breeding programmes.
Identifying major QTL for peanut oil content and understanding their interactions would facilitate the development of peanut varieties with specific oil content traits using molecular breeding methods. The three genome regions associated with oil content identified in our study (qOilB05, qOilB06, and qOilB07) align with those found by Pandey et al. (Reference Pandey, Wang, Qiao, Feng, Khera, Wang, Tonnis, Barkley, Wang, Holbrook, Culbreath, Varshney and Guo2014). in a segregant population of peanuts with contrasting genotypes, which collectively explained 42.33% of phenotypic variance (PVE) compared to our study's 27.70% PVE. The individual PVE of our identified QTLs ranged from 7.45 to 8.90%, consistent with the phenotypic contribution reported by Sarvamangala et al. (Reference Sarvamangala, Gowda and Varshney2011) (7.1–10.2%), but narrower than the range reported by Pandey et al. (Reference Pandey, Wang, Qiao, Feng, Khera, Wang, Tonnis, Barkley, Wang, Holbrook, Culbreath, Varshney and Guo2014) (3.07–10.23%). Differences in PVE values may be attributed to variations in population size and location. Interestingly, two of the three oil content QTL (AX-176808952 and AX-176798630) identified in our study were located on the same chromosomes (B06 and B07) as some QTL reported by Pandey et al. (Reference Pandey, Wang, Qiao, Feng, Khera, Wang, Tonnis, Barkley, Wang, Holbrook, Culbreath, Varshney and Guo2014).
The diploid species used in this study showed values of ash content higher (3 and 2.65%) compared to those found previously (2.5%) (Grosso et al., Reference Grosso, Nepote and Guzmán2000). High ash content value has been correlated with a high level of elements such as calcium, copper, iron, magnesium, manganese, phosphorus, selenium, and zinc (Arya et al., Reference Arya, Salve and Chauhan2016), all of which are of high interest to the food industry.
The average protein content of 30% found in this study was comparable to that found in previous surveys using NIRS (28.43%) (Cheng et al., Reference Cheng, Jin and Liu2018) and Kjeldahl (29%) (Grosso et al., Reference Grosso, Nepote and Guzmán2000). The protein contents of A. correntina, A. cardenasii, and A. batizocoi were comparable to those found by Bianchi-Hall et al. (Reference Bianchi-Hall, Keys, Stalker and Murphy1993). Notably, almost half of the RILs had higher values of protein content than the elite peanut line, and 10 of them were included in the group with the highest content (35%). This result evidenced that the trait of high protein content observed in the diploid species was successfully introgressed into the RIL population through the amphidiploid. These lines are of major interest for the development of high-protein commercial peanut cultivars that may meet the increasing demand for high-protein, easy-to-deliverable foods to fight malnutrition.
The two protein QTL located on chromosomes B05 and B06, with a phenotypic variance explained (PVE) of 19.03%, exhibited a narrower PVE range than that reported by Sarvamangala et al. (Reference Sarvamangala, Gowda and Varshney2011). Our study revealed the co-localization of oil and protein QTL on chromosomes B05 and B06 (AX-176816690 and AX-176808952, respectively) with an inverse phenotypic effect. This aligns with the well-documented strong negative correlation between oil and protein accumulation, reflecting the intricate balance between these two primary seed compounds (Chung et al., Reference Chung, Babka, Graef, Staswick, Lee, Cregan, Shoemaker and Specht2003; Nichols et al., Reference Nichols, Glover, Carlson, Specht and Diers2006; Bouchet et al., Reference Bouchet, Nesi, Bissuel, Bregeon, Lariepe, Navier, Ribière, Grezes-Besset, Renard and Laperche2014; Hwang et al., Reference Hwang, Song, Jia, Specht, Hyten, Costa and Cregan2014; Jasinski et al., Reference Jasinski, Lécureuil, Durandet, Bernard-Moulin and Guerche2016). The co-localization and negative correlation of oil and protein traits have been observed in various crops, including peanut, soybean, rapeseed, sunflower, and Arabidopsis thaliana (Grami et al., Reference Grami, Stefansson and Baker1977; Chung et al., Reference Chung, Babka, Graef, Staswick, Lee, Cregan, Shoemaker and Specht2003; Sarvamangala et al., Reference Sarvamangala, Gowda and Varshney2011; Li et al., Reference Li, Shi, Zhu, Zheng and Xu2017; Jasinski et al., Reference Jasinski, Chardon, Nesi, Lécureuil and Guerche2018). This inverse relationship is linked to the highly regulated seed-filling process, making independent manipulation of each component challenging. The identified oil and protein QTLs hold significance for molecular-assisted selection, particularly in selecting high-protein and low-oil-content peanut varieties.
The raw fibre content values found in this work are consistent with previous studies that used Association of Official Analytical Chemists standard methods (Lintas and Cappelloni, Reference Lintas and Cappelloni1992; Jonnala et al., Reference Jonnala, Dunford and Dashiell2005). In contrast to previous studies that found no significant differences in the fibre content of commercial peanut cultivars, our research identified eight groups with statistically different means. The contrasting values observed among RIL, along with the transgressive segregation observed in some of them, highlight the feasibility of using this population to develop new commercial varieties with different raw fibre contents.
The elevated sucrose content in peanuts cultivated in Córdoba, Argentina, imparts a distinctive roasted peanut flavour with a mild sweetness (Grosso et al., Reference Grosso, Nepote and Guzmán2000; CAM, 2019). This sucrose richness is recognized and utilised for the ‘Protected Designation of Origin’ in Argentina. Notably, the three groups with the highest sugar content values were entirely made up of RILs, demonstrating the significant impact of transgressive segregation on this trait. The results demonstrate the potential of R60, R72A, R29, R92, R39, R4, R69, R47A, R41, R20, R27, R59, R52, R98A, R78A, R46, R33, and R78 RIL genotypes for increasing sugar content in breeding programmes.
Maintaining a low percentage of behenic acid is desirable, as it mitigates the risk of increased oil turbidity at temperatures between 0 and 4°C (Grosso et al., Reference Grosso, Nepote and Guzmán2000). Despite behenic fatty acid clustering all genotypes into a single group, A. batizocoi exhibited a higher value (6.13%) compared to the group average (3%). This notable difference, particularly in A. batizocoi, underscores its potential as a valuable trait for consideration in future crosses when used as a wild progenitor. Remarkably, this value closely resembled that found in A. matiensis Krapov, WC Gregory, & C Simpson (6%) from another section (Procumbentes) of the Arachis genus (Grosso et al., Reference Grosso, Nepote and Guzmán2000). The relatively low behenic acid values (below 3%) observed in the RIL suggest that the alleles from A. batizocoi did not have a pronounced expression in the population.
The broad variation in oleic/linoleic (O/L) ratios observed in this study aligns with the anticipated divergence among parental genotypes. A group comprising wild species, the amphidiploid, and 26 recombinant inbred lines (RILs) exhibited the lowest mean O/L ratio (0.92). Conversely, some lines displayed O/L ratios comparable to high oleic (HO) varieties cultivated in Argentina, the United States, and China. These HO RIL lines, known for their resistance to various pests and diseases (de Blas et al., Reference de Blas, Bressano, Teich, Balzarini, Arias, Manifesto, Costero, Oddino, Soave, Soave, Buteler, Massa and Seijo2019) are promising candidates in genetic improvement programmes seeking to enhance resistance traits while preserving the O/L ratio.
The five major-effect Oleic content QTLs (qOlA01, qOlA06, qOlAB06 and qOlB09) exhibited a PVE of 40.88%, while the major-effect linoleic acid QTLs (qLinA06, qLinB06 and qLinB09) explained a PVE of 32.86%. Both values were significantly higher than those reported by Pandey et al. (Reference Pandey, Wang, Qiao, Feng, Khera, Wang, Tonnis, Barkley, Wang, Holbrook, Culbreath, Varshney and Guo2014) (28.98 and 28.22%, respectively). All Oleic acid QTLs, except qOlA01, co-localized with linoleic acid QTLs, demonstrating a negative correlation with the phenotypic effect, as expected.
The differences observed could be attributed, in part, to variations in population size and the degree of divergence among parental genotypes concerning oil quality traits.
The detected QTLs were located on the same chromosomes as the genes involved in the fatty acids' metabolic pathway, aligning with the findings of Peng et al. (Reference Peng, Ruan, Tian, Shan, Meng, Guo, Zhimeng, Hong, Wan and Li2020). Among the six sub-families reported in their survey, three were named stearoyl-acyl carrier protein desaturases (SAD) (Arahy.E24IL6.1 and Arahy.BR0SNA.1), fatty acid desaturase 2 (FAD2) (Arahy.BY45PL.1, Arahy.8TPQ4A.1, Arahy.9P5B67.1, Arahy.5913QL.1, and Arahy.7E0HBM.1), and FAD4/5 (Arahy.GU7MJ6.1). The prevalence of FAD2 genes in the same chromosome region as the QTL peak detected in our study is consistent with the high PVE explained by these four markers for oleic and linoleic fatty acids.
The phenotypic segregation pattern for O/L ratio observed here was concordant with an earlier cited F2 population derived from the cross between two contrasting peanut lines for HO trait (Moore and Knauft, Reference Moore and Knauft1989). In addition to the phenotypic expression of the HO trait, to efficiently use the available germplasm in peanut breeding programmes, it is desirable to know the genotypes and the allele segregation pattern that encode for this trait (Chen et al., Reference Chen, Wang, Barkley and Pittman2010). The analysis of the RIL genotypes showed that the proportions fit well to the model of two major independent loci with two alleles each, as reported previously (Moore and Knauft, Reference Moore and Knauft1989). The best adjustment was observed when the oleic acid content value was considered to perform a posteriori check, knowing the maturity degree of RIL seeds. The difference in proportion test obtained suggests that the dispersion observed for those genotypes could be explained by the maturity degree of the seeds.
Conclusion
Our study evidenced the successful introgression of favourable traits derived from wild species into elite peanut lines and the value of non-domesticated germplasm. The variability found for proximate composition showed that chromosomal segments belonging to the wild species were introgressed into the interspecific RIL population, broadening the allelic diversity coding for enzymes involved in the complex metabolic pathways for oil, protein, ash, raw fiber, and total sugar contents. Our study reveals that the RIL population is composed of some genotypes with better phenotypic expression than the parent elite line and the commercial variety used as a control for each chemical parameter analyzed. Additionally, the discovery of high O/L ratios and iodine values in certain resistant RILs (de Blas et al., Reference de Blas, Bressano, Teich, Balzarini, Arias, Manifesto, Costero, Oddino, Soave, Soave, Buteler, Massa and Seijo2019) designates these genotypes as highly desirable candidates for inclusion in breeding programmes to develop commercial varieties with superior industrial oil quality and resistance to various diseases. The markers within QTL intervals associated with oil, protein, oleic, and linoleic fatty acid content have potential for assisted selection in the development of commercial varieties focused on complex traits. Overall, the study highlights the importance of preserving wild relatives in their natural habitats and illustrates their potential for crop improvement.
Supplementary material
The supplementary material for this article can be found at https://doi.org/10.1017/S1479262124000170
Acknowledgments
This work was funded by CONICET (National Scientific and Technical Research Council Argentina), SECyT (National University of Córdoba Science and Technology Secretariat), ANPCyT (Agencia Nacional de Promoción Científica y Tecnológica) through its funding programme FONCyT (Fondo para la Investigación Científica y Tecnológica), and Criadero El Carmen (Nursery El Carmen). The authors would like to thank JLA Argentina SA, the laboratory where the NIRS analysis was performed. To Rocío de Blas for artwork assistance. We also thank the Laboratorio de Lactología (Laboratory of Lactology) of the Facultad de Ciencias Agropecuarias National University of Córdoba (UNC) and the Laboratorio de Química Biológica of the Facultad de Ciencias Agropecuarias National University of Córdoba (UNC) for allowing us to use their facilities to perform the reference proximate chemical analysis. F. de Blas received fellowships from CONICET (RESOL-2020-1188-APN-DIR#CONICET). The funding bodies had no influence on the experimental design, data analysis and interpretation, or writing of the manuscript.
Author contributions
FJDB, JGS and NRG conceived and designed the experiments; FJDB, MM and BDPC performed chemical and molecular laboratory analysis; FJDB performed the QTL detection and statistical analysis; FJDB and BDPC curated the data; FJDB, BDPC and MM analysed the data; NRG contributed reagents, materials and/or analysis tools; FJDB, MB, JGS and NRG drafted and wrote the manuscript. All authors approved the final version.
Competing interests
The authors declare that they have no competing interests.
Data availability
The datasets generated during and/or analyzed during the current study are available as supplementary data.


