The Chair (Dr L. M. Pryor, F.I.A.): Today’s Institute and Faculty of Actuaries (IFoA) sessional meeting is “A Top-down Approach for Exploring the Economic and Financial Market Impact of Climate Change”. I am Louise Pryor and I am the incoming president-elect of the IFoA, a past chair of the Resource and Environment Board, and a member of the working party that produced the two papers we will be discussing today.
We are discussing two papers that we have written, that look at how climate risk can be integrated into the work of actuaries. Following on from those, we have worked with Ortec Finance to look at how it might be possible to use climate change modelling in pensions actuarial work. We have produced two papers. One looks at a case study of a reasonably typical UK pension scheme, and sees what the effect of various climate change scenarios might be on its funding position. The other looks at the effects of those scenarios on investment performance more generally. Our speakers today are Claire Jones, Lisa Eichler, Nick Spencer and Andrew Claringbold, and also Bert Kramer will be joining us for the panel at the end.
Claire Jones is a partner and head of responsible investment at LCP and she established the working party that produced the practical guide to resource and environment issues for pensions actuaries. She will be starting off by giving us the background to set the scene for our work.
Lisa Eichler is co-head of the Climate and ESG Solutions team at Ortec Finance. She has more than 15 years’ experience working with institutional investors, governments and international organisations on their climate-related policy and strategy questions. She will be describing the modelling we carried out.
Nick Spencer is the deputy chair of the IFoA Resource and Environment Board and was a co-author, along with Claire (Jones) and Andrew (Claringbold), of the early sessional paper. Nick (Spencer) will be looking at the effects of our scenarios on investment performance.
Andrew Claringbold, as well as being an author of this paper, was also an author of the previous paper, and is a scheme actuary in Aon and helped to produce Aon’s climate change scenarios. He will be talking about our case study.
Bert (Kramer) is a business specialist in Climate and ESG Solutions at Ortec Finance and a lecturer in econometrics and finance at the University of Groningen. Bert (Kramer) will be joining to help us answer some of the tougher questions that I am sure you will ask. Let us start by going over to Claire (Jones), who is going to discuss some of the background for us.
Ms C. C. Jones, F.I.A.: I have given many talks on climate change over the years. I have always started by explaining why climate change is important and why we need to talk about it, but I do not feel that I need to do that today. It is now widely accepted that climate change poses a material, systemic financial risk and that we need to act. Not only is there a lot of support for this view within the financial industry, including from the Bank of England and other financial regulators, but there is also strong public and political concern about climate change. Whilst people’s attention is clearly focused elsewhere at the moment, COVID-19 does not diminish the importance of climate change in any way. In fact, it reminds us of the importance of addressing systemic risks and taking action in good time.
Within the financial sector, there has been a particular focus on the recommendations of the Taskforce on Climate-related Financial Disclosures (TCFD). These recommendations have been endorsed by the UK Government. Its Green Financial Strategy, published in July 2019, set out various plans to encourage the adoption of TCFD within the UK, including an expectation that listed companies and large asset owners would be reporting on their climate activities, in accordance with the TCFD recommendations, by 2022. We have since seen significant activity around this. The Financial Conduct Authority is consulting on getting UK-listed companies to comply or explain with TCFD. The Pensions Climate Risk Industry Group (PCRIG) is consulting on draft guidance for UK pension scheme trustees. Meanwhile, the Bank of England has issued a supervisory statement on climate change for banks and insurers and has consulted on investigating climate change in its biennial exploratory scenario next year. Activity is certainly not confined to the UK. For example, central banks and supervisors from around the world are collaborating on climate change through the Network of Central Banks and Supervisors for Greening the Financial System (NGFS).
Turning back to the TCFD, in my view the TCFD’s most challenging recommendation is to conduct climate scenario analysis. One can see that it is a particularly useful tool to study climate change because of the huge uncertainty about how climate might play out. Actuaries clearly have lots of relevant skills here and we are very well placed to help our clients and employers to use climate scenario analysis. The IFoA’s Resource and Environment Board has been seeking to support actuaries with this process. In November 2018 there was a sessional meeting that explored the implications of climate change for setting long-term financial assumptions. Nick (Spencer), Andrew (Claringbold) and I presented on climate scenario analysis that evening, covering the guidance that our working party had produced.
However, we wanted to go further. We wanted to enable actuaries to do broad-brush calculations themselves to get a feel for the potential impact of climate change, without having to develop the scenarios from scratch or to work for one of the organisations that has its own proprietary climate scenario modelling. We therefore researched the various available models for applying climate scenario analysis to financial institutions. We found that most of them were bottom-up approaches that look at the impact of climate change on individual investments and then aggregate across the portfolio. Whilst that is useful for some purposes, we found it problematic for two reasons. Firstly, these approaches are typically only applied to listed equities and corporate debt that do not cover the whole investment portfolio. Secondly, there is no easy way to bring the liabilities into the modelling. Of course as actuaries we know the importance of looking at the impact on assets and liabilities in tandem. So our working party decided that we wanted a top-down approach, and we identified Ortec Finance as having one of the most well-developed top-down climate scenario approaches.
For the last year we have been working in partnership with Ortec Finance on a pair of papers that cover climate scenario analysis. As Louise (Pryor) mentioned, one paper is a case study where we show how Ortec Finance’s model can be applied to a UK defined benefit pension scheme and the potential impact that climate change has on the scheme’s funding position. The other paper provides more detail on the model’s outputs, looking at the impact of climate change on the economy and financial markets, out to 2060. This paper is relevant to a wider audience: to actuaries working in other practice areas, wherever they are located, and also to policy-makers and regulators who are concerned about the long-term impacts of climate change. We are going to present some of our findings today but first I am going to hand over to Lisa (Eichler) to tell you a bit more about Ortec Finance’s model.
Ms L. Eichler: We used our Climate MAPS tool to run the climate scenario analysis we presented in our papers. Climate MAPS integrates systemic climate risks and opportunities associated with different global warming pathways into traditional, multi-horizon, real-world scenario sets that drive strategic investment decision-making. Today, I will briefly talk you through a high-level summary of our methodology as well as the narratives behind the three climate scenarios we analysed. See Figure 1.
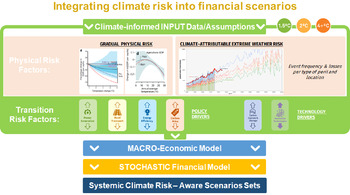
Together with our strategic partner Cambridge Econometrics, we determined that climate-informed input data and assumptions. This includes physical risk factors, such as gradual physical risks associated with an increase in temperatures. Here, you can think of how temperatures affect agricultural productivity or worker productivity. Physical risks also include climate-attributable extreme weather event frequency and losses per type of peril and location. See Figure 2.
A second set of climate risk factors focuses on those risks and opportunities associated with a transition to a low-carbon economy. Here, we look at the policy measures as well as technology drivers across sectors and countries that need to come into place to bring the world onto the given climate pathway. See Figure 3.
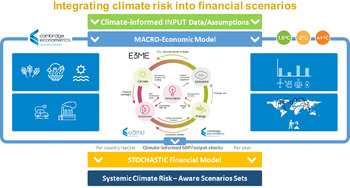
Next, we capture how these climate risk factors interact with one another and with the global economy, by running them through a Cambridge Econometrics macro-economic model called E3ME. This enables us to capture network systemic effects, such as supply chain dependencies, supply/demand relationships and how these are influenced by the different climate risk factors. This step results in climate-informed GDP and output shocks per country and sector and per year. See Figure 4.
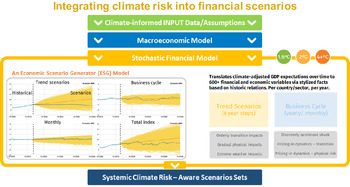
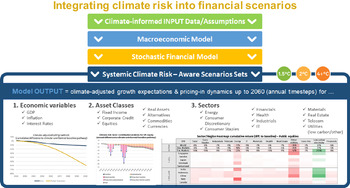
We then use this input to our stochastic financial model and this part of the model, in turn, translates the climate-adjusted GDP expectations over time into more than 600 financial and economic variables via stylised facts based on historic relationships. See Figure 5.
The resulting output is expressed as climate-adjusted growth, expectations and pricing-in dynamics in annual time steps, up to the year 2060. The scenario set includes economic variables, such as GDP, inflation and interest rates, asset class risk, return expectations and sector-level granularity. We express these kinds of adjusted outputs as differences, termed deltas, versus a climate uninformed baseline economic and financial output. Nick (Spencer) will talk you through our results in more detail in a moment, but what I mean by this is that, for example, world GDP growth by the end of the century is expected to be about 70% lower than what would have otherwise been estimated prior to taking transition and physical climate risks into account.
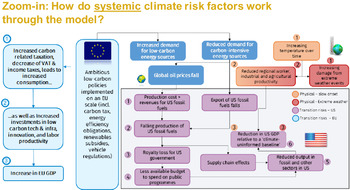
Figure 6 illustrates, in more detail, what we mean by using a top-down approach that captures the systemic nature of climate risks, where physical and transition risks interact and all countries and sectors experience direct, as well as network, effects. Figure 6 illustrates the very detailed modelling in the Cambridge Econometrics E3ME model to capture the interactions between the economy and related carbon emissions, the climate system and detailed energy and technology innovation modules. A policy measure in Europe, for example, such as an increase in carbon prices, not only affects the energy mix throughout Europe but also world oil prices, as well as demand for US fossil fuel exports. In turn this affects royalties paid to the US government and consequent government expenditure to other sectors, and so forth.
Figure 1. Combining financial and climate scenario analysis.
Figure 2. Integrating climate risk into financial scenarios.
Figure 3. Integrating climate risk into financial scenarios.
Figure 4. Integrating climate risk into financial scenarios.
Figure 5. Integrating climate risk into financial scenarios.
Figure 6. How do systemic climate risk factors work through the model?
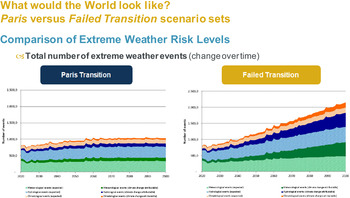
Figure 7. What would the world look like? Paris versus Failed Transition scenario sets.
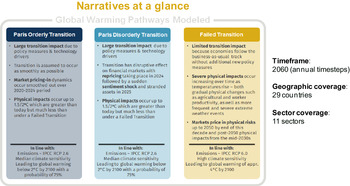
Having provided this brief overview of our modelling methodology, I now introduce you to the three climate scenarios we analysed in our papers. See Figure 7.
We analysed two climate pathways that would be likely to bring the world onto a path that is in line with the Paris Agreement to limit average global warming below two degrees by the end of the century. Both pathways contain large transition impacts due to policy measures and technology drivers, as well as the locked-in physical risks the world is faced with, even when staying below two degrees. What distinguishes our Paris Disorderly transition from a Paris Orderly transition scenario is that, whilst the Orderly transition assumes everything happens rather smoothly, a Disorderly transition explores the disruptive effects on financial markets with re-pricing taking place suddenly in the year 2024, followed by a sentiment shock and stranded assets in 2025. Conversely, we explore a scenario where the world fails to transition to below two degrees and in turn experiences very severe physical impacts.
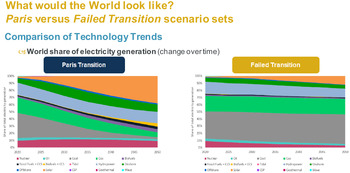
Finally, I would just like to give you a bit of an impression of what the world would look like under these three possible climate pathways. For example, as regards policy measures, the global carbon price is assumed to grow to around $60 per tonne of CO2 by the year 2030, and to above $700 per tonne of CO2 by 2050. As you can see, this affects the electricity generation technology mix. This differs significantly in a Transition scenario, which you see on the left of Figure 8, versus a Failed Transition. This is a global view but there are also large differences across countries.
Figure 8. What would the world look like? Paris versus Failed Transition scenario sets.
In terms of the increase in frequency of extreme weather events, you can also see that the total number of events by the end of the century will double in a Failed Transition compared to a Paris pathway. There is much more detail surrounding the narratives of these three climate scenarios analysed. Nick (Spencer) will now talk through the modelling results we present in our papers.
Mr N. S. Spencer, F.I.A.: With Lisa (Eichler) having provided you an overview of the model, we will cover some of the model’s outputs, which we detail more in our second paper. I will then hand over to Andrew (Claringbold), who will cover the application of these model outputs in the pension fund case study.
The key features to think about in regards to the output are the percentages of the median return versus the uninformed climate baseline and the impact attribution. This is important as presenting these results relative to the uninformed baseline enables us to focus on the impact of the climate pathways. There are clearly second and higher order effects, but looking at the relative returns means that the first order of the macro-economic and financial assumptions will drop out. For example, whether the modelling rate of GDP growth is 2% or 3%, looking at the relative returns removes the direct sensitivity to this assumption. In fact, within the model, and we provide some illustrations, the GDP is projected out to 2100. But in practice, in the Failed Transition scenario, nominal GDP starts turning negative in the 2060s and 2070s. Therefore we are unable to calibrate that to the financial markets, as we simply lack a history to know what has happened if we have a continual decline in nominal GDP. Those relationships are unstable. Hence, we terminate the financial modelling in 2060.
When we look at the actual underlying climate impacts, these are divided between Transition, gradual, physical and extreme weather. Within the financial markets, there is a pricing shock for when the longer-term impacts are priced in. For the Disorderly Transition, with the impact of a sudden transition, we have explicitly allowed for a financial sentiment shock.
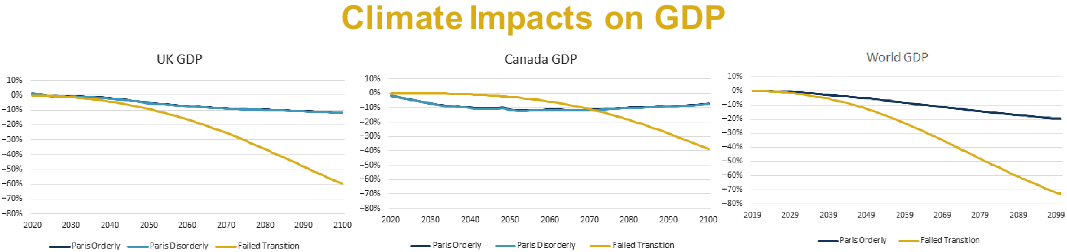
Moving on to look at what the impacts are on the GDP, shown in Figure 10, we have examined the climate pathways by considering them to be centred relative to the uninformed baseline pathway. In the UK, the initial impacts on the GDP and the Paris pathways are fairly limited, with a positive stimulus in fact offsetting the physical impacts as well as decommissioning other intensive activities. In the longer term, those investments are repaid, but they are not sufficient to offset the increasing physical impacts, even within the Paris-aligned pathways. This leads to a small negative Transition impact of GDP in the longer term of around 10%. The impact in the UK regarding the Failed Transition is clearly more severe. Again, in the short run, it does not have much impact, but over the longer term the impact of the physical climate’s dampening impact on the economy accumulates. Over the years up to 2100, we see a drop of 60% of GDP relative to the baseline. This analysis is repeated across a number of the large economies which do not all show the same pattern. For example, in Canada, the closing of demand for tar sand, and other intensive fossil fuel extraction, leads to a significant drop of the GDP in the Paris-aligned scenarios – the blue line in the middle graph in Figure 10. However, in the middle of the century, there is a slight amelioration with the physical impact being a net positive. In Canada’s case, this slightly improves their overall economic growth. The net long-term impact for Paris-alinged pathways is around a 10% drop in GDP. In the Failed Transition, we do not see that initial drop. But even in Canada’s case, the long-term physical impact and that of the global economy is very negative leading to a drop of 40% of GDP to 2100.
Figure 9. What would the world look like? Paris versus Failed Transition scenario sets.
Figure 10. Climate impacts on GDP.
Looking at the global GDP impacts of different pathways summed across different countries, the net pattern is similar to that of the UK albeit slightly more severe. By 2100, the Paris orderly transition drops by 20% relative to baseline and the Failed transition drops by more than 70% relative to baseline.
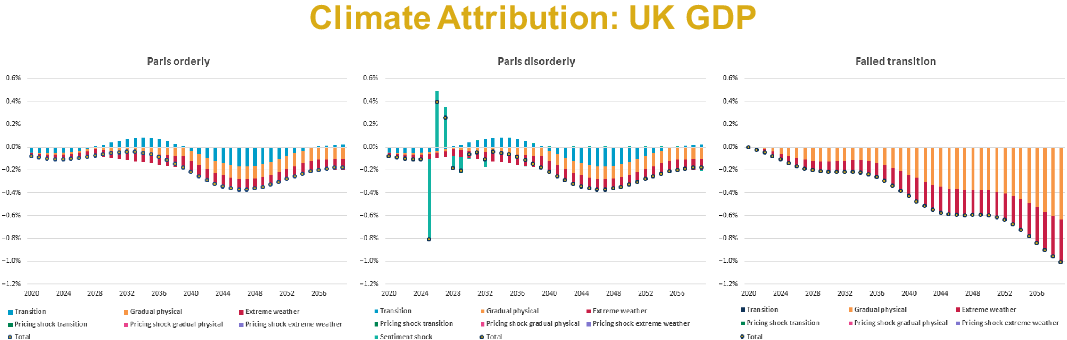
We can move on to look at the attributions within the UK, which are illustrated in Figure 11. These are divided between the Transition (the cost of the Transition policies, the decommissioning of the fossil fuel production); the gradual physical risks; the extreme weather risks; and the sentiment shocks. From the graphs, which are presented here on the same scale, and within the paper, on different scales to illustrate the details. The relatively modest impact in regards to the Paris Orderly Transition is shown. You can clearly see also the sentiment impact that then oscillates before settling down within the Paris Disorderly, and the gradual, increasing and larger longer-term impacts within the Failed Transition.
Figure 11. Climate attribution: UK GDP.
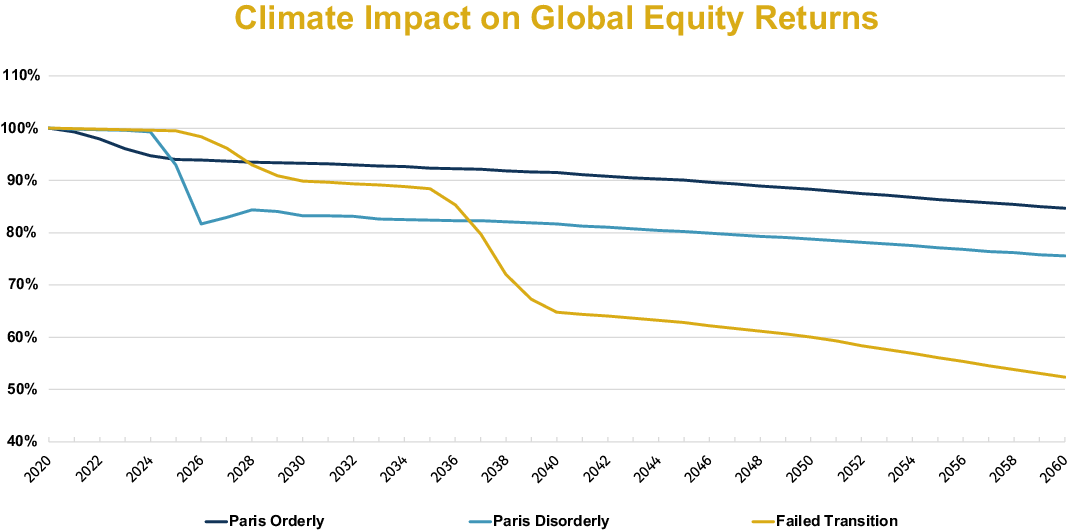
Moving on to the financial impact, we present this across the various asset classes in the paper. Here, in Figure 12, we illustrate this for global equity. It can be seen that the Paris Orderly Transition results in a modest but material 15% drop in returns by 2060. For the Paris Disorderly Transition, we can clearly see the impact of the sentiment shock that occurs in 2025. There is a partial recovery, which means the sentiment shock leads to an overall 25% reduction in GDP. The largest impact, reflecting the large decline in GDP comes from the Failed Transition. You can see the two pricing-in effects of the longer-term physical risks within the period 2025 to 2030 and 2035 to 2040. This leads to almost a 50% reduction in equity returns relative to the baseline by 2060.
Figure 12. Climate impact on global equity returns.
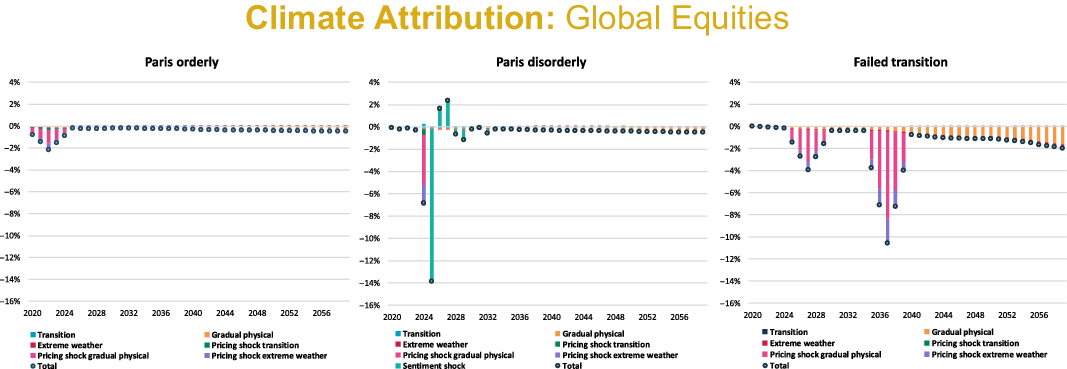
Figure 13 illustrates the attributions to climate impacts within global equities to the different impacts with more details given in the paper.
Figure 13. Climate attribution: global equities.
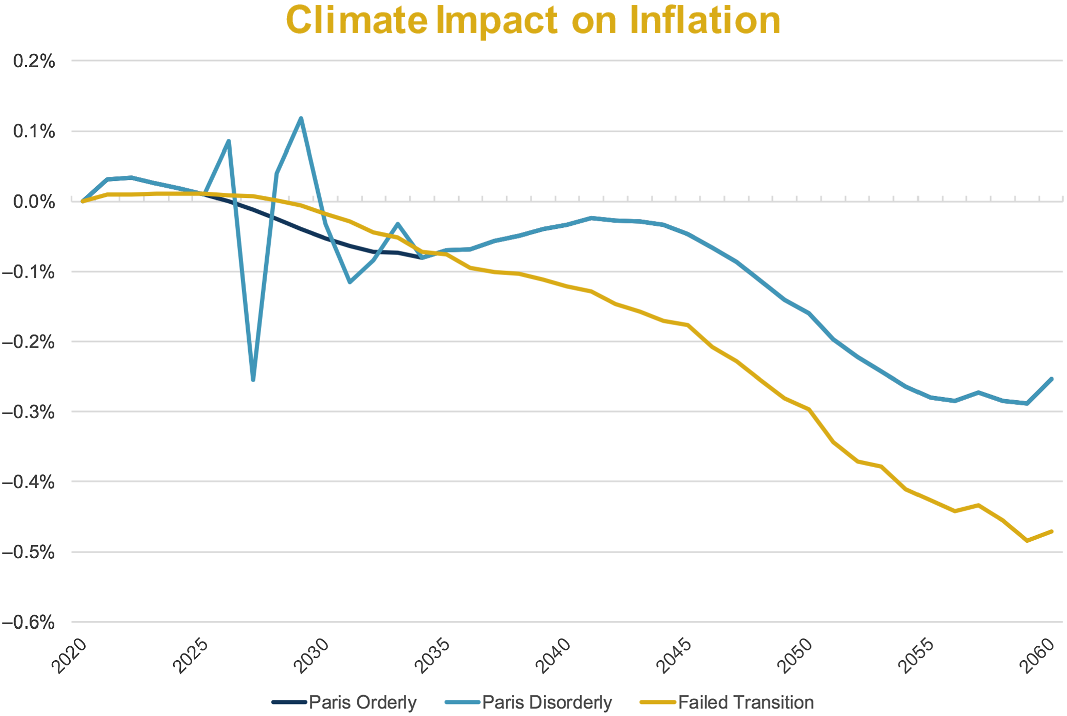
Likewise, Figure 14 shows the impacts with regards to inflation and how they decline in both the Paris-aligned and the Failed Transition.
Figure 14. Climate impact on inflation.
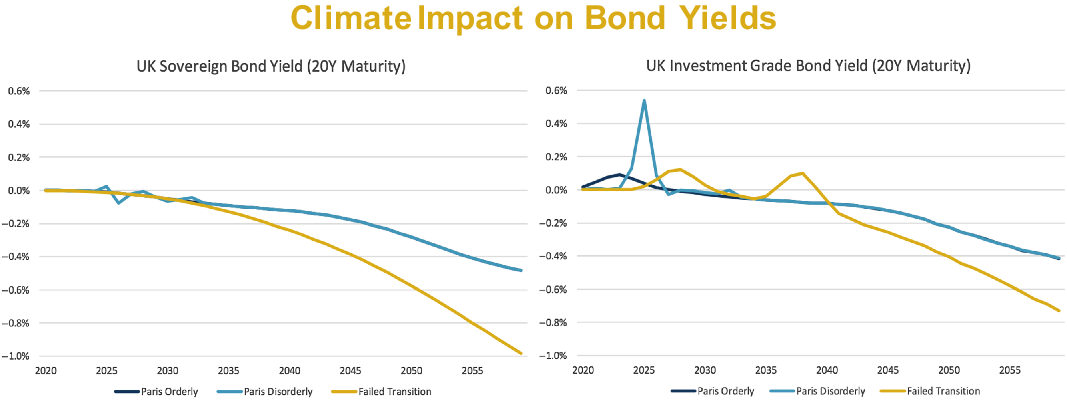
Figure 15 shows the attributions and impacts on bond yields. This decline in sovereign bonds largely reflects the declines in GDP. See Figure 16.
Figure 15. Climate impact on bond yields.
In the paper we also illustrate the impact on bonds with higher credit spread which is more variable reflecting the creditworthiness of the underlying companies across the differing pathways.
Andrew (Claringbold) will now discuss the impacts within the case studies that we presented.
Mr A. W. Claringbold, F.I.A.: I am now going to take these pathways and apply them to a typical pension scheme, finishing off with “so what?”
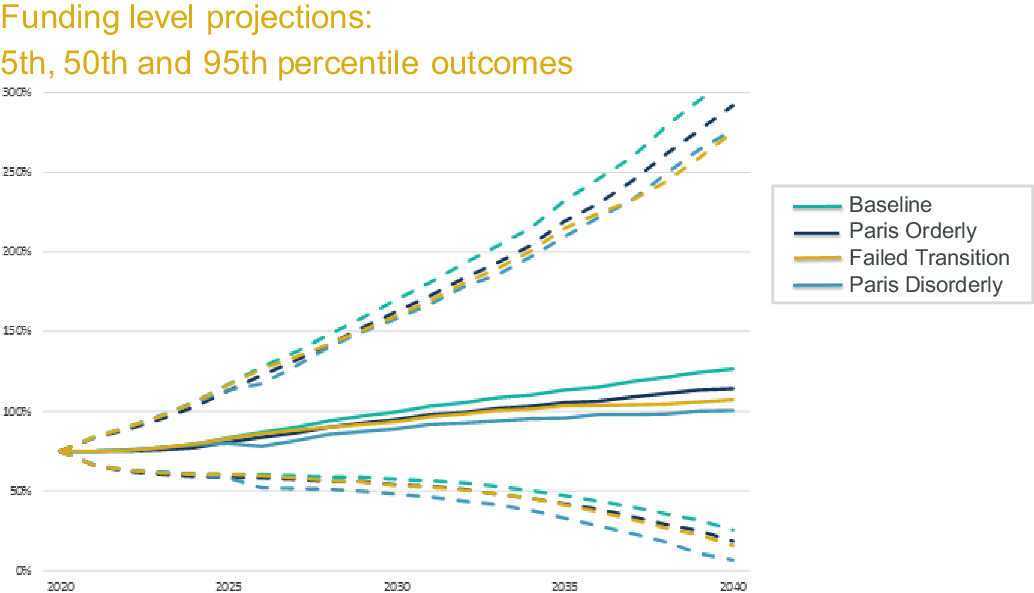
So, moving onto the modelling of the scheme, the key features are that the scheme is around 75% funded against a low risk, long-term funding target, which is around 50% invested in growth assets and around 50% of the liabilities are hedged against gilt yield and inflation movements. More detail is included in our first paper. This investment strategy will remain unchanged for 10 years but will then gradually change to a strategy of 100% bonds and 100% liability hedging over the ensuing 10 years. Figure 17 shows how our client pathways would impact on the funding level over time. The model is a stochastic model and so we have shown 5th, 50th (median), and 95th percentiles. As you can see, the median funding levels reach 100% between 2030 and 2040, but there is a lot of uncertainty around this. I am going to focus on the median because it does bring out the key points. In practice, I would expect pension schemes to focus on more adverse outcomes than this.
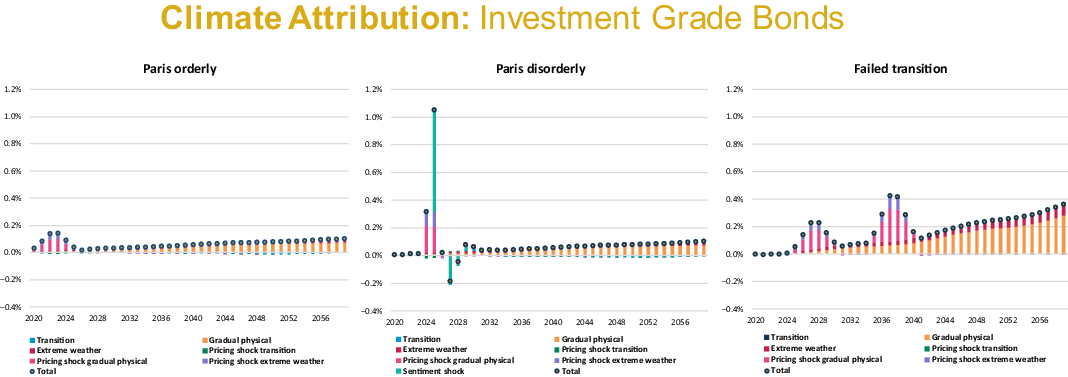
Figure 16. Climate attribution: investment grade bonds.
Figure 17. Funding level projections: 5th, 50th and 95th percentile outcomes.
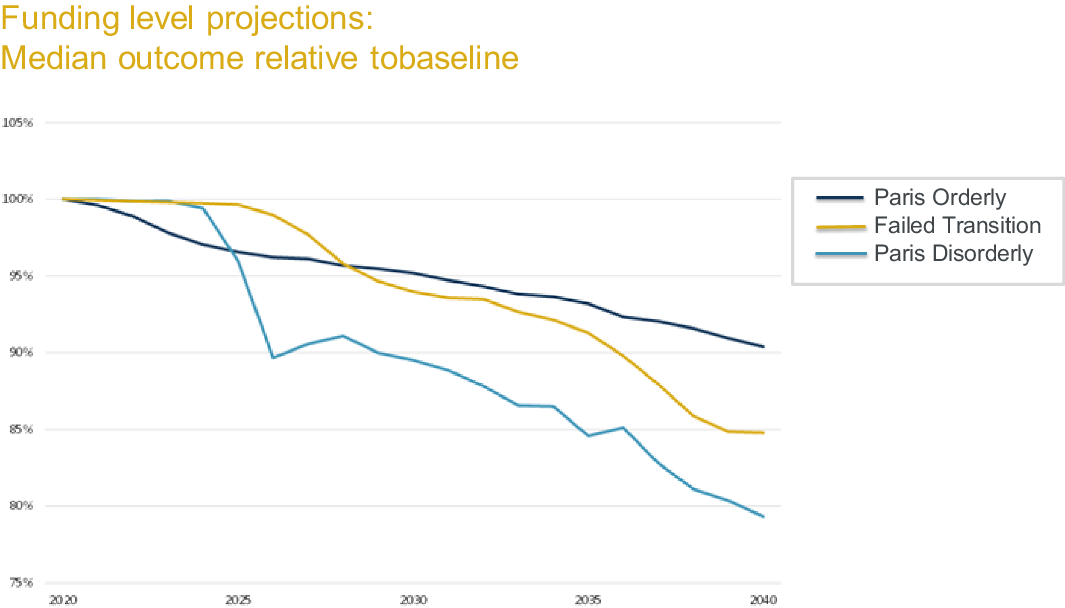
Moving on to a zoomed-in analysis of the median, Figure 18 shows the funding levels that would arise under the different climate pathways relative to the climate uninformed baseline. So, for example, the funding level under the Paris Disorderly Transition, which is the light blue line, ends up 20% lower than that under the baseline by 2040.
Figure 18. Funding level projections: median outcome relative to baseline.
There were three key conclusions I wanted to draw from this graph. The first is that the projected funding level, under all of our climate change pathways, is worse than under the climate uninformed baseline. They all lead to it taking three to 9 years longer to reach the long-term funding target. The baseline is consistent with the same levels of physical climate damage and fiscal shocks we have seen in the past, and makes no explicit allowance for an increase in fiscal risks, or a change to a low-carbon economy. We think this is what is largely priced into the market and climate change risks are not yet being fully captured. In terms of which of these pathways is the most damaging to pension schemes, for this pension scheme it is the Paris Disorderly, where the funding level is 20% lower than the baseline in 2040. This is probably fairly typical. What is not immediately obvious from the graph in Figure 18 is that the impact in this example is driven, mostly, by the investment returns up to 2030. From 2030 to 2040 the scheme is reducing risk so it is less exposed to climate change. This is why the Failed Transition does not look the worst, despite having the biggest impact on GDP long-term. However, we also considered this scenario in our paper where it does not reduce risk, and this may be the case if it is below target after 10 years. The two Paris pathways do not end up significantly different compared to the risk reducing strategy. However, the Failed Transition now does end up being the worst, with the funding level being 25% lower than the baseline after 20 years. As you can see, this will vary from scheme to scheme.
Now I want to make some comments about other risks. Whilst we believe these are excellent models, they do not capture all of the risks associated with climate change. They certainly do not represent extreme scenarios. For example, there are other plausible scenarios that could lead to even more adverse impacts. The Cambridge Institute for Sustainability Leadership has come up with scenarios where markets respond sooner and experience greater drops. My firm, Aon, also considers scenarios where nominal yields fall and the government is forced to take immediate actions, but with inflation still rising, so that the actuarial value of the liability has increased significantly. Also, in a more uncertain future, we may well get increased volatility. This is not captured in these models other than to a limited extent in the Paris Disorderly pathway, but as pension schemes mature this can matter, as schemes may end up for sellers and depressed markets.
Finally, the end game for many, if not most pension schemes, would be a buy-out with an insurance company. We have captured the climate change risks on bonds in this model, although even then we have probably understated them because we have assumed that the cashflows can be perfectly hedged. However, we have not considered what will happen to annuity pricing in these scenarios, in an environment where insurance companies may need to increase the reserve they set aside. These are all areas where we think that further research would be useful.
I now want to move on and consider the question “so what?” First, I would say that a lot of trustees are open to, or even keen to consider climate change issues. Increasingly, they are under pressure to do so. However, they are nervous because, over the years, it has been drilled into them that they should not take actions that may be financially detrimental to their members. They felt that taking a stance on issues such as climate change may be considered to be doing just that. However, I think this sort of analysis gives them the evidence and justification to do something. In fact, they may be more exposed, legally, if they do nothing.
So, having decided they want to do something, what can they do? The key action they can take is to consider their investment strategy and its implementation. There is a lot you can do in this space, which I am not going to discuss today. Also, I have not yet considered the employer. However, it is the employer that we are relying on for contributions and to underwrite the risk. But how exposed is the employer in the Paris Disorderly scenario, for example? Will it still be able to pay contributions? Can you try to engage with an employer and understand how resilient it is to different pathways? We are beginning to see covenant advisers considering environmental risks.
Finally, identifying the risks is the first step towards being able to manage and mitigate them. Then you get into the position where you know what you would like to do, should the risk start to materialise, and be able to act more quickly and more effectively. It is difficult to see beyond COVID-19 at the moment, but what COVID-19 does show is the impact that globally integrated events can have on economies and financial markets, and the importance of preparedness.
The Chair: Now we will move on to the questions. Here is the first question: does anybody win in a Failed Transition-Transition?
Ms. Jones: I guess it depends on the time horizon that you look at and that is one of the challenges that came out of the modelling. Over the short-term the Failed Transition, where we continue on a “business as usual” path for at least the next few years, may give the best outcomes. For example, for defined benefit pension schemes with a short-term horizon, the Failed Transition can appear to give quite good outcomes. But as we extend the time horizons and the physical risks kick in it is then hard to see anybody winning in a Failed Transition in the long term.
The Chair: Which I think brings us to one of the other questions, how credible are GDP growth predictions beyond, say, the next 5 years?
Ms. Eichler: Together with Cambridge Econometrics, we decided to model until 2060, as beyond that time horizon we have the potential for severe shocks to GDP of up to −70%. We decided not to quantify the financial impacts beyond 2060.
The Chair: Are the Cambridge Econometrics models that we have used bespoke? Were they particularly for this research purpose, or are they generally available models? Could an actuary obtain these models and, if so, do they get them from you or do they get them from Cambridge, or from some other source?
Ms. Eichler: The underlying E3E model that has been used for the past 30 plus years, especially for policy making in the UK and the European Union, is not bespoke. What is bespoke, of course, is how we combined the Cambridge Econometrics information with our own information on extreme weather events and the financial implications of these. I should say that these are also, of course, commercial versions so they are not free. However we are also collaborating in an open source climate platform, where we expect from next year on there will be various types of these climate scenarios, including the ones from Cambridge and ourselves.
The Chair: We have got some questions about the modelling. Does the macro-economic model include population impacts that include the possibility of defection from consensus? For example, if the US decided to increase its consumption of fossil fuels, taking advantage of lower fuel prices, how does the Paris Disorderly Transition compare to what we are currently experiencing under COVID? Have we had the Disorderly Transition already?
Dr Kramer: I will start with the last part, which is the Disorderly Transition. I would say no, we have not already seen this Transition happen. What we have seen in the last few months is that fossil fuel equities in particular performed more poorly than other equities. So in that case we might say that there is at least some part of the Transition priced in now, but definitely not all of it. And still a lot of it needs to happen, so I would expect another negative sentiment shock in a few years’ time when the full impact of the position will actually become clearer than it is now.
When you look at the scenarios that we generated, looking at population impacts and defection from consensus based on the Cambridge Econometrics analysis, we get information on what needs to happen to remain below two degrees. That is from a global level, so all countries need to put effort into this process. So I don’t think we explicitly take into account that some countries might profit from this. What we do, together with our clients, is to also construct all kinds of alternative scenarios where we do include these kinds of questions. These are the more bespoke alternative scenarios where we combine different views.
The Chair: Did the modelling produce any surprising results? Or were they broadly what you had in mind before you started?
Mr Spencer: The surprising results for me started this paper and process. It was seeing some of the outputs from the model and their implications in last year’s London Climate Action Week that prompted me to join with this group and Ortec Finance in producing the papers. Having seen some of these long-term implications, the results did not surprise me in that regard, nor in terms of the outputs. What I have been impressed with and really appreciated, if you look at the attributions, is how much detail there is underlying the modelling and how this really considered the long-term physical impacts. This has not been a part of our traditional way of (actuarial) modelling and was a new feature. I think that the changes and impacts of that are very material. So, yes and no, if you like, is the answer.
The Chair: Does a growth asset have any meaning in this context?
Dr Kramer: The concept of a growth asset is a bit misleading when you end up in a Failed Transition, of course, where GDP ultimately might decrease. So in that case “growth asset” is not the appropriate term, when you talk about equities, for instance. But you can say it is a risky asset.
The Chair: So, let us think a bit more about what all of this means for actuaries. In putting together this working group we were specifically looking at pensions. Somebody has asked whether general insurance was part of the scope of our work and the answer is “no”. They then go on to ask whether there are other applications where this research is being used or can be used in the general insurance world. Lisa (Eichler), is Ortec Finance specifically using this modelling technique with pensions, or do you use it with other insurance type applications as well?
Ms Eichler: I would say we are using it across the board for pensions, but also insurance companies and asset managers are using these climate scenarios.
The Chair: But that is essentially on the asset side, so not necessarily on insurance risk exposure, for example?
Dr Kramer: There is an impact of climate change on life expectancy and on mortality rates and so it is relevant to both insurance companies and pension funds. What we see is that cold-related mortality will decrease and heat-related mortality will increase. Which means that countries where heat-related mortality is already dominant will probably see increased mortality rates even in the short term. In countries where cold-related mortality is dominant you will see that, let’s say, for the first few decades or so, it might actually be the case that mortality will go down because cold-related mortality will go down faster than heat-related mortality will go up. On the P and C side, we also worked with a number of insurance companies to look at the impact of extreme weather events on the liability side.
Ms. Jones: One of our working party’s earlier papers looked at the impacts of climate change on mortality. Other people’s research has looked in quite a bit of detail at the impact on cold and heat-related deaths, but one of our conclusions was that there will be other impacts on mortality. In particular, if we are in climate scenarios where GDP is affected, and so there is less money available for spending on healthcare and so on, that actually could have quite a significant impact on longevity and potentially outweigh the impacts of the temperature changes over the next decade or two. That is something that the working party has thought about, but it is not included in the modelling we are discussing today.
The Chair: We were specifically looking at Defined Benefit (DB) pensions in our work in these two papers. How relevant do you think this is for Defined Contributions (DC) pensions and how should actuaries working in DC be including climate scenario modelling in the design of the plans, especially given the longer time horizon for DC?
Mr Spencer: When we think about DC, if you look through the paper, the larger impacts are unsurprisingly on the more volatile assets – equity and return-seeking assets. And, obviously, in a DC you would have more of those. So understanding these impacts, when you think about the scheme design and the long-term potential returns, is important. But, I think it is important to think through the implications in two further ways. One is to think through the implications from an investment perspective. We comment briefly on some of the sector impacts in the paper, but considering the ways in which those risks can be managed and mitigated over the longer term becomes more important. And from a DC perspective there is also the point about the interest of the members. Mike Clark in the Q and A has referred to “Make My Money Matter”, which is a campaign that’s expected to launch in the second half of this year, to talk about member interests in climate impact. Actuaries should be thinking about where members wish their money to be invested, as well as this financial impact.
The Chair: Does the panel believe that actuaries should adopt new standards in how they use and present long-term asset returns? This will affect not only pension actuaries but also life actuaries. Do the professional standards need to be adjusted to cope with this?
I developed the professional standards some years ago and I have to admit that my familiarity with the details of the pensions and insurance standards is less than it was when we originally prepared them. My feeling is that the technical actuarial standards and the professional standards that the IFoA produce try to be very principle based and outcomes-focused, and do not go into great detail. So, in theory, I do not think we should need any major changes because it is becoming more and more obvious to more and more people that these climate risks are significant, and that they are material. So, it should be difficult if not impossible for actuaries to ignore them in their work. What I do think is that there should be more support for actuaries doing these new types of analyses in their work, helping them to work out what the best ways of doing the analysis are and what the most useful ways of thinking about them are. I expect that this will be a rapidly changing area where good practice emerges as people do more and more of it.
Mr Claringbold: I agree. As you say, the standards are principles-based. They talk about material risks and we should be addressing them. The difficulty is that there always seems to be something more short-term and immediate. Currently we have COVID-19. Before that we had Brexit and we might well come back to Brexit again. The difficulty is getting the recognition of climate change, and other long-term general social and governance issues, moved up the agenda.
The Chair: I do think that it is something that we all need to be aware of, as actuaries, is that the landscape is not necessarily the same as it was when we trained. When I trained as an actuary, which was more than 30 years ago now, climate risk was not on the horizon and, yet, to my mind, it is a major risk that actuaries and risk professionals should be thinking about now.
Mr Claringbold: It would be interesting to see what lessons we learn from COVID-19. There is a lot of focus on COVID-19 at the moment, quite rightly, and climate change is not high up on most trustees’ agendas. But COVID-19 does show what big impacts global events can have on markets. And how well people are prepared to deal with global events can make a big difference to the outcomes. So I do see that there are a lot of lessons that can be learned from that, and hopefully there can be a lot more focus on this in a year’s time.
The Chair: Let’s think about the modelling a bit. To what extent does the model allow for markets adapting to price future climate impacts into the assets?
Dr Kramer: We do assume, of course, that different financial markets are interconnected so that, for instance, stock markets, corporate bond markets and real estate markets essentially start pricing in at the same time. So, we see similar behaviour and we assume similar behaviour in those markets in the coming years. Hence, when in the stock markets price corrections are materialising, we assume that this also impacts spread levels in corporate bond markets. When stock markets go down, corporate bond market spreads go up. We also assume that when stock markets come to realise the future impact of climate change and the Transition, this will also impact real estate markets; in the sense that physical exposure will impact future income in real estate investments but also lower economic growth will impact future market rents, for instance, and this will also be priced into real estate markets.
The Chair: Is there an element of climate risk already factored into market assumptions?
Dr Kramer: Yes. We assume that, of course, current transition policies are already priced in, but for instance the IMF states that markets are pricing in increasing physical risks far too little. So there is still a lot of future climate impact that needs to be priced in.
Mr Spencer: Not only is it a question of what is priced in, which is modest if you look at the different impacts, but you will see how the different pathways produce quite different returns. Actuaries need to think about those different pathways irrespective of their view of what is priced in. So, they may think that one path is already priced in the market, but actually I think the other thing this analysis does is show that the market can’t possibly price for each of those pathways happening. Furthermore, as we explain in the paper, these are not the most extreme scenarios, they are merely meant to be representative. They are not stress cases. And so, when we think about risk, we should be thinking about the potential to go down, and beyond, any one of these different pathways.
The Chair: Would a larger holding in ESG assets change the results under the three scenarios? Have we actually seen any benefit over the COVID crisis? Do the ESG assets do any better?
Mr Spencer: In brief, yes, particularly the oil sensitive assets. The interesting part of the COVID crisis is obviously how things like travel have been impacted. Although the net results from the ESG indices might look quite modest, the impact on specific industries has been large. There are also measurement issues when we come to ESG, and the ESG and a climate transition are not in direct alignment. But, I think to interpret the question more abstractly, you are saying that if you had a strong Paris-aligned transition, or what the PRI refer to as an inevitable policy response that mitigated those risks, then almost certainly you would have done better in the first quarter, as the COVID impacts came through. So there are definitely parallels within this in terms of both the oil pricing and the use of fossil fuels and economic activity that is dependent on travel.
Ms Jones: Perhaps if I can just respond on the question of how we might factor the different ESG characteristics of portfolios into the modelling. That is something that is not readily incorporated into the framework we have because the modelling is top-down and so it just makes the same assumption about equity performance regardless of precisely which companies the assets are invested in. So the alternative approach is the bottom-up one that I mentioned during my part of the presentation, where you are looking at the impact of climate scenarios on individual assets within the portfolio and aggregating upwards. That is a complementary approach, which is the best way of looking at how different ESG funds might enable you to mitigate your climate risk exposure.
The Chair: What about sponsor covenant? Obviously we did not model sponsor covenant directly in our work, but how might sponsor covenant interact with this modelling? Are there points in the modelling where the impact to GDP is so severe that many sponsor covenants fail and people do not receive their pensions at all?
Dr Kramer: Of course, it would depend on the sector that a specific sponsor is operating in, I would say. When we succeed in Transitioning to a low-carbon economy, of course, sponsors in the fossil fuel and the brown utilities sectors will lose a lot of production, and their current output levels and profitability will fall. Other sectors will, of course, be more resilient in a Transition pathway.
Mr Claringbold: I think one of the advances of these scenarios is that they do provide descriptions. This means that you can actually read, for example, in the “Paris Disorderly” Transition, the description scenario and say how, exactly, my sponsor is going to behave in that scenario.
The Chair: We will finish off by going around all the speakers to ask if there is anything they would particularly like people to take away from this work, and also to ask whether they have a view as to how we can work to integrate some of this type of thinking into the everyday thinking of actuaries.
Mr Claringbold: The main thing I would say is do not assume that trustees are not interested. What I mean is, it should not be the actuaries or the consultants who are the ones not raising it. A lot of trustees are not interested when you take it to them, but a lot are. So what I would say is to make sure you are taking it to them with solutions as well. You do not just want to give them problems. We should not be the ones creating barriers to looking at it.
Dr Kramer: I think awareness is ultimately the most important thing. No one wins in the long-run in a Failed Transition pathway. Actuaries and society as a whole should do their utmost to ensure that the Transition succeeds.
Ms Eichler: Speaking more from the climate science side, I think what is very important is increasing awareness and there are many tools coming out to help integrate this into everyday investment decision-making. I would encourage everyone not to let the unknowns stop you from acting now because, from the climate science point of view, it is the next 5 to 10 years where the world can still go on the different paths. That time is ticking by quickly and at some point we will be locked into the Failed Transition and then there will be no more choice.
Ms. Jones: I would just like to finish by picking up on one of the questions that came through that we have not specifically addressed, which is how we might see the adoption of climate scenario analysis pan out. I mentioned that the Bank of England was encouraging insurers to look at climate risks and its work on the biennial exploratory scenarios will surely encourage the adoption of climate scenario analysis within the insurance sector. Then, within the pensions sector, we have got some draft guidance out for consultation at the moment from PCRIG, the Pensions Climate Risk Industry Group, that recommends that all defined benefit pension schemes and defined contribution pension schemes in the UK undertake climate scenario analysis. There is also an amendment to the Pension Scheme Bill currently before Parliament that will make climate scenario analysis mandatory, we expect, for large UK pension schemes. So, I think, that regulatory shift will encourage actuaries to place much greater emphasis on climate scenario analysis within the next year or two, and we should be on the front foot with that.
Mr Spencer: I just want to pause for a minute and reflect on the Failed Transition, which projects a 70% drop in GDP, a 50% drop relative to baseline by 2060 in equities, and that clearly needs significant thought in terms of actuaries in their own work. As actuaries, the question we should be asking is “what does this mean for the financial system”? How does this impact on solvency and the work that we do? How should we relay this to regulators and the policy-makers? We should be bringing forward the financial imperative to address a Failed Transition, and we should be really thinking about the ways that we can actually help the financial markets to start acting against that, rather than what is actually projected in terms of the financial markets, if it were to happen.
The Chair: I would encourage everybody here to think about what they have seen today, to read our papers, and to think about what they should be doing, both to help their clients and employers, and also to think about some of the implications and emphasise that this is a major threat to society and how we operate. What is the world going to look like in 40 or 50 years’ time? We can’t just sit here and say, actually, it will all be all right, nothing will change really, because in reality things will change a lot and we need to think about how we want them to change.
Additional questions from webinar
Has there been any modelling on how these scenarios may impact on life expectancy as well? I presume there may be some offset for pension schemes from financial impacts?
In the current case study, we did not take this into account. But this topic has been researched. In the Paris Pathways, life expectancy is expected to increase in the UK as the expected decrease in cold-related mortality is larger than the expected increase in heat-related mortality. In a Failed Transition pathway, in the coming decades life expectancy will still increase, but this trend will probably stop by the end of this century as heat-related mortality will dominate cold-related mortality by that time. See for instance: A. Vicedo-Cabrera, F. Sera and A. Gasparrini (2019). Hands-on tutorial on a modelling framework for projections of climate change impacts on health. Epidemiology, 30 (3), 321-329.
An IFoA working party published a paper on environmental impacts on mortality in 2018. The paper focuses on air pollution and temperature-related deaths, since this has been the focus of most of the quantitative research into environmental impacts on mortality. However, other environmental impacts may be more significant. In particular, they could have macro-economic effects such as lower economic growth and higher food prices, resulting in lower healthcare spending and poorer nutrition. These have the potential to far outweigh the impacts of better air quality and milder winters, and could work in the opposite direction.
Did the modelling produce any surprising results or broadly were they what you were intuitively thinking?
We answered this within the webinar. But to add a couple of further observations, the overall outcome is not surprising if you compare with some of the physical risk predictions for a 4 degree warmer world. It is broadly consistent with statements such as that of Thomas Buberl, the CEO of AXA, who commented that a “4 degree warmer world is uninsurable”. Those interested may also be interested in the underlying climate science. Nick Spencer referenced these long-term projections when opening the IFoA Sessional meeting in November 2018. His remarks can be summarised as:
“ALLIGATORS basking off the English coast; a vast Brazilian desert; the mythical lost cities of Saigon, New Orleans, Venice and Mumbai; and 90 per cent of humanity vanished. Welcome to the world warmed by 4 °C.”
So started, a 2009 New Scientist article based on the then latest Science from a Met Office conference.
Why quote this article?
Well, 4 degrees is often used in scenario projections and it is the current trajectory suggested by many sources including the US government. And yet, I quote 2009 article as most sources that I can find come from that 2009 conference & a follow on in 2011 albeit that the science since then has generally suggested larger not smaller impacts
Understanding the implied real-world impacts is important for scenario modelling. Otherwise there is a potential disconnect if economic influences are merely extrapolated. I encourage all actuaries to look into the climate science to get a broad sense of the implied reality. What is implied by, say, peak carbon emissions in 2020 or by projecting a 4 degree warming?
4 degrees warmer is more than the Pliocene, three million years ago when the northern hemisphere was free of glaciers and sea levels were 25 metres higher. The 2009 science based predictions for a 4 degree warmer world include:
-
Summers in the south of England regularly reach 45C, akin to today’s Marrakesh. Desertification of Europe south of the Alps, making South of France, Spain, & Italy as uninhabitable as the Sahara is today.
-
Uninhabitable desertification also applies to the Middle East, whole South of US, and almost all of Africa
-
85% of the Amazon forest is lost. Ocean acidification leads to a collapse in fishing stocks
-
Sea levels: conservative estimates have 2 m rises in the next century with long-run estimates from 9 m to 40 m or more
-
and I haven’t even touched on the impact for agriculture which is likely to be significant even at 1.5 or 2 degrees of warming.
Now, I’m not a climate scientist, and can’t vouch for this work. These predictions not come to pass or may reflect worlds at 5, 6, 7 or 8 degrees of warming. But I am struck by the disconnect between some economic modelling and the impact on civilisation that even more modest versions of these projections suggest.
As a profession, actuaries should become better aware of these potential physical impacts to ensure realism in our projections and to better highlight the transition imperative of an inevitable policy response.
The work in the Long-term Impacts paper presented in this webinar provides a more quantitative basis to these high-level remarks.
It would be most useful to see sensitivity analysis on these scenarios, especially if the outputs didn’t actually tell us anything new, for example, a different baseline scenario which isn’t so rosy, different asset strategies, etc. What are the future plans of the working party?
In the working papers, we also discuss the results when the pension fund does not change its investment strategy. Alternative asset strategies can easily be analysed using Ortec’s model, but this is not something that is currently scheduled by the working party. With respect to alternative baseline scenarios: of course the current COVID pandemic also impacts the baseline. Future expected returns will be negatively impacted for the coming years in all pathways. But we do not expect that the relative differences between the baseline and the climate pathways will be impacted significantly. So, the conclusions will be similar, but more negative overall.
Have you explored the impact of error propagation in the models, considering the uncertainty (parameter, model, etc.) associated with each stage of the modelling?
The stochastic scenario model used to model the baseline does take into account parameter uncertainty, so this is incorporated in the scenario set. We did not explicitly consider uncertainty in the climate impact modelling within our two papers. However, the model can be used to construct and analyse alternative bespoke climate pathways to analyse the impact of different climate modelling choices and assumptions. Ortec Finance can undertake this work with their clients.
The slide showing asset growth median and tails under each scenario seems to suggest that the variation arising from climate change is massively dominated by the variation arising from macro-economic noise. Given this, are actuaries justified in incorporating climate change into their analysis?
It is true that the uncertainty/bandwidth in the returns projections in the climate-uninformed baseline is already substantial, and that the median impacts under the climate pathways modelled are well within these probability bands. However, these climate pathway impacts can still substantially impact expected returns, and therefore the achievability of a scheme’s funding plans. Moreover, as explained in the papers, the scenarios considered are not intended to be extreme and the modelling is likely to have a bias towards optimism. Therefore, in the authors’ opinion, actuaries should definitely incorporate climate change into their analysis.
Was a general insurance angle part of the scope of the research papers? Aside from the use of climate change models – in parametric trigger general insurance products – are there other applications where this research is being used/can be used in the GI world?
The general insurance angle was not explicitly part of the scope, although the results are relevant, particularly for longer-term modelling. This type of modelling is used by other institutional investors across the globe, like insurance companies, sovereign wealth funds and banks.
Is it, or will it be, the professional duty of IFoA-member advisers to present analysis like this to trustees?
Draft guidance from the Pensions Climate Risk Industry Group sets an expectation that all UK pension scheme trustees will conduct quantitative scenario analysis. The Pension Schemes Bill currently before Parliament is expected to make TCFD reporting, which includes climate scenario analysis, a legal requirement for large schemes. Hence, we expect climate scenario analysis to become a standard part of trustee funding/investment advice within the next few years, although some trustees might focus on bottom-up analysis rather than top-down analysis like ours. Regardless of regulatory/legislative developments, we expect actuaries to support trustees in meeting their fiduciary duty to understand and manage the risks to their pension scheme; and believe that analysis like ours is a useful tool for doing that in relation to climate-related risks.
How reliable are the assumptions under the climate modelling?
The modelling results for impacts on economic and financial indicators clearly depend on a large body of analysis that links economic activity to global warming via GHG emissions, and global warming to economic activity via gradual and extreme physical impacts. The relationship between cumulative net GHG emissions and global warming has been extensively studied by the scientific community and summaries of the evidence are reported, for example, in the IPCC assessment reports. While predictions are always subject to uncertainty, the consensus is currently strong. The relationship between global warming and impacts on economic activity is much more uncertain, as can be seen in the debate following the 2006 Stern Review, a review that pioneered estimates of economic impact. Some economists, notably in the US, have produced modest estimates of GDP impact even from warming of 3°C or more, but these estimates are contested and make no allowance for the potential acceleration of change that could occur if tipping points are crossed. The uncertainty is compounded by the fact that historically-observed differences in economic prosperity across time and location are consistent with various functional forms, some of which imply much stronger GDP impacts than others. Also, the data on these existing differences do not reflect what could happen in a world in which there is much more energy stored in the global geophysical system.
Could you give us an indication of how we expect climate change to affect valuation of Direct Investments/Real Estate assets?
Commercial real estate is driven by the same factors as equities: economic growth expectations, inflation and interest rates. Economic growth drives market rents and the probability of vacancies. If expected economic growth is lower this decreases expected future rental income, just like it impacts expected earnings and dividends for listed equity. Therefore, when a pricing-in shock materialises on the stock market, this will also impact real estate markets. Furthermore, real estate markets are directly impacted by extreme weather events via direct damage to properties. See Appendix F of the Long-term Impacts paper for more details.
Have you been able to use any historical data to calibrate the responses of the macro-economic variables to the climate change scenarios, or is it mainly judgement and trying to think through all the linked impacts of climate changes?
For the responses of macro-economic variables to global warming, see the earlier answer to “How reliable are the assumptions under the climate modelling?” In short, the estimates of physical impacts draw on literature that estimates the relationship of macro-economic outcomes to temperature differences from historical data, but such estimates have a wide range of uncertainty. For the response of macro-economic variables to transition policies, the modelling that drives these results depends on (1) estimates based on historical data for the response of energy use to changes in economic activity and prices; (2) models of take-up of new technologies that are fitted to early take-up data but that are necessarily subject to greater uncertainty (e.g. we do not have much data on take-up of electric vehicles beyond the “innovators” and “early adopters” groups); and (3) estimates of future reductions in the cost of clean technologies in response to larger market take-up, based on past experience and opinion from technology experts (also subject to great uncertainty, as evidenced by the underestimation of the dramatic fall in solar PV costs over the past 15 years).
Why does the graph on slide 27 not mirror the graph on side 26? 26 shows funding level currently of 75% trending upwards, but 27 shows all scenarios starting at 100% trending downwards?
Slide 26 shows funding ratio levels, whereas slide 27 shows ratios (median funding ratio climate pathway/median funding ratio baseline). For all three climate-informed pathways, even though the median funding ratio increases, it does not keep up with the baseline median funding ratio development.
How were the financial shocks modelled?
In short, current equity valuations have not yet (fully) priced in the impact of a change in expected future economic growth caused by climate change. We apply a standard corporate finance pricing model to translate changes in expected future growth at country–sector level (from the E3ME model) into regional and global equity market shocks. More detail is given in the paper.
What can we as actuaries do to increase the credibility of the scenarios? This would naturally lead to the increased awareness of the decision-makers.
The authors think the climate pathways are credible and consistent with IPCC projections. Therefore the question is how do we raise awareness with decision-makers? We believe that this is very important. A first step for actuaries is to take the work of economists and long-term climate projections and help translate them into economic and financial terms. This shows that we either find the transition investment now, or we won’t be able to pay later (with ever greater impacts caused by passing through “one-way doors” of irreversible damage.) The second responsibility of actuaries is to bring these facts, these risks, to the attention of regulators and policy-makers, which is clearly acting in the public interest.
To what extent does the model allow for markets adapting to price in the future climate impacts into assets?
It makes allowance for all listed assets and real estate. The paper provides details.
How does sponsor covenant interact with this modelling i.e. are there points in the modelling where impact to GDP is so severe that many sponsor covenants fail and people don’t receive their pensions at all?
The implications of climate risk for sponsor covenant can be considered as an overlay to the modelling. Figure 9 in the second paper (“Climate scenario analysis: an illustration of potential long-term economic & financial market impacts”) shows how average equity returns might vary by sector under the three scenarios considered and this could provide a starting point for such analysis, combined with knowledge of how the sponsor’s climate risk exposure and climate risk management differs from the industry average.
The probability of sponsor insolvency may be higher under some scenarios than in the baseline case, particularly where GDP is significantly lower. We note that, for the scenarios modelled, the most severe economic impacts occur under the Failed Transition pathway over the longer term. Over time, the proportion of defined benefits expected to be provided by insurers is expected to increase and so the solvency of insurers will become increasingly important to the question of members’ benefit security.
On the “so what” question – did you test the outcomes using e.g. different investment strategies and how much difference did it make? Can the trustees do anything that would actually make a difference?!
Our case study paper illustrates the impact of maintaining the same asset allocation throughout i.e. not reducing investment risk from 2030 onwards. We did not test other investment strategies in detail, but in the paper we comment in high-level terms on the impact of differing high/low risk asset allocations and the sensitivity of the results of the timing of switches out of high risk assets relative to market pricing shocks. The modelling suggests that reducing the allocation to higher risk assets such as equities will, on average, reduce the scheme’s climate risk exposure. In practice, we would expect trustees to first look at the extent of their climate risk exposure within asset classes and seek to reduce it, for example by switching into a low-carbon equity fund or amending segregated mandates to require decarbonisation over time.
With Covid we are contemplating entrenched negative interest rates and/or inflation. Given the major climate impacts, ageing populations and pressure on resources, how far do these factors come into the analysis?
The impact on interest rates and inflation of ageing populations, climate change and pressure on resources are explicitly taken into account. However, as the analysis is based on the December 2019 situation, the analysis does not reflect the impact of COVID.
How would a larger holding in ESG assets change the results under the 3 scenarios in the case study?
In a Paris transition pathway, when your portfolio is tilted towards low-carbon electricity and underweighted in fossil fuel sectors, this improves returns. As the modelling is top-down, it is not able to reflect granular differences in the ESG characteristics of assets. Instead, it can be complemented by bottom-up modelling that explores the extent of climate risk exposure within asset classes.
Is there an element of climate risk already factored into market assumptions?
In our modelling, we assume that only current climate policies and current levels of physical risks and extreme weather event impacts are already priced in. Hence, we assume that equity markets are ignoring the increasing number of natural disasters.
Much pension-related work centres on DB plans. It was good to see some mention of DC in the UK consultation on TCFD but I’m interested in views on how actuaries in DC should be including climate scenario modelling in design of DC plans (investment, benefits etc), especially given a longer time horizon for DC?
The modelling can be applied to DC assets in the same way as for DB. Given the longer time horizons and higher allocation to growth assets, DC schemes will typically have a higher exposure to climate risks than DB schemes. Top-down modelling like that in our paper can help DC trustees to explore the impact of climate change on different investment pathways. Bottom-up modelling (which is currently mainly available for equity and corporate bond portfolios) can then help trustees to select less exposed investment funds to use within those pathways.
Population impacts are going to be really important for pension schemes and life insurance companies, so this is a key component to be missing from the analysis. Is there any plan to try to introduce these? Either by the working party or other groups?
This remains very much at the frontier of research, as robust estimates of the drivers of migration or climate change-related mortality have yet to be established. A large number of drivers are at work and the data are complicated by population movements in response to war or natural disaster that are followed to some extent by people returning to the affected areas when conditions improve. While it would be possible to include formal migration equations based entirely on assumptions and thereby “solve” the problem, we think it would be misleading to do so if such equations have little or no empirical support. In addition, while the IFoA and International Actuarial Association have done significant research on the potential impacts of mortality changes induced by climate change, further research around the temperature/mortality relationship is necessary. Currently, therefore, the way to approach this would be to construct a small number of scenarios for population impacts, with alternative assumptions for scale of response. The working party does not currently have plans to carry out further research in this area.
Do you have a view as to how we can work to integrate this into the everyday thinking of DB pensions – i.e. to maximise the adoption and implementation ASAP – or do you think this will be a gradual adoption?
As mentioned previously, we expect climate scenario analysis to become a standard part of DB pensions advice during the next few years due to legislative and regulatory requirements. This will entail a steep learning curve for actuaries, particularly if their firm is not already developing its climate scenario analysis capabilities, so they should start building their knowledge and skills in this area now. The IFoA is supporting this process through a number of webinars in Summer 2020.
Most integrated climate economy models have their GDP growing over time, which is counter-intuitive assuming climate will have a negative impact on our economy.
There are a range of views on how sensitive macro-economic variables are to global warming (see the earlier answer to “How reliable are the assumptions under the climate modelling?”). Cambridge Econometrics thinks that the arguments against modest estimates carry weight and therefore it adopts higher estimates from the literature. This approach is also consistent with the IPCC view on the urgency of the need to address climate change, which implies more severe impacts from global warming than many Integrated Assessment Models predict.
Are the standard FCA projection rates (2%, 5%, 8%) still relevant? Is it realistic to expect returns as high as 5%?
We do not wish to comment in detail, but note that our projections illustrate why all analysis based purely on historic trends needs to be reconsidered in light of climate impacts that will be different from those implied by historic data.
How do you quantitatively consider interaction (correlation/dependency) between asset classes evolving over time due to climate change?
The stochastic scenario model used explicitly takes into account interactions between asset classes in the baseline. Furthermore, in translating the pricing-in shocks in the different pathways, we explicitly take into account interactions between equity, corporate bond, and real estate markets (for example, when stock markets go down, spreads tend to go up).


 This is an Open Access article, distributed under the terms of the Creative Commons Attribution licence (http://creativecommons.org/licenses/by/4.0/), which permits unrestricted re-use, distribution, and reproduction in any medium, provided the original work is properly cited.
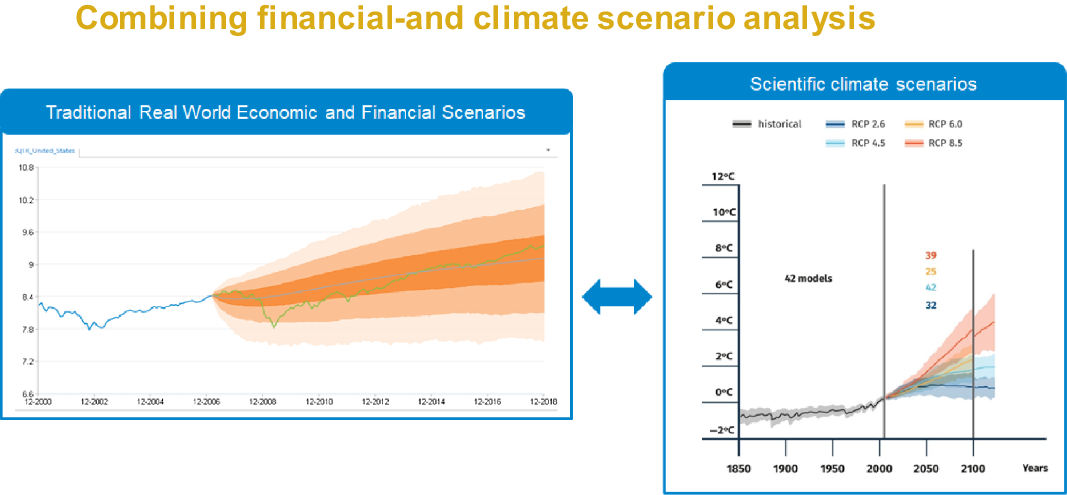
 You have
Access
You have
Access
 Open access
The Chair (Dr L. M. Pryor, F.I.A.): Today’s Institute and Faculty of Actuaries (IFoA) sessional meeting is “A Top-down Approach for Exploring the Economic and Financial Market Impact of Climate Change”. I am Louise Pryor and I am the incoming president-elect of the IFoA, a past chair of the Resource and Environment Board, and a member of the working party that produced the two papers we will be discussing today.
We are discussing two papers that we have written, that look at how climate risk can be integrated into the work of actuaries. Following on from those, we have worked with Ortec Finance to look at how it might be possible to use climate change modelling in pensions actuarial work. We have produced two papers. One looks at a case study of a reasonably typical UK pension scheme, and sees what the effect of various climate change scenarios might be on its funding position. The other looks at the effects of those scenarios on investment performance more generally. Our speakers today are Claire Jones, Lisa Eichler, Nick Spencer and Andrew Claringbold, and also Bert Kramer will be joining us for the panel at the end.
Claire Jones is a partner and head of responsible investment at LCP and she established the working party that produced the practical guide to resource and environment issues for pensions actuaries. She will be starting off by giving us the background to set the scene for our work.
Lisa Eichler is co-head of the Climate and ESG Solutions team at Ortec Finance. She has more than 15 years’ experience working with institutional investors, governments and international organisations on their climate-related policy and strategy questions. She will be describing the modelling we carried out.
Nick Spencer is the deputy chair of the IFoA Resource and Environment Board and was a co-author, along with Claire (Jones) and Andrew (Claringbold), of the early sessional paper. Nick (Spencer) will be looking at the effects of our scenarios on investment performance.
Andrew Claringbold, as well as being an author of this paper, was also an author of the previous paper, and is a scheme actuary in Aon and helped to produce Aon’s climate change scenarios. He will be talking about our case study.
Bert (Kramer) is a business specialist in Climate and ESG Solutions at Ortec Finance and a lecturer in econometrics and finance at the University of Groningen. Bert (Kramer) will be joining to help us answer some of the tougher questions that I am sure you will ask. Let us start by going over to Claire (Jones), who is going to discuss some of the background for us.
Ms C. C. Jones, F.I.A.: I have given many talks on climate change over the years. I have always started by explaining why climate change is important and why we need to talk about it, but I do not feel that I need to do that today. It is now widely accepted that climate change poses a material, systemic financial risk and that we need to act. Not only is there a lot of support for this view within the financial industry, including from the Bank of England and other financial regulators, but there is also strong public and political concern about climate change. Whilst people’s attention is clearly focused elsewhere at the moment, COVID-19 does not diminish the importance of climate change in any way. In fact, it reminds us of the importance of addressing systemic risks and taking action in good time.
Within the financial sector, there has been a particular focus on the recommendations of the Taskforce on Climate-related Financial Disclosures (TCFD). These recommendations have been endorsed by the UK Government. Its Green Financial Strategy, published in July 2019, set out various plans to encourage the adoption of TCFD within the UK, including an expectation that listed companies and large asset owners would be reporting on their climate activities, in accordance with the TCFD recommendations, by 2022. We have since seen significant activity around this. The Financial Conduct Authority is consulting on getting UK-listed companies to comply or explain with TCFD. The Pensions Climate Risk Industry Group (PCRIG) is consulting on draft guidance for UK pension scheme trustees. Meanwhile, the Bank of England has issued a supervisory statement on climate change for banks and insurers and has consulted on investigating climate change in its biennial exploratory scenario next year. Activity is certainly not confined to the UK. For example, central banks and supervisors from around the world are collaborating on climate change through the Network of Central Banks and Supervisors for Greening the Financial System (NGFS).
Turning back to the TCFD, in my view the TCFD’s most challenging recommendation is to conduct climate scenario analysis. One can see that it is a particularly useful tool to study climate change because of the huge uncertainty about how climate might play out. Actuaries clearly have lots of relevant skills here and we are very well placed to help our clients and employers to use climate scenario analysis. The IFoA’s Resource and Environment Board has been seeking to support actuaries with this process. In November 2018 there was a sessional meeting that explored the implications of climate change for setting long-term financial assumptions. Nick (Spencer), Andrew (Claringbold) and I presented on climate scenario analysis that evening, covering the guidance that our working party had produced.
However, we wanted to go further. We wanted to enable actuaries to do broad-brush calculations themselves to get a feel for the potential impact of climate change, without having to develop the scenarios from scratch or to work for one of the organisations that has its own proprietary climate scenario modelling. We therefore researched the various available models for applying climate scenario analysis to financial institutions. We found that most of them were bottom-up approaches that look at the impact of climate change on individual investments and then aggregate across the portfolio. Whilst that is useful for some purposes, we found it problematic for two reasons. Firstly, these approaches are typically only applied to listed equities and corporate debt that do not cover the whole investment portfolio. Secondly, there is no easy way to bring the liabilities into the modelling. Of course as actuaries we know the importance of looking at the impact on assets and liabilities in tandem. So our working party decided that we wanted a top-down approach, and we identified Ortec Finance as having one of the most well-developed top-down climate scenario approaches.
For the last year we have been working in partnership with Ortec Finance on a pair of papers that cover climate scenario analysis. As Louise (Pryor) mentioned, one paper is a case study where we show how Ortec Finance’s model can be applied to a UK defined benefit pension scheme and the potential impact that climate change has on the scheme’s funding position. The other paper provides more detail on the model’s outputs, looking at the impact of climate change on the economy and financial markets, out to 2060. This paper is relevant to a wider audience: to actuaries working in other practice areas, wherever they are located, and also to policy-makers and regulators who are concerned about the long-term impacts of climate change. We are going to present some of our findings today but first I am going to hand over to Lisa (Eichler) to tell you a bit more about Ortec Finance’s model.
Ms L. Eichler: We used our Climate MAPS tool to run the climate scenario analysis we presented in our papers. Climate MAPS integrates systemic climate risks and opportunities associated with different global warming pathways into traditional, multi-horizon, real-world scenario sets that drive strategic investment decision-making. Today, I will briefly talk you through a high-level summary of our methodology as well as the narratives behind the three climate scenarios we analysed. See Figure 1.
Together with our strategic partner Cambridge Econometrics, we determined that climate-informed input data and assumptions. This includes physical risk factors, such as gradual physical risks associated with an increase in temperatures. Here, you can think of how temperatures affect agricultural productivity or worker productivity. Physical risks also include climate-attributable extreme weather event frequency and losses per type of peril and location. See Figure 2.
A second set of climate risk factors focuses on those risks and opportunities associated with a transition to a low-carbon economy. Here, we look at the policy measures as well as technology drivers across sectors and countries that need to come into place to bring the world onto the given climate pathway. See Figure 3.
Next, we capture how these climate risk factors interact with one another and with the global economy, by running them through a Cambridge Econometrics macro-economic model called E3ME. This enables us to capture network systemic effects, such as supply chain dependencies, supply/demand relationships and how these are influenced by the different climate risk factors. This step results in climate-informed GDP and output shocks per country and sector and per year. See Figure 4.
We then use this input to our stochastic financial model and this part of the model, in turn, translates the climate-adjusted GDP expectations over time into more than 600 financial and economic variables via stylised facts based on historic relationships. See Figure 5.
The resulting output is expressed as climate-adjusted growth, expectations and pricing-in dynamics in annual time steps, up to the year 2060. The scenario set includes economic variables, such as GDP, inflation and interest rates, asset class risk, return expectations and sector-level granularity. We express these kinds of adjusted outputs as differences, termed deltas, versus a climate uninformed baseline economic and financial output. Nick (Spencer) will talk you through our results in more detail in a moment, but what I mean by this is that, for example, world GDP growth by the end of the century is expected to be about 70% lower than what would have otherwise been estimated prior to taking transition and physical climate risks into account.
Figure 6 illustrates, in more detail, what we mean by using a top-down approach that captures the systemic nature of climate risks, where physical and transition risks interact and all countries and sectors experience direct, as well as network, effects. Figure 6 illustrates the very detailed modelling in the Cambridge Econometrics E3ME model to capture the interactions between the economy and related carbon emissions, the climate system and detailed energy and technology innovation modules. A policy measure in Europe, for example, such as an increase in carbon prices, not only affects the energy mix throughout Europe but also world oil prices, as well as demand for US fossil fuel exports. In turn this affects royalties paid to the US government and consequent government expenditure to other sectors, and so forth.
Figure 1. Combining financial and climate scenario analysis.
Figure 2. Integrating climate risk into financial scenarios.
Figure 3. Integrating climate risk into financial scenarios.
Figure 4. Integrating climate risk into financial scenarios.
Figure 5. Integrating climate risk into financial scenarios.
Figure 6. How do systemic climate risk factors work through the model?
Figure 7. What would the world look like? Paris versus Failed Transition scenario sets.
Having provided this brief overview of our modelling methodology, I now introduce you to the three climate scenarios we analysed in our papers. See Figure 7.
We analysed two climate pathways that would be likely to bring the world onto a path that is in line with the Paris Agreement to limit average global warming below two degrees by the end of the century. Both pathways contain large transition impacts due to policy measures and technology drivers, as well as the locked-in physical risks the world is faced with, even when staying below two degrees. What distinguishes our Paris Disorderly transition from a Paris Orderly transition scenario is that, whilst the Orderly transition assumes everything happens rather smoothly, a Disorderly transition explores the disruptive effects on financial markets with re-pricing taking place suddenly in the year 2024, followed by a sentiment shock and stranded assets in 2025. Conversely, we explore a scenario where the world fails to transition to below two degrees and in turn experiences very severe physical impacts.
Finally, I would just like to give you a bit of an impression of what the world would look like under these three possible climate pathways. For example, as regards policy measures, the global carbon price is assumed to grow to around $60 per tonne of CO2 by the year 2030, and to above $700 per tonne of CO2 by 2050. As you can see, this affects the electricity generation technology mix. This differs significantly in a Transition scenario, which you see on the left of Figure 8, versus a Failed Transition. This is a global view but there are also large differences across countries.
Figure 8. What would the world look like? Paris versus Failed Transition scenario sets.
In terms of the increase in frequency of extreme weather events, you can also see that the total number of events by the end of the century will double in a Failed Transition compared to a Paris pathway. There is much more detail surrounding the narratives of these three climate scenarios analysed. Nick (Spencer) will now talk through the modelling results we present in our papers.
Mr N. S. Spencer, F.I.A.: With Lisa (Eichler) having provided you an overview of the model, we will cover some of the model’s outputs, which we detail more in our second paper. I will then hand over to Andrew (Claringbold), who will cover the application of these model outputs in the pension fund case study.
The key features to think about in regards to the output are the percentages of the median return versus the uninformed climate baseline and the impact attribution. This is important as presenting these results relative to the uninformed baseline enables us to focus on the impact of the climate pathways. There are clearly second and higher order effects, but looking at the relative returns means that the first order of the macro-economic and financial assumptions will drop out. For example, whether the modelling rate of GDP growth is 2% or 3%, looking at the relative returns removes the direct sensitivity to this assumption. In fact, within the model, and we provide some illustrations, the GDP is projected out to 2100. But in practice, in the Failed Transition scenario, nominal GDP starts turning negative in the 2060s and 2070s. Therefore we are unable to calibrate that to the financial markets, as we simply lack a history to know what has happened if we have a continual decline in nominal GDP. Those relationships are unstable. Hence, we terminate the financial modelling in 2060.
When we look at the actual underlying climate impacts, these are divided between Transition, gradual, physical and extreme weather. Within the financial markets, there is a pricing shock for when the longer-term impacts are priced in. For the Disorderly Transition, with the impact of a sudden transition, we have explicitly allowed for a financial sentiment shock.
Moving on to look at what the impacts are on the GDP, shown in Figure 10, we have examined the climate pathways by considering them to be centred relative to the uninformed baseline pathway. In the UK, the initial impacts on the GDP and the Paris pathways are fairly limited, with a positive stimulus in fact offsetting the physical impacts as well as decommissioning other intensive activities. In the longer term, those investments are repaid, but they are not sufficient to offset the increasing physical impacts, even within the Paris-aligned pathways. This leads to a small negative Transition impact of GDP in the longer term of around 10%. The impact in the UK regarding the Failed Transition is clearly more severe. Again, in the short run, it does not have much impact, but over the longer term the impact of the physical climate’s dampening impact on the economy accumulates. Over the years up to 2100, we see a drop of 60% of GDP relative to the baseline. This analysis is repeated across a number of the large economies which do not all show the same pattern. For example, in Canada, the closing of demand for tar sand, and other intensive fossil fuel extraction, leads to a significant drop of the GDP in the Paris-aligned scenarios – the blue line in the middle graph in Figure 10. However, in the middle of the century, there is a slight amelioration with the physical impact being a net positive. In Canada’s case, this slightly improves their overall economic growth. The net long-term impact for Paris-alinged pathways is around a 10% drop in GDP. In the Failed Transition, we do not see that initial drop. But even in Canada’s case, the long-term physical impact and that of the global economy is very negative leading to a drop of 40% of GDP to 2100.
Figure 9. What would the world look like? Paris versus Failed Transition scenario sets.
Figure 10. Climate impacts on GDP.
Looking at the global GDP impacts of different pathways summed across different countries, the net pattern is similar to that of the UK albeit slightly more severe. By 2100, the Paris orderly transition drops by 20% relative to baseline and the Failed transition drops by more than 70% relative to baseline.
We can move on to look at the attributions within the UK, which are illustrated in Figure 11. These are divided between the Transition (the cost of the Transition policies, the decommissioning of the fossil fuel production); the gradual physical risks; the extreme weather risks; and the sentiment shocks. From the graphs, which are presented here on the same scale, and within the paper, on different scales to illustrate the details. The relatively modest impact in regards to the Paris Orderly Transition is shown. You can clearly see also the sentiment impact that then oscillates before settling down within the Paris Disorderly, and the gradual, increasing and larger longer-term impacts within the Failed Transition.
Figure 11. Climate attribution: UK GDP.
Moving on to the financial impact, we present this across the various asset classes in the paper. Here, in Figure 12, we illustrate this for global equity. It can be seen that the Paris Orderly Transition results in a modest but material 15% drop in returns by 2060. For the Paris Disorderly Transition, we can clearly see the impact of the sentiment shock that occurs in 2025. There is a partial recovery, which means the sentiment shock leads to an overall 25% reduction in GDP. The largest impact, reflecting the large decline in GDP comes from the Failed Transition. You can see the two pricing-in effects of the longer-term physical risks within the period 2025 to 2030 and 2035 to 2040. This leads to almost a 50% reduction in equity returns relative to the baseline by 2060.
Figure 12. Climate impact on global equity returns.
Figure 13 illustrates the attributions to climate impacts within global equities to the different impacts with more details given in the paper.
Figure 13. Climate attribution: global equities.
Likewise, Figure 14 shows the impacts with regards to inflation and how they decline in both the Paris-aligned and the Failed Transition.
Figure 14. Climate impact on inflation.
Figure 15 shows the attributions and impacts on bond yields. This decline in sovereign bonds largely reflects the declines in GDP. See Figure 16.
Figure 15. Climate impact on bond yields.
In the paper we also illustrate the impact on bonds with higher credit spread which is more variable reflecting the creditworthiness of the underlying companies across the differing pathways.
Andrew (Claringbold) will now discuss the impacts within the case studies that we presented.
Mr A. W. Claringbold, F.I.A.: I am now going to take these pathways and apply them to a typical pension scheme, finishing off with “so what?”
So, moving onto the modelling of the scheme, the key features are that the scheme is around 75% funded against a low risk, long-term funding target, which is around 50% invested in growth assets and around 50% of the liabilities are hedged against gilt yield and inflation movements. More detail is included in our first paper. This investment strategy will remain unchanged for 10 years but will then gradually change to a strategy of 100% bonds and 100% liability hedging over the ensuing 10 years. Figure 17 shows how our client pathways would impact on the funding level over time. The model is a stochastic model and so we have shown 5th, 50th (median), and 95th percentiles. As you can see, the median funding levels reach 100% between 2030 and 2040, but there is a lot of uncertainty around this. I am going to focus on the median because it does bring out the key points. In practice, I would expect pension schemes to focus on more adverse outcomes than this.
Figure 16. Climate attribution: investment grade bonds.
Figure 17. Funding level projections: 5th, 50th and 95th percentile outcomes.
Moving on to a zoomed-in analysis of the median, Figure 18 shows the funding levels that would arise under the different climate pathways relative to the climate uninformed baseline. So, for example, the funding level under the Paris Disorderly Transition, which is the light blue line, ends up 20% lower than that under the baseline by 2040.
Figure 18. Funding level projections: median outcome relative to baseline.
There were three key conclusions I wanted to draw from this graph. The first is that the projected funding level, under all of our climate change pathways, is worse than under the climate uninformed baseline. They all lead to it taking three to 9 years longer to reach the long-term funding target. The baseline is consistent with the same levels of physical climate damage and fiscal shocks we have seen in the past, and makes no explicit allowance for an increase in fiscal risks, or a change to a low-carbon economy. We think this is what is largely priced into the market and climate change risks are not yet being fully captured. In terms of which of these pathways is the most damaging to pension schemes, for this pension scheme it is the Paris Disorderly, where the funding level is 20% lower than the baseline in 2040. This is probably fairly typical. What is not immediately obvious from the graph in Figure 18 is that the impact in this example is driven, mostly, by the investment returns up to 2030. From 2030 to 2040 the scheme is reducing risk so it is less exposed to climate change. This is why the Failed Transition does not look the worst, despite having the biggest impact on GDP long-term. However, we also considered this scenario in our paper where it does not reduce risk, and this may be the case if it is below target after 10 years. The two Paris pathways do not end up significantly different compared to the risk reducing strategy. However, the Failed Transition now does end up being the worst, with the funding level being 25% lower than the baseline after 20 years. As you can see, this will vary from scheme to scheme.
Now I want to make some comments about other risks. Whilst we believe these are excellent models, they do not capture all of the risks associated with climate change. They certainly do not represent extreme scenarios. For example, there are other plausible scenarios that could lead to even more adverse impacts. The Cambridge Institute for Sustainability Leadership has come up with scenarios where markets respond sooner and experience greater drops. My firm, Aon, also considers scenarios where nominal yields fall and the government is forced to take immediate actions, but with inflation still rising, so that the actuarial value of the liability has increased significantly. Also, in a more uncertain future, we may well get increased volatility. This is not captured in these models other than to a limited extent in the Paris Disorderly pathway, but as pension schemes mature this can matter, as schemes may end up for sellers and depressed markets.
Finally, the end game for many, if not most pension schemes, would be a buy-out with an insurance company. We have captured the climate change risks on bonds in this model, although even then we have probably understated them because we have assumed that the cashflows can be perfectly hedged. However, we have not considered what will happen to annuity pricing in these scenarios, in an environment where insurance companies may need to increase the reserve they set aside. These are all areas where we think that further research would be useful.
I now want to move on and consider the question “so what?” First, I would say that a lot of trustees are open to, or even keen to consider climate change issues. Increasingly, they are under pressure to do so. However, they are nervous because, over the years, it has been drilled into them that they should not take actions that may be financially detrimental to their members. They felt that taking a stance on issues such as climate change may be considered to be doing just that. However, I think this sort of analysis gives them the evidence and justification to do something. In fact, they may be more exposed, legally, if they do nothing.
So, having decided they want to do something, what can they do? The key action they can take is to consider their investment strategy and its implementation. There is a lot you can do in this space, which I am not going to discuss today. Also, I have not yet considered the employer. However, it is the employer that we are relying on for contributions and to underwrite the risk. But how exposed is the employer in the Paris Disorderly scenario, for example? Will it still be able to pay contributions? Can you try to engage with an employer and understand how resilient it is to different pathways? We are beginning to see covenant advisers considering environmental risks.
Finally, identifying the risks is the first step towards being able to manage and mitigate them. Then you get into the position where you know what you would like to do, should the risk start to materialise, and be able to act more quickly and more effectively. It is difficult to see beyond COVID-19 at the moment, but what COVID-19 does show is the impact that globally integrated events can have on economies and financial markets, and the importance of preparedness.
The Chair: Now we will move on to the questions. Here is the first question: does anybody win in a Failed Transition-Transition?
Ms. Jones: I guess it depends on the time horizon that you look at and that is one of the challenges that came out of the modelling. Over the short-term the Failed Transition, where we continue on a “business as usual” path for at least the next few years, may give the best outcomes. For example, for defined benefit pension schemes with a short-term horizon, the Failed Transition can appear to give quite good outcomes. But as we extend the time horizons and the physical risks kick in it is then hard to see anybody winning in a Failed Transition in the long term.
The Chair: Which I think brings us to one of the other questions, how credible are GDP growth predictions beyond, say, the next 5 years?
Ms. Eichler: Together with Cambridge Econometrics, we decided to model until 2060, as beyond that time horizon we have the potential for severe shocks to GDP of up to −70%. We decided not to quantify the financial impacts beyond 2060.
The Chair: Are the Cambridge Econometrics models that we have used bespoke? Were they particularly for this research purpose, or are they generally available models? Could an actuary obtain these models and, if so, do they get them from you or do they get them from Cambridge, or from some other source?
Ms. Eichler: The underlying E3E model that has been used for the past 30 plus years, especially for policy making in the UK and the European Union, is not bespoke. What is bespoke, of course, is how we combined the Cambridge Econometrics information with our own information on extreme weather events and the financial implications of these. I should say that these are also, of course, commercial versions so they are not free. However we are also collaborating in an open source climate platform, where we expect from next year on there will be various types of these climate scenarios, including the ones from Cambridge and ourselves.
The Chair: We have got some questions about the modelling. Does the macro-economic model include population impacts that include the possibility of defection from consensus? For example, if the US decided to increase its consumption of fossil fuels, taking advantage of lower fuel prices, how does the Paris Disorderly Transition compare to what we are currently experiencing under COVID? Have we had the Disorderly Transition already?
Dr Kramer: I will start with the last part, which is the Disorderly Transition. I would say no, we have not already seen this Transition happen. What we have seen in the last few months is that fossil fuel equities in particular performed more poorly than other equities. So in that case we might say that there is at least some part of the Transition priced in now, but definitely not all of it. And still a lot of it needs to happen, so I would expect another negative sentiment shock in a few years’ time when the full impact of the position will actually become clearer than it is now.
When you look at the scenarios that we generated, looking at population impacts and defection from consensus based on the Cambridge Econometrics analysis, we get information on what needs to happen to remain below two degrees. That is from a global level, so all countries need to put effort into this process. So I don’t think we explicitly take into account that some countries might profit from this. What we do, together with our clients, is to also construct all kinds of alternative scenarios where we do include these kinds of questions. These are the more bespoke alternative scenarios where we combine different views.
The Chair: Did the modelling produce any surprising results? Or were they broadly what you had in mind before you started?
Mr Spencer: The surprising results for me started this paper and process. It was seeing some of the outputs from the model and their implications in last year’s London Climate Action Week that prompted me to join with this group and Ortec Finance in producing the papers. Having seen some of these long-term implications, the results did not surprise me in that regard, nor in terms of the outputs. What I have been impressed with and really appreciated, if you look at the attributions, is how much detail there is underlying the modelling and how this really considered the long-term physical impacts. This has not been a part of our traditional way of (actuarial) modelling and was a new feature. I think that the changes and impacts of that are very material. So, yes and no, if you like, is the answer.
The Chair: Does a growth asset have any meaning in this context?
Dr Kramer: The concept of a growth asset is a bit misleading when you end up in a Failed Transition, of course, where GDP ultimately might decrease. So in that case “growth asset” is not the appropriate term, when you talk about equities, for instance. But you can say it is a risky asset.
The Chair: So, let us think a bit more about what all of this means for actuaries. In putting together this working group we were specifically looking at pensions. Somebody has asked whether general insurance was part of the scope of our work and the answer is “no”. They then go on to ask whether there are other applications where this research is being used or can be used in the general insurance world. Lisa (Eichler), is Ortec Finance specifically using this modelling technique with pensions, or do you use it with other insurance type applications as well?
Ms Eichler: I would say we are using it across the board for pensions, but also insurance companies and asset managers are using these climate scenarios.
The Chair: But that is essentially on the asset side, so not necessarily on insurance risk exposure, for example?
Dr Kramer: There is an impact of climate change on life expectancy and on mortality rates and so it is relevant to both insurance companies and pension funds. What we see is that cold-related mortality will decrease and heat-related mortality will increase. Which means that countries where heat-related mortality is already dominant will probably see increased mortality rates even in the short term. In countries where cold-related mortality is dominant you will see that, let’s say, for the first few decades or so, it might actually be the case that mortality will go down because cold-related mortality will go down faster than heat-related mortality will go up. On the P and C side, we also worked with a number of insurance companies to look at the impact of extreme weather events on the liability side.
Ms. Jones: One of our working party’s earlier papers looked at the impacts of climate change on mortality. Other people’s research has looked in quite a bit of detail at the impact on cold and heat-related deaths, but one of our conclusions was that there will be other impacts on mortality. In particular, if we are in climate scenarios where GDP is affected, and so there is less money available for spending on healthcare and so on, that actually could have quite a significant impact on longevity and potentially outweigh the impacts of the temperature changes over the next decade or two. That is something that the working party has thought about, but it is not included in the modelling we are discussing today.
The Chair: We were specifically looking at Defined Benefit (DB) pensions in our work in these two papers. How relevant do you think this is for Defined Contributions (DC) pensions and how should actuaries working in DC be including climate scenario modelling in the design of the plans, especially given the longer time horizon for DC?
Mr Spencer: When we think about DC, if you look through the paper, the larger impacts are unsurprisingly on the more volatile assets – equity and return-seeking assets. And, obviously, in a DC you would have more of those. So understanding these impacts, when you think about the scheme design and the long-term potential returns, is important. But, I think it is important to think through the implications in two further ways. One is to think through the implications from an investment perspective. We comment briefly on some of the sector impacts in the paper, but considering the ways in which those risks can be managed and mitigated over the longer term becomes more important. And from a DC perspective there is also the point about the interest of the members. Mike Clark in the Q and A has referred to “Make My Money Matter”, which is a campaign that’s expected to launch in the second half of this year, to talk about member interests in climate impact. Actuaries should be thinking about where members wish their money to be invested, as well as this financial impact.
The Chair: Does the panel believe that actuaries should adopt new standards in how they use and present long-term asset returns? This will affect not only pension actuaries but also life actuaries. Do the professional standards need to be adjusted to cope with this?
I developed the professional standards some years ago and I have to admit that my familiarity with the details of the pensions and insurance standards is less than it was when we originally prepared them. My feeling is that the technical actuarial standards and the professional standards that the IFoA produce try to be very principle based and outcomes-focused, and do not go into great detail. So, in theory, I do not think we should need any major changes because it is becoming more and more obvious to more and more people that these climate risks are significant, and that they are material. So, it should be difficult if not impossible for actuaries to ignore them in their work. What I do think is that there should be more support for actuaries doing these new types of analyses in their work, helping them to work out what the best ways of doing the analysis are and what the most useful ways of thinking about them are. I expect that this will be a rapidly changing area where good practice emerges as people do more and more of it.
Mr Claringbold: I agree. As you say, the standards are principles-based. They talk about material risks and we should be addressing them. The difficulty is that there always seems to be something more short-term and immediate. Currently we have COVID-19. Before that we had Brexit and we might well come back to Brexit again. The difficulty is getting the recognition of climate change, and other long-term general social and governance issues, moved up the agenda.
The Chair: I do think that it is something that we all need to be aware of, as actuaries, is that the landscape is not necessarily the same as it was when we trained. When I trained as an actuary, which was more than 30 years ago now, climate risk was not on the horizon and, yet, to my mind, it is a major risk that actuaries and risk professionals should be thinking about now.
Mr Claringbold: It would be interesting to see what lessons we learn from COVID-19. There is a lot of focus on COVID-19 at the moment, quite rightly, and climate change is not high up on most trustees’ agendas. But COVID-19 does show what big impacts global events can have on markets. And how well people are prepared to deal with global events can make a big difference to the outcomes. So I do see that there are a lot of lessons that can be learned from that, and hopefully there can be a lot more focus on this in a year’s time.
The Chair: Let’s think about the modelling a bit. To what extent does the model allow for markets adapting to price future climate impacts into the assets?
Dr Kramer: We do assume, of course, that different financial markets are interconnected so that, for instance, stock markets, corporate bond markets and real estate markets essentially start pricing in at the same time. So, we see similar behaviour and we assume similar behaviour in those markets in the coming years. Hence, when in the stock markets price corrections are materialising, we assume that this also impacts spread levels in corporate bond markets. When stock markets go down, corporate bond market spreads go up. We also assume that when stock markets come to realise the future impact of climate change and the Transition, this will also impact real estate markets; in the sense that physical exposure will impact future income in real estate investments but also lower economic growth will impact future market rents, for instance, and this will also be priced into real estate markets.
The Chair: Is there an element of climate risk already factored into market assumptions?
Dr Kramer: Yes. We assume that, of course, current transition policies are already priced in, but for instance the IMF states that markets are pricing in increasing physical risks far too little. So there is still a lot of future climate impact that needs to be priced in.
Mr Spencer: Not only is it a question of what is priced in, which is modest if you look at the different impacts, but you will see how the different pathways produce quite different returns. Actuaries need to think about those different pathways irrespective of their view of what is priced in. So, they may think that one path is already priced in the market, but actually I think the other thing this analysis does is show that the market can’t possibly price for each of those pathways happening. Furthermore, as we explain in the paper, these are not the most extreme scenarios, they are merely meant to be representative. They are not stress cases. And so, when we think about risk, we should be thinking about the potential to go down, and beyond, any one of these different pathways.
The Chair: Would a larger holding in ESG assets change the results under the three scenarios? Have we actually seen any benefit over the COVID crisis? Do the ESG assets do any better?
Mr Spencer: In brief, yes, particularly the oil sensitive assets. The interesting part of the COVID crisis is obviously how things like travel have been impacted. Although the net results from the ESG indices might look quite modest, the impact on specific industries has been large. There are also measurement issues when we come to ESG, and the ESG and a climate transition are not in direct alignment. But, I think to interpret the question more abstractly, you are saying that if you had a strong Paris-aligned transition, or what the PRI refer to as an inevitable policy response that mitigated those risks, then almost certainly you would have done better in the first quarter, as the COVID impacts came through. So there are definitely parallels within this in terms of both the oil pricing and the use of fossil fuels and economic activity that is dependent on travel.
Ms Jones: Perhaps if I can just respond on the question of how we might factor the different ESG characteristics of portfolios into the modelling. That is something that is not readily incorporated into the framework we have because the modelling is top-down and so it just makes the same assumption about equity performance regardless of precisely which companies the assets are invested in. So the alternative approach is the bottom-up one that I mentioned during my part of the presentation, where you are looking at the impact of climate scenarios on individual assets within the portfolio and aggregating upwards. That is a complementary approach, which is the best way of looking at how different ESG funds might enable you to mitigate your climate risk exposure.
The Chair: What about sponsor covenant? Obviously we did not model sponsor covenant directly in our work, but how might sponsor covenant interact with this modelling? Are there points in the modelling where the impact to GDP is so severe that many sponsor covenants fail and people do not receive their pensions at all?
Dr Kramer: Of course, it would depend on the sector that a specific sponsor is operating in, I would say. When we succeed in Transitioning to a low-carbon economy, of course, sponsors in the fossil fuel and the brown utilities sectors will lose a lot of production, and their current output levels and profitability will fall. Other sectors will, of course, be more resilient in a Transition pathway.
Mr Claringbold: I think one of the advances of these scenarios is that they do provide descriptions. This means that you can actually read, for example, in the “Paris Disorderly” Transition, the description scenario and say how, exactly, my sponsor is going to behave in that scenario.
The Chair: We will finish off by going around all the speakers to ask if there is anything they would particularly like people to take away from this work, and also to ask whether they have a view as to how we can work to integrate some of this type of thinking into the everyday thinking of actuaries.
Mr Claringbold: The main thing I would say is do not assume that trustees are not interested. What I mean is, it should not be the actuaries or the consultants who are the ones not raising it. A lot of trustees are not interested when you take it to them, but a lot are. So what I would say is to make sure you are taking it to them with solutions as well. You do not just want to give them problems. We should not be the ones creating barriers to looking at it.
Dr Kramer: I think awareness is ultimately the most important thing. No one wins in the long-run in a Failed Transition pathway. Actuaries and society as a whole should do their utmost to ensure that the Transition succeeds.
Ms Eichler: Speaking more from the climate science side, I think what is very important is increasing awareness and there are many tools coming out to help integrate this into everyday investment decision-making. I would encourage everyone not to let the unknowns stop you from acting now because, from the climate science point of view, it is the next 5 to 10 years where the world can still go on the different paths. That time is ticking by quickly and at some point we will be locked into the Failed Transition and then there will be no more choice.
Ms. Jones: I would just like to finish by picking up on one of the questions that came through that we have not specifically addressed, which is how we might see the adoption of climate scenario analysis pan out. I mentioned that the Bank of England was encouraging insurers to look at climate risks and its work on the biennial exploratory scenarios will surely encourage the adoption of climate scenario analysis within the insurance sector. Then, within the pensions sector, we have got some draft guidance out for consultation at the moment from PCRIG, the Pensions Climate Risk Industry Group, that recommends that all defined benefit pension schemes and defined contribution pension schemes in the UK undertake climate scenario analysis. There is also an amendment to the Pension Scheme Bill currently before Parliament that will make climate scenario analysis mandatory, we expect, for large UK pension schemes. So, I think, that regulatory shift will encourage actuaries to place much greater emphasis on climate scenario analysis within the next year or two, and we should be on the front foot with that.
Mr Spencer: I just want to pause for a minute and reflect on the Failed Transition, which projects a 70% drop in GDP, a 50% drop relative to baseline by 2060 in equities, and that clearly needs significant thought in terms of actuaries in their own work. As actuaries, the question we should be asking is “what does this mean for the financial system”? How does this impact on solvency and the work that we do? How should we relay this to regulators and the policy-makers? We should be bringing forward the financial imperative to address a Failed Transition, and we should be really thinking about the ways that we can actually help the financial markets to start acting against that, rather than what is actually projected in terms of the financial markets, if it were to happen.
The Chair: I would encourage everybody here to think about what they have seen today, to read our papers, and to think about what they should be doing, both to help their clients and employers, and also to think about some of the implications and emphasise that this is a major threat to society and how we operate. What is the world going to look like in 40 or 50 years’ time? We can’t just sit here and say, actually, it will all be all right, nothing will change really, because in reality things will change a lot and we need to think about how we want them to change.
Additional questions from webinar
Has there been any modelling on how these scenarios may impact on life expectancy as well? I presume there may be some offset for pension schemes from financial impacts?
In the current case study, we did not take this into account. But this topic has been researched. In the Paris Pathways, life expectancy is expected to increase in the UK as the expected decrease in cold-related mortality is larger than the expected increase in heat-related mortality. In a Failed Transition pathway, in the coming decades life expectancy will still increase, but this trend will probably stop by the end of this century as heat-related mortality will dominate cold-related mortality by that time. See for instance: A. Vicedo-Cabrera, F. Sera and A. Gasparrini (2019). Hands-on tutorial on a modelling framework for projections of climate change impacts on health. Epidemiology, 30 (3), 321-329.
An IFoA working party published a paper on environmental impacts on mortality in 2018. The paper focuses on air pollution and temperature-related deaths, since this has been the focus of most of the quantitative research into environmental impacts on mortality. However, other environmental impacts may be more significant. In particular, they could have macro-economic effects such as lower economic growth and higher food prices, resulting in lower healthcare spending and poorer nutrition. These have the potential to far outweigh the impacts of better air quality and milder winters, and could work in the opposite direction.
Did the modelling produce any surprising results or broadly were they what you were intuitively thinking?
We answered this within the webinar. But to add a couple of further observations, the overall outcome is not surprising if you compare with some of the physical risk predictions for a 4 degree warmer world. It is broadly consistent with statements such as that of Thomas Buberl, the CEO of AXA, who commented that a “4 degree warmer world is uninsurable”. Those interested may also be interested in the underlying climate science. Nick Spencer referenced these long-term projections when opening the IFoA Sessional meeting in November 2018. His remarks can be summarised as:
“ALLIGATORS basking off the English coast; a vast Brazilian desert; the mythical lost cities of Saigon, New Orleans, Venice and Mumbai; and 90 per cent of humanity vanished. Welcome to the world warmed by 4 °C.”
So started, a 2009 New Scientist article based on the then latest Science from a Met Office conference.
Why quote this article?
Well, 4 degrees is often used in scenario projections and it is the current trajectory suggested by many sources including the US government. And yet, I quote 2009 article as most sources that I can find come from that 2009 conference & a follow on in 2011 albeit that the science since then has generally suggested larger not smaller impacts
Understanding the implied real-world impacts is important for scenario modelling. Otherwise there is a potential disconnect if economic influences are merely extrapolated. I encourage all actuaries to look into the climate science to get a broad sense of the implied reality. What is implied by, say, peak carbon emissions in 2020 or by projecting a 4 degree warming?
4 degrees warmer is more than the Pliocene, three million years ago when the northern hemisphere was free of glaciers and sea levels were 25 metres higher. The 2009 science based predictions for a 4 degree warmer world include:
Summers in the south of England regularly reach 45C, akin to today’s Marrakesh. Desertification of Europe south of the Alps, making South of France, Spain, & Italy as uninhabitable as the Sahara is today.
Uninhabitable desertification also applies to the Middle East, whole South of US, and almost all of Africa
85% of the Amazon forest is lost. Ocean acidification leads to a collapse in fishing stocks
Sea levels: conservative estimates have 2 m rises in the next century with long-run estimates from 9 m to 40 m or more
and I haven’t even touched on the impact for agriculture which is likely to be significant even at 1.5 or 2 degrees of warming.
Now, I’m not a climate scientist, and can’t vouch for this work. These predictions not come to pass or may reflect worlds at 5, 6, 7 or 8 degrees of warming. But I am struck by the disconnect between some economic modelling and the impact on civilisation that even more modest versions of these projections suggest.
As a profession, actuaries should become better aware of these potential physical impacts to ensure realism in our projections and to better highlight the transition imperative of an inevitable policy response.
The work in the Long-term Impacts paper presented in this webinar provides a more quantitative basis to these high-level remarks.
It would be most useful to see sensitivity analysis on these scenarios, especially if the outputs didn’t actually tell us anything new, for example, a different baseline scenario which isn’t so rosy, different asset strategies, etc. What are the future plans of the working party?
In the working papers, we also discuss the results when the pension fund does not change its investment strategy. Alternative asset strategies can easily be analysed using Ortec’s model, but this is not something that is currently scheduled by the working party. With respect to alternative baseline scenarios: of course the current COVID pandemic also impacts the baseline. Future expected returns will be negatively impacted for the coming years in all pathways. But we do not expect that the relative differences between the baseline and the climate pathways will be impacted significantly. So, the conclusions will be similar, but more negative overall.
Have you explored the impact of error propagation in the models, considering the uncertainty (parameter, model, etc.) associated with each stage of the modelling?
The stochastic scenario model used to model the baseline does take into account parameter uncertainty, so this is incorporated in the scenario set. We did not explicitly consider uncertainty in the climate impact modelling within our two papers. However, the model can be used to construct and analyse alternative bespoke climate pathways to analyse the impact of different climate modelling choices and assumptions. Ortec Finance can undertake this work with their clients.
The slide showing asset growth median and tails under each scenario seems to suggest that the variation arising from climate change is massively dominated by the variation arising from macro-economic noise. Given this, are actuaries justified in incorporating climate change into their analysis?
It is true that the uncertainty/bandwidth in the returns projections in the climate-uninformed baseline is already substantial, and that the median impacts under the climate pathways modelled are well within these probability bands. However, these climate pathway impacts can still substantially impact expected returns, and therefore the achievability of a scheme’s funding plans. Moreover, as explained in the papers, the scenarios considered are not intended to be extreme and the modelling is likely to have a bias towards optimism. Therefore, in the authors’ opinion, actuaries should definitely incorporate climate change into their analysis.
Was a general insurance angle part of the scope of the research papers? Aside from the use of climate change models – in parametric trigger general insurance products – are there other applications where this research is being used/can be used in the GI world?
The general insurance angle was not explicitly part of the scope, although the results are relevant, particularly for longer-term modelling. This type of modelling is used by other institutional investors across the globe, like insurance companies, sovereign wealth funds and banks.
Is it, or will it be, the professional duty of IFoA-member advisers to present analysis like this to trustees?
Draft guidance from the Pensions Climate Risk Industry Group sets an expectation that all UK pension scheme trustees will conduct quantitative scenario analysis. The Pension Schemes Bill currently before Parliament is expected to make TCFD reporting, which includes climate scenario analysis, a legal requirement for large schemes. Hence, we expect climate scenario analysis to become a standard part of trustee funding/investment advice within the next few years, although some trustees might focus on bottom-up analysis rather than top-down analysis like ours. Regardless of regulatory/legislative developments, we expect actuaries to support trustees in meeting their fiduciary duty to understand and manage the risks to their pension scheme; and believe that analysis like ours is a useful tool for doing that in relation to climate-related risks.
How reliable are the assumptions under the climate modelling?
The modelling results for impacts on economic and financial indicators clearly depend on a large body of analysis that links economic activity to global warming via GHG emissions, and global warming to economic activity via gradual and extreme physical impacts. The relationship between cumulative net GHG emissions and global warming has been extensively studied by the scientific community and summaries of the evidence are reported, for example, in the IPCC assessment reports. While predictions are always subject to uncertainty, the consensus is currently strong. The relationship between global warming and impacts on economic activity is much more uncertain, as can be seen in the debate following the 2006 Stern Review, a review that pioneered estimates of economic impact. Some economists, notably in the US, have produced modest estimates of GDP impact even from warming of 3°C or more, but these estimates are contested and make no allowance for the potential acceleration of change that could occur if tipping points are crossed. The uncertainty is compounded by the fact that historically-observed differences in economic prosperity across time and location are consistent with various functional forms, some of which imply much stronger GDP impacts than others. Also, the data on these existing differences do not reflect what could happen in a world in which there is much more energy stored in the global geophysical system.
Could you give us an indication of how we expect climate change to affect valuation of Direct Investments/Real Estate assets?
Commercial real estate is driven by the same factors as equities: economic growth expectations, inflation and interest rates. Economic growth drives market rents and the probability of vacancies. If expected economic growth is lower this decreases expected future rental income, just like it impacts expected earnings and dividends for listed equity. Therefore, when a pricing-in shock materialises on the stock market, this will also impact real estate markets. Furthermore, real estate markets are directly impacted by extreme weather events via direct damage to properties. See Appendix F of the Long-term Impacts paper for more details.
Have you been able to use any historical data to calibrate the responses of the macro-economic variables to the climate change scenarios, or is it mainly judgement and trying to think through all the linked impacts of climate changes?
For the responses of macro-economic variables to global warming, see the earlier answer to “How reliable are the assumptions under the climate modelling?” In short, the estimates of physical impacts draw on literature that estimates the relationship of macro-economic outcomes to temperature differences from historical data, but such estimates have a wide range of uncertainty. For the response of macro-economic variables to transition policies, the modelling that drives these results depends on (1) estimates based on historical data for the response of energy use to changes in economic activity and prices; (2) models of take-up of new technologies that are fitted to early take-up data but that are necessarily subject to greater uncertainty (e.g. we do not have much data on take-up of electric vehicles beyond the “innovators” and “early adopters” groups); and (3) estimates of future reductions in the cost of clean technologies in response to larger market take-up, based on past experience and opinion from technology experts (also subject to great uncertainty, as evidenced by the underestimation of the dramatic fall in solar PV costs over the past 15 years).
Why does the graph on slide 27 not mirror the graph on side 26? 26 shows funding level currently of 75% trending upwards, but 27 shows all scenarios starting at 100% trending downwards?
Slide 26 shows funding ratio levels, whereas slide 27 shows ratios (median funding ratio climate pathway/median funding ratio baseline). For all three climate-informed pathways, even though the median funding ratio increases, it does not keep up with the baseline median funding ratio development.
How were the financial shocks modelled?
In short, current equity valuations have not yet (fully) priced in the impact of a change in expected future economic growth caused by climate change. We apply a standard corporate finance pricing model to translate changes in expected future growth at country–sector level (from the E3ME model) into regional and global equity market shocks. More detail is given in the paper.
What can we as actuaries do to increase the credibility of the scenarios? This would naturally lead to the increased awareness of the decision-makers.
The authors think the climate pathways are credible and consistent with IPCC projections. Therefore the question is how do we raise awareness with decision-makers? We believe that this is very important. A first step for actuaries is to take the work of economists and long-term climate projections and help translate them into economic and financial terms. This shows that we either find the transition investment now, or we won’t be able to pay later (with ever greater impacts caused by passing through “one-way doors” of irreversible damage.) The second responsibility of actuaries is to bring these facts, these risks, to the attention of regulators and policy-makers, which is clearly acting in the public interest.
To what extent does the model allow for markets adapting to price in the future climate impacts into assets?
It makes allowance for all listed assets and real estate. The paper provides details.
How does sponsor covenant interact with this modelling i.e. are there points in the modelling where impact to GDP is so severe that many sponsor covenants fail and people don’t receive their pensions at all?
The implications of climate risk for sponsor covenant can be considered as an overlay to the modelling. Figure 9 in the second paper (“Climate scenario analysis: an illustration of potential long-term economic & financial market impacts”) shows how average equity returns might vary by sector under the three scenarios considered and this could provide a starting point for such analysis, combined with knowledge of how the sponsor’s climate risk exposure and climate risk management differs from the industry average.
The probability of sponsor insolvency may be higher under some scenarios than in the baseline case, particularly where GDP is significantly lower. We note that, for the scenarios modelled, the most severe economic impacts occur under the Failed Transition pathway over the longer term. Over time, the proportion of defined benefits expected to be provided by insurers is expected to increase and so the solvency of insurers will become increasingly important to the question of members’ benefit security.
On the “so what” question – did you test the outcomes using e.g. different investment strategies and how much difference did it make? Can the trustees do anything that would actually make a difference?!
Our case study paper illustrates the impact of maintaining the same asset allocation throughout i.e. not reducing investment risk from 2030 onwards. We did not test other investment strategies in detail, but in the paper we comment in high-level terms on the impact of differing high/low risk asset allocations and the sensitivity of the results of the timing of switches out of high risk assets relative to market pricing shocks. The modelling suggests that reducing the allocation to higher risk assets such as equities will, on average, reduce the scheme’s climate risk exposure. In practice, we would expect trustees to first look at the extent of their climate risk exposure within asset classes and seek to reduce it, for example by switching into a low-carbon equity fund or amending segregated mandates to require decarbonisation over time.
With Covid we are contemplating entrenched negative interest rates and/or inflation. Given the major climate impacts, ageing populations and pressure on resources, how far do these factors come into the analysis?
The impact on interest rates and inflation of ageing populations, climate change and pressure on resources are explicitly taken into account. However, as the analysis is based on the December 2019 situation, the analysis does not reflect the impact of COVID.
How would a larger holding in ESG assets change the results under the 3 scenarios in the case study?
In a Paris transition pathway, when your portfolio is tilted towards low-carbon electricity and underweighted in fossil fuel sectors, this improves returns. As the modelling is top-down, it is not able to reflect granular differences in the ESG characteristics of assets. Instead, it can be complemented by bottom-up modelling that explores the extent of climate risk exposure within asset classes.
Is there an element of climate risk already factored into market assumptions?
In our modelling, we assume that only current climate policies and current levels of physical risks and extreme weather event impacts are already priced in. Hence, we assume that equity markets are ignoring the increasing number of natural disasters.
Much pension-related work centres on DB plans. It was good to see some mention of DC in the UK consultation on TCFD but I’m interested in views on how actuaries in DC should be including climate scenario modelling in design of DC plans (investment, benefits etc), especially given a longer time horizon for DC?
The modelling can be applied to DC assets in the same way as for DB. Given the longer time horizons and higher allocation to growth assets, DC schemes will typically have a higher exposure to climate risks than DB schemes. Top-down modelling like that in our paper can help DC trustees to explore the impact of climate change on different investment pathways. Bottom-up modelling (which is currently mainly available for equity and corporate bond portfolios) can then help trustees to select less exposed investment funds to use within those pathways.
Population impacts are going to be really important for pension schemes and life insurance companies, so this is a key component to be missing from the analysis. Is there any plan to try to introduce these? Either by the working party or other groups?
This remains very much at the frontier of research, as robust estimates of the drivers of migration or climate change-related mortality have yet to be established. A large number of drivers are at work and the data are complicated by population movements in response to war or natural disaster that are followed to some extent by people returning to the affected areas when conditions improve. While it would be possible to include formal migration equations based entirely on assumptions and thereby “solve” the problem, we think it would be misleading to do so if such equations have little or no empirical support. In addition, while the IFoA and International Actuarial Association have done significant research on the potential impacts of mortality changes induced by climate change, further research around the temperature/mortality relationship is necessary. Currently, therefore, the way to approach this would be to construct a small number of scenarios for population impacts, with alternative assumptions for scale of response. The working party does not currently have plans to carry out further research in this area.
Do you have a view as to how we can work to integrate this into the everyday thinking of DB pensions – i.e. to maximise the adoption and implementation ASAP – or do you think this will be a gradual adoption?
As mentioned previously, we expect climate scenario analysis to become a standard part of DB pensions advice during the next few years due to legislative and regulatory requirements. This will entail a steep learning curve for actuaries, particularly if their firm is not already developing its climate scenario analysis capabilities, so they should start building their knowledge and skills in this area now. The IFoA is supporting this process through a number of webinars in Summer 2020.
Most integrated climate economy models have their GDP growing over time, which is counter-intuitive assuming climate will have a negative impact on our economy.
There are a range of views on how sensitive macro-economic variables are to global warming (see the earlier answer to “How reliable are the assumptions under the climate modelling?”). Cambridge Econometrics thinks that the arguments against modest estimates carry weight and therefore it adopts higher estimates from the literature. This approach is also consistent with the IPCC view on the urgency of the need to address climate change, which implies more severe impacts from global warming than many Integrated Assessment Models predict.
Are the standard FCA projection rates (2%, 5%, 8%) still relevant? Is it realistic to expect returns as high as 5%?
We do not wish to comment in detail, but note that our projections illustrate why all analysis based purely on historic trends needs to be reconsidered in light of climate impacts that will be different from those implied by historic data.
How do you quantitatively consider interaction (correlation/dependency) between asset classes evolving over time due to climate change?
The stochastic scenario model used explicitly takes into account interactions between asset classes in the baseline. Furthermore, in translating the pricing-in shocks in the different pathways, we explicitly take into account interactions between equity, corporate bond, and real estate markets (for example, when stock markets go down, spreads tend to go up).