


INTRODUCTION
Coastal barriers, in the form of continuous spits or chains of island barriers, are the essential depositional elements of wave-dominated coasts (Roy et al., Reference Roy, Cowell, Ferland, Thom, Carter and Woodroffe1997). These features are elongated sandy or gravelly deposits parallel to the shoreline that isolate lagoon environments on the back barrier and encompass different depositional environments in at least six major elements (Oertel, Reference Oertel1985): mainland, back-barrier lagoon, inlets with associated channels and deltas, subaqueous barrier platform, subaerial barrier, and shoreface. These features develop mainly on trailing-edge (passive) continental margins with adequate tidal regime and sediment supply (Oertel, Reference Oertel1985; Davis, Reference Davis and Davis1994; Reading and Collinson, Reference Reading, Collinson and Reading1996). On short timescales, the morphodynamics of coastal barriers is controlled by fair-weather and storm waves, wave-generated longshore currents, and tidal currents (Davis, Reference Davis and Davis1994), but being low-altitude deposits formed of unconsolidated sediments, the barriers are particularly vulnerable to erosion and reworking driven by relative sea-level rise on longer timescales (Moore and Murray, Reference Moore and Murray2018).
The eastern coast of South America is developed on the trailing-edge margin formed after the opening of the Atlantic Ocean in the Late Cretaceous. Several marginal sedimentary basins developed along the Brazilian coast through accumulation of terrigenous sediments transported to the coast by fluvial systems from the Late Cretaceous onward (Martins and Coutinho, Reference Martins and Coutinho1981; Asmus and Baisch, Reference Asmus and Baisch1983). During the Quaternary, the uppermost portions of the basins were subject to eustatic oscillations driven by glacial–interglacial cycles that episodically exposed and drowned large portions of the continental shelf.
Several geologic features along the Brazilian continental margin record the effects of Quaternary sea-level oscillations (Martin et al., Reference Martin, Bittencourt and Vilas-Boas1982, Reference Martin, Dominguez and Bittencourt2003; Angulo et al., Reference Angulo, Lessa and Souza2006; Dillenburg and Hesp, Reference Dillenburg and Hesp2009; Suguio et al., Reference Suguio, Bezerra and Barreto2011). On the southernmost Brazilian coast (Fig. 1A), such features include large parallel barrier-lagoon depositional systems that comprise most of the Coastal Plain of the state of Rio Grande do Sul (CPRS), formed from sediments of the uppermost marginal Pelotas Basin reworked by middle–late Pleistocene glacioeustatic oscillations (Villwock et al., Reference Villwock, Tomazelli, Loss, Dehnhardt, Horn, Bachi, Dehnhardt and Rabassa1986; Villwock and Tomazelli, Reference Villwock and Tomazelli1995).

Figure 1. (A) Blue Marble image of South America showing the location of Rio Grande do Sul (white square). (B) Map of the southernmost Brazilian and northern Uruguayan coasts with the Pelotas Basin highlighted in yellow (LC, La Coronilla; inlets mentioned in the text are: CC, Chuy Creek; PL, Patos Lagoon; TL, Tramandaí Lagoon; MR, Mampituba River). (C) Depositional systems of the southern sector of the Coastal Plain of the state of Rio Grande do Sul (CPRS) (modified from Villwock and Tomazelli [1995] and Rosa [2012]). (D) West-east transect of the depositional systems in the southern CPRS.
The barrier–lagoon depositional systems of the CPRS are the largest units of this type on the Brazilian coast. In the southern CPRS, two Pleistocene systems and one Holocene system are preserved, stretching for some 230 km (Fig. 1B). The Holocene Barrier-Lagoon System IV comprises the modern coastline and associated depositional environments (Dillenburg et al., Reference Dillenburg, Barboza, Tomazelli, Hesp, Clerot, Zouain, Dillenburg and Hesp2009). Although several studies have described the structure and stratigraphy of System IV (Lima et al., Reference Lima, Dillenburg, Medeanic, Barboza, Rosa, Tomazelli, Dehnhardt and Caron2013; Caron, Reference Caron2014; Dillenburg et al., Reference Dillenburg, Barboza, Rosa, Caron and Bitencourt2020a), the Pleistocene units are poorly known in comparison, mainly because their only surface expression is usually the subaerial (aeolian) facies, which covers most of the barrier–beach complex.
This paper presents a study of the stratigraphy and evolution of the Pleistocene Barrier III in the southern CPRS, based mostly on sedimentological and chronological data obtained from marine and lagoon deposits. Barrier III is the most complete Pleistocene unit of the CPRS, correlated to the last interglacial stage (LIG) marine transgression (Villwock and Tomazelli, Reference Villwock and Tomazelli1995), well represented by different coastal deposits worldwide. Being the closest interglacial to the present, and characterized by temperatures about 1–2°C higher than today in both marine and terrestrial records, it is the best analog to evaluate oceanographic responses to a warmer climate; thus it can be used to assess future effects of ongoing climate change on sea levels and, consequently, on coastal environments (Rohling et al., Reference Rohling, Grant, Hembleen, Siddall, Hoogakker, Bolshaw and Kucera2008; Kopp et al., Reference Kopp, Simons, Mitrovica, Maloof and Oppenheimer2009; Hearty and Tormey, Reference Hearty and Tormey2017; Nascimento et al., Reference Nascimento, Shimizu, Venencio, Chiessi, Kuhnert, Johnstone and Govin2022). Understanding the development, evolution, and response of the Pleistocene barriers to climate-driven sea-level oscillations can help predict the future behavior of the Holocene barrier as a result of the projected sea-level rise in the next century (Sweet et al., Reference Sweet, Kopp, Weaver, Obeysekera, Horton, Thieler and Zervas2017; Moore and Murray, Reference Moore and Murray2018).
Geologic setting
The marginal Pelotas Basin (Fig. 1B) reaches up to 10 km in thickness and is bounded to the north (state of Santa Catarina) and to the south (Cape Polonio, Uruguay) by Precambrian rocks outcropping at the shore (Barboza et al., Reference Barboza, Rosa and Ayup-Zouain2008, Reference Barboza, Dillenburg, Rosa, Caron, Lopes, Watanabe, Tomazelli, Jelinek and Sommer2021a). The sedimentary infilling of the basin accumulated between the Cretaceous and the Holocene (Closs, Reference Closs1970), and most of its subaerially exposed portion comprises the CPRS (Fig. 1B), a ~620-km-long, up to 100-km-wide geomorphological unit composed of two major units: the Miocene–Pliocene Alluvial Fans System and four Quaternary Barrier-Lagoon Systems (Closs, Reference Closs1970; Villwock et al., Reference Villwock, Tomazelli, Loss, Dehnhardt, Horn, Bachi, Dehnhardt and Rabassa1986; Villwock and Tomazelli, Reference Villwock and Tomazelli1995).
Several characteristics of the CPRS, including its great width (>100 km), the absence of rocky features, the shallow slope of the continental shelf (0.03° to 0.08°), abundance of fine-grained siliciclastic sand, and microtidal (amplitude of <0.5 m) regime (Dillenburg and Hesp, Reference Dillenburg and Hesp2009; Dillenburg and Barboza, Reference Dillenburg, Barboza, Martini and Wanless2014), provided the conditions for the establishment of large barrier-lagoon depositional systems, recognized by sedimentary facies grouped into associations and correlated within a chronostratigraphic framework (Fisher and McGowen, Reference Fisher and McGowen1967; Tomazelli and Villwock, Reference Tomazelli and Villwock2005). These systems are the geomorphological expression of middle–late Pleistocene coastal deposits produced by eustatic oscillations driven by glacial–interglacial cycles, which generated high-frequency depositional sequences integrating a falling-stage systems tract of a lower-order sequence (Rosa et al., Reference Rosa, Barboza, Dillenburg, Tomazelli and Ayup-Zouain2011, 2017). As a result of the warming during the transitions from glacial to interglacial conditions (terminations), sea level rose from >100 m below the present level, promoting landward shift of the coastline (transgression), and reworking of some 3 to 10 m of sediments of the upper continental shelf, which were transferred to the coast and accumulated as the barrier-lagoon systems (Villwock and Tomazelli, Reference Villwock and Tomazelli1995; Dillenburg, Reference Dillenburg1996).
Each barrier-lagoon system comprises a long sandy barrier-beach complex (Davis, Reference Davis and Davis1994; Boyd, Reference Boyd, James and Dalrymple2010) developed parallel to the coastline, with lagoons and marshes formed on the back-barrier lowlands. The constituent sediments are derived from Precambrian to Mesozoic rocks and consist of fine-grained siliciclastic sand of terrigenous origin, mainly quartz sand, with some important concentrations of heavy minerals and biogenic carbonate (Figueiredo, Reference Figueiredo1975; Corrêa and Ponzi, Reference Corrêa and Ponzi1978; Silva, Reference Silva1979; Dillenburg et al., Reference Dillenburg, Tomazelli and Barboza2004; Lopes and Buchmann, Reference Lopes and Buchmann2008; Carassai et al., Reference Carassai, Lavina, Chemale and Girelli2019; Chemale et al., Reference Chemale, Lavina, Carassai, Girelli and Lana2021).
One major feature of barrier-lagoon systems is the presence of inlets and channels connecting the back-barrier lagoon to the foreshore across the barrier, defined as the subaerial portion of the barrier platform or beach-barrier complex, dividing it into two or more barrier islands (Oertel, Reference Oertel1985). The >600-km-long Barrier IV of the CPRS exhibits only four permanent inlets, namely the Chuy Creek (Fig. 1B), Mampituba River, and the outlets of the Patos and Tramandaí Lagoons, therefore it cannot be technically characterized as a barrier island system. As it is not clear whether they constituted barrier islands during their evolution, the subaerial components of the Pleistocene and Holocene systems along the CPRS are regarded here simply as coastal barriers.
The barrier-lagoon systems were assigned to interglacial sea-level high stands through correlation with oxygen isotope (δ18O) curves (Villwock and Tomazelli, Reference Villwock and Tomazelli1995). System I was regarded as being formed during Marine Isotope Stage (MIS) 11, but no numerical ages are available to date. Thermoluminescence (TL) and optically stimulated luminescence (OSL) dates from sediments and electron spin resonance (ESR) ages of fossil shells indicate an MIS 7 age for System II (Lopes et al., Reference Lopes, Dillenburg, Schultz, Ferigolo, Ribeiro, Pereira, Holanda, Pitana and Kerber2014a, 2014b, 2020). System III is correlated to MIS 5 based on a few ages (Poupeau et al., Reference Poupeau, Soliani, Rivera, Loss and Vasconcellos1988; Buchmann and Tomazelli, Reference Buchmann and Tomazelli2003), whereas subsurface deposits indicate a smaller sea-level high stand during MIS 3 between 47.7 and 36.2 ka BP (Dillenburg et al., Reference Dillenburg, Barboza, Rosa, Caron, Cancelli, Santos Fischer, Lopes and Ritter2020b), also recorded in the southeastern Brazilian coast (Machado et al., Reference Machado, Bastos, Albino and Zamprogno2020). System IV was formed by the late Pleistocene–Holocene transgression when sea level reached a maximum of ~2.5 m above the present mean sea level (amsl) between 6 and 5 ka (Caron, Reference Caron2007; Dillenburg et al., Reference Dillenburg, Barboza, Rosa, Caron and Sawakuchi2017; Barboza et al., Reference Barboza, Dillenburg, Ritter, Angulo, da Silva, Rosa, Caron and de Souza2021b).
Barrier-Lagoon Systems II, III, and IV are well represented in the southern CPRS (Fig. 1C), stretching almost continuously for ~230 km. From the southernmost coast of Rio Grande do Sul to La Coronilla (Uruguay), System IV was totally eroded, exposing Barrier III directly on the present-day shoreline, being characterized along this stretch of coast as a mainland beach barrier (Dillenburg et al., Reference Dillenburg, Roy, Cowell and Tomazelli2000, 2004, 2020a; Lima et al., Reference Lima, Dillenburg, Medeanic, Barboza, Rosa, Tomazelli, Dehnhardt and Caron2013; Caron, Reference Caron2014). The Barrier III outcropping on the shore was described as a lithostratigraphic unit designated the Chuy Formation (Goñi and Hoffstetter [1964] in Ubilla and Martínez, Reference Ubilla and Martínez2016; Delaney, Reference Delaney1965).
Barrier III is the most continuous Pleistocene unit along the southern Brazilian coast. Outcrops in the northern sector of the CPRS exhibit a stratigraphic succession with marine (upper shoreface–foreshore) deposits that allowed an estimate of a sea-level high stand with an amplitude of 7 ± 1 m amsl (Tomazelli and Dillenburg, Reference Tomazelli and Dillenburg2007). In geomorphological terms, this system is bounded landward by Barrier II and seaward by Lagoon System IV, but subsurface data show considerable overlap between the different systems (Fig. 1D).
METHODS
This research was based on data from outcrops, ground-penetrating radar (GPR) surveys, and subsurface samples that provided information on the structure of the Pleistocene System III. The best subaerial exposures of Barrier III in the southern CPRS are the outcrops AC-01 and AC-02 exposed on the left bank of Chuy Creek close to the seashore (Fig. 2A and B), where the creek course changes from NE-SW to NW-SE, probably under influence of structural features in the rocky basement associated with the Aiguá-India Muerta-Chuy Lineament (Rossello et al., Reference Rossello, de Santa Ana and Veroslavsky2000). Outcrop AC-03 is exposed directly on the shore (Fig. 2C), some 900 m to the north of AC-02. The current beach erosion exposes barrier sediments (Fig. 2D) containing ichnofossils Skolithos isp. (Fig. 2E), similar to those observed in the central CPRS (Fig. 2F). The barrier in this area reaches up to ~10–11 m in height, and the portion above sea level exhibits erosional gullies and ravines.

Figure 2. Outcrops of Barrier III in the southern Coastal Plain of the state of Rio Grande do Sul (CPRS): (A) AC-01, (B) AC-02, and (C) AC-03. (D) Barrier III deposits exposed on the beach with ichnofossils Skolithos (E). (F) Barrier III exposed on the beach in the central CPRS. (G) Detail of the southernmost CPRS showing the location of standard penetrating test (SPT) soundings and boreholes; the shells dated by Lopes et al. (Reference Lopes, Pereira, Kinoshita, Mollemberg, Barbosa and Baffa2020) were collected at the sites labeled in black.
The stratigraphic successions at the outcrops were described from fresh exposures after removal of the 10- to 20-cm-thick outer sediment layer, and the analyzed properties included the texture, color, thickness, lateral continuity, presence of sedimentary structures, and contact relationships of each layer. Sediment samples for sedimentological and micropaleontological analyses were obtained with 50 mL Falcon tubes. The altitude of the marine deposit at AC-03 was measured with a Trimble ProXRT global navigation satellite system (GNSS) receiver (datum: WGS84) and analyzed in a geographic information system (GIS) with a postprocessed precision of ±0.3 m.
The subsurface stratigraphy of Barrier-Lagoon System III was determined through physical properties of the sediment samples obtained in boreholes. Before installation of a wind farm in the southernmost CPRS, several standard penetrating test (SPT) soundings that reached depths of up to 20 m were made across that system for geotechnical purposes. Although the samples were discarded, the descriptions of the SPT soundings were made available for our research. During the installation phase, boreholes for the foundations of the wind generators that reached depths up to 17 m below the surface were made with rotating drills, and although most boreholes did not reach the same maximum depths of the SPTs, they offered a unique opportunity to investigate that system in the subsurface across a large area (Fig. 2G). The rotating drills used to open the boreholes stir the upper sediments, but the lower meters remain stable while the drill is raised, which allowed us to obtain samples from different depths, describe facies changes, and record the presence of marine macrofossil remains.
The sediment samples extracted from the outcrops and boreholes were described and classified according to the Munsell color scale and subjected to sedimentological analyses according to Folk (Reference Folk1980), and any fossil material was collected. The sediment samples were air-dried, manually disaggregated, and passed through a 2 mm mesh sieve to obtain macrofossils. Sediment aliquots were obtained with 0.5, 0.25, 0.125, and 0.063 mm mesh sieves for morphoscopic analysis and microfossil identification using optical microscope. Grain-size analyses of air-dried sediment samples were performed at Universidade Federal do Pampa (UNIPAMPA) using a Microtrac S3500 laser-diffraction particle size analyzer after >1 mm particles (shell and plant debris) were removed through sieving, as these larger particles can interrupt water flow in the laser measurement chamber. The sediments were classified according to Wentworth (Reference Wentworth1922) and Folk and Ward (Reference Folk and Ward1957). The texture designations were coded according to Farrell et al. (Reference Farrell, Harris, Mallinson, Culver, Riggs, Pierson, Self-Trail and Lautier2012). The distinct facies representing the different depositional environments were recognized by texture, color, primary sedimentary structures, fossil content, and contact relationships (when possible) and were grouped into associations according to Walker (Reference Walker, Walker and James1992) and Dalrymple (Reference Dalrymple, James and Dalrymple2010) that integrate the depositional systems they belong to (Tomazelli and Villwock, Reference Tomazelli and Villwock2005).
GPR data
The SPTs were sampled across Barrier-Lagoon System III (Fig. 2G). To complement the subsurface SPT data, GPR transects were made perpendicular to the coastline orientation, and paired with another previously obtained perpendicular transect (Rosa, Reference Rosa2012). The GPR system comprised a Geophysical Survey Systems (GSSI) SIR-3000 data collector for antennas Subecho 70 (Radarteam Sweden AB) in bistatic mode, with a two-way travel time range of 300 ns and penetration up to depths of 14 m. The profiles were collected using the common offset method, and the GPR system was connected to a GNSS for a real-time topographic survey. Noise and gain filters were applied during data acquisition.
The GPR data were postprocessed with the Radan and Prism2 software packages, proceeding with background removal, band-pass frequency filters, Ormsby band-pass, gain equalization, topographic corrections, and time to depth conversion. The trace analysis was done according to Leandro et al. (Reference Leandro, Barboza, Caron and Jesus2019). A dielectric constant of 10 for wet sand was used to convert travel time to depth, representing a velocity of 0.09 m/ns (Daniels et al., Reference Daniels, Roberts and Vendl1995), and was validated by lithologic data obtained from seven drill holes. The GPR profiles were topographically corrected using GNSS postprocessed elevation data points collected along the transects at 1 s intervals. These data were acquired with a Trimble Pro-XRT using the datum WGS84, postprocessed through the differential method, using a base station of Brazilian Institute of Geography and Statistics, located in the city of Pelotas (Rio Grande do Sul), and analyzed in a GIS.
The interpretation was based on the seismostratigraphic method (Payton, Reference Payton1977) adapted for GPR (Neal, Reference Neal2004), based on reflection termination (onlap, downlap, toplap, and truncations), geometry, and pattern of reflections (Abreu et al., Reference Abreu, Neal, Vail, Abreu, Neal, Bohacs and Kalbas2010; Barboza et al., Reference Barboza, Rosa, Hesp, Dillenburg, Tomazelli and Ayup-Zouain2011; Biancini da Silva et al., Reference Biancini da Silva, Barboza, Rosa and Dillenburg2014; Neal et al., Reference Neal, Abreu, Bohacs, Feldman and Pederson2016).
Numerical ages
The available ages of Barrier III were obtained in the northern (Poupeau et al., Reference Poupeau, Soliani, Rivera, Loss and Vasconcellos1988) and central (Buchmann and Tomazelli, Reference Buchmann and Tomazelli2003; Fig. 2F) CPRS using TL, whereas in the southern sector, shells from the boreholes shown in Figure 2 G were dated using the ESR method (Lopes et al., Reference Lopes, Pereira, Kinoshita, Mollemberg, Barbosa and Baffa2020; Table 1), which measures the amount of environmental radiation accumulated in the fossils. Sediment samples from marine and aeolian deposits exposed at the outcrops AC-01, AC-02 and AC-03 (Fig. 2) were collected with 25-cm-long and 7-cm-wide cylindrical PVC tubes for quartz OSL dating. The samples from AC-01 and AC-03 were collected close to the top of the marine deposit next to the ichnofossils Ophiomorpha nodosa, at altitudes of +3.6 m. At AC-01, other samples were collected in the overlying continental deposits. At AC-02, three samples were collected at altitudes of +1.5, +3.5, and +4.8 m. The altitudes of the marine deposits exposed at AC-01 and AC-02 were measured relative to the water level of Chuy Creek close to its mouth. Two additional samples from an outcrop (B3N) of Barrier III in the northern CPRS, obtained at altitudes of +5.1 and + 9.7 m measured with GNSS (precision of ±0.3 m) were also dated for comparison.
Table 1. Electron spin resonance (ESR) ages of shells from Barriers II (CH07A11) and III according to early (EU) and linear (LU) uptake models, and estimated marine isotope stages (MIS) at the time of formation of the shells from the analyzed samples (from Lopes et al. Reference Lopes, Pereira, Kinoshita, Mollemberg, Barbosa and Baffa2020).a

a The ages mentioned throughout the text are according to the EU model, except for samples with abnormally younger EU ages due to high uranium uptake, in which cases the LU ages (indicated by the asterisks) are regarded as valid.
At each laboratory, the sediments were wet sieved to acquire the target sand size fractions (100–160 or 180–250 μm) and treated with hydrogen peroxide to remove organic matter and with hydrochloric acid to remove carbonates. Afterward, quartz grains were separated from heavy minerals and feldspar grains through density separation with lithium metatungstate or sodium polytungstate solutions at densities of 2.75 and 2.62 g/cm3. Quartz concentrates were treated with hydrofluoric acid (38%) for 40 min to etch the outer rind of quartz grains affected by alpha radiation and to eliminate eventual remnant feldspar grains. The natural radionuclide contents (U, Th, and K; Supplementary Table 1) were determined by high resolution γ-spectroscopy using a high-purity germanium detector encased in an ultralow background shield. Water saturation was used for dose-rate correction. Radionuclide concentrations were converted into radiation dose rates using conversion factors presented by Guérin et al. (Reference Guérin, Mercier and Adamiec2011). The cosmic dose-rate contribution was calculated using sample burial depth, geographic coordinates, and elevation (Prescott and Hutton, Reference Prescott and Hutton1994).
The sediment samples were processed at Datação, Comércio e Prestação de Serviços Ltd. (AC-01), the Dating and Dosimetry Laboratory of the Federal University of São Paulo (UNIFESP) (AC-02), and the Luminescence and Gamma Spectrometry Laboratory (LEGaL) at the Institute of Geosciences of the University of São Paulo (AC-03 and northern CPRS, B3N). The equivalent doses (D e) in 10 to 24 aliquots (~7 mg each) obtained from the quartz sand concentrates of each sample were determined using the single aliquot regenerative-dose protocol, which measures the natural OSL signal after preheating until the signal is zero, and then subjects the quartz grains to another cycle of irradiation, preheating, and measurement, producing a regenerated OSL response, which is then compared with the natural OSL signal (Murray and Wintle, Reference Murray and Wintle2000, Reference Murray and Wintle2003; Wintle and Murray, Reference Wintle and Murray2006).
The aliquots were irradiated with several predetermined doses (Gy) using a 60Co source (AC-01) and 90Sr/90Y beta sources with dose rates of 0.089, 0.868, and 0.134 Gy/s to establish calculated-to-given dose ratios. The luminescence signals were measured with Risø TL/OSL DA-20 readers with infrared and blue LEDs for stimulation and a Hoya U-340 filter for light detection in the UV band. The aliquots were bleached under sunlight and subjected to preheating plateau for dose-recovery tests, obtaining a cut heat temperature of 220°C. The D e results of aliquots that passed recycling (±10%) and recuperation (<5%) tests and exhibited negligible infrared-stimulated luminescence signal were utilized to calculate the final D e value, which was evaluated with the radial plot method (Galbraith et al., Reference Galbraith, Roberts, Laslett, Yoshida and Olley1999; Galbraith and Roberts., Reference Galbraith and Roberts2012) and using the numOSL package. The ages from samples with overdispersion <30% were calculated according to the central age and finite mixture age models (Peng et al., Reference Peng, Dong, Han, Long and Liu2013). The sample from AC-03 (B3-01-LOE) showed natural OSL signal more than two times the first regeneration dose (D 0) of the dose–response curve, and thus only a minimum OSL age was calculated based on the average of 2D 0 of the sample.
RESULTS
The analysis of the SPT reports and description of sediment samples from the boreholes and outcrops provided information about the spatial distribution of distinct facies belonging to the depositional systems II and III and grouped in associations (Supplementary Table 2), illustrated here by the three longest and most representative SPT profiles with associated GPR data (Fig. 3). Unfortunately, most of the GPR transects produced no useful data, probably because of interference by the strong iron oxide precipitation on the weathered sediments. Nevertheless, the GPR-1 transect from Rosa (Reference Rosa2012; Fig. 4A) and GPR-2 transect made along the wind farm CH05 (Fig. 4B) provided information on the subsurface structure of the deposits, with both transects exhibiting comparable depositional units despite the differences in length and location. The integration of data obtained in both subsurface (Fig. 5) and outcrops (Fig. 6) allowed us to establish major subdivisions of the depositional units in the area. The boundaries and ages of isotopic stages and substages follow Lisiecki and Raymo (Reference Lisiecki and Raymo2005) and Railsback et al. (Reference Railsback, Gibbard, Head, Voarintsoa and Taucanne2015).

Figure 3. Map showing the locations of the standard penetrating tests (SPTs), ground-penetrating radar (GPR) lines and outcrops described in the text, and interpretation of the three SPT transects.

Figure 4. Raw and interpreted ground-penetrating radar (GPR) transects: (A) GPR-1 from Rosa (Reference Rosa2012) and (B) GPR-2 from the wind farm CH05 (profile 2 in Fig. 3) with superimposed standard penetrating test (SPT) soundings. The arrows represent the reflection terminations (onlap: blue; downlap: green; truncations: red).

Figure 5. Model of the depositional environments and stratigraphic succession of the deposits on the landward portion of Barrier III in the study area. FA, facies association; C, clay; Z, silt; S, sand (vc, very coarse; c, coarse; m, medium; f, fine; vf, very fine).

Figure 6. (A) Stratigraphic succession, optically stimulated luminescence (OSL) ages, and average grain size of Barrier III from the outcrops AC-01 (*), AC-02 (**), and AC-03 (***). Physical features from the base to the top of the marine facies/Unit A: (B) cross-through stratification, (C) sets of cross-parallel laminations, (D) landward-dipping laminations associated with ripples, (E) oxidized shell molds and aggregates of iron-manganese-coated sand grains, (F) ichnofossil Ophiomorpha nodosa, (G) marine-continental boundary at AC-01 showing mottling and root traces.
Barrier-Lagoon System II
Although recorded in several SPTs, the only boreholes that reached this unit were made on the southernmost area of the wind farm (profile 3 in Fig. 3). It represents facies association 1 (Supplementary Table 2), formed essentially of quartz sand with translucent and opaque (mostly ilmenite and magnetite) heavy minerals. The lower facies (Fig. 5) is an olive gray (5Y 4/2 in the Munsell system) very poorly sorted fine to very fine silty sand (zS1), with rounded polished grains, containing fragmented marine mollusk shells and a microfossil assemblage dominated by miliolid foraminifers, with few rotaliids and ostracods. The molluscan assemblage points to a shallow-marine (foreshore–upper shoreface) depositional environment (Bettinelli et al., Reference Bettinelli, Dillenburg, Lopes and Caron2018). The ESR ages of shells (Table 1) ranged from 497 ± 28 to 247 ± 20 ka (Lopes et al., Reference Lopes, Pereira, Kinoshita, Mollemberg, Barbosa and Baffa2020), the youngest age being correlated to ESR-dated shells from outcrops exposed along the banks of Chuy Creek (Fig. 3D) closer to the subaerial Barrier II (Lopes et al., Reference Lopes, Kinoshita, Baffa, Figueiredo, Dillenburg, Schultz and Pereira2014b).
The overlying facies (Fig. 5) is a ~1-m-thick yellowish-brown (10YR 5/4), moderately sorted fine silty sand (zS2) with rounded and frosted grains, heavy minerals, and corroded, sand-sized carbonate grains, probably from dissolved shells. These features are similar to the aeolian deposits of Barrier III (see following section) and indicate that this facies is the upper portion of the fossiliferous facies zS1 that was subaerially exposed and weathered before the deposition of the overlying lagoon sediments, and thus is interpreted as the subaerial unconformity between systems II and III resulting from the sea-level low stand (Regression II).
Barrier-Lagoon System III
The deposits unconformably overlying Barrier II are assigned to Barrier-Lagoon System III based on stratigraphic relationships, vertical facies succession (Fig. 5), changes in compaction indicated by the SPT reports, ages, and fossil content, which allowed us to recognize distinct depositional environments grouped in facies associations 2 and 3 (Supplementary Table 2).
Back-barrier/landward portion of Barrier III
This area (Fig. 2G) encompasses the back-barrier deposits and main barrier body. The lower part of facies association 2 (Table 2) at the base of the stratigraphic succession is an ~3- to 7-m-thick, poorly sorted, grayish-brown (2.5Y 5/2) sandy clayey silt (scZ) to sandy silt (sZ) facies separated from the underlying Barrier II by a sharp contact, as observed in some boreholes, and interpreted as a lagoon bottom (LB) deposit. It was reached by few boreholes, although the SPT reports indicate that it is widely distributed throughout the area and seems to extend seaward beneath Barrier III, being recorded in the SPT sounding FS-27 from Lima et al. (Reference Lima, Dillenburg, Medeanic, Barboza, Rosa, Tomazelli, Dehnhardt and Caron2013) and the SPT F2 (Fig. 2G). Its absence in the SPT F10/borehole G10A08 located between F2 and FS-27 (Fig. 2G) could indicate the presence of a sandy feature on the lagoon margin (LM) such as a sand spit or washover fan. The associated macrofossils consist of few fragmented and complete shells of marine bivalve species Eucallista (Amiantis) purpurata, Mactra janeiroensis, and Corbula caribaea. It is noteworthy that only juveniles (<2-cm-long shells) of the two former species were found. Unidentifiable plant fragments and a microfossil assemblage dominated by rotaliid foraminifers with fewer miliolids and ostracods are also present.
Table 2. Optically stimulated luminescence (OSL) ages obtained in sediments of Barrier III from outcrops in the southern (AC-01, AC-02, and AC-03) and northern (B3N) Coastal Plain of the state of Rio Grande do Sul (CPRS).

a D e, equivalent dose.
b MIS, Marine Isotope Stage.
c Minimum age.
The upper part of facies association 2 (Table 2) overlying the LB is a 5- to 17-m-thick coarsening-upward, moderately sorted silty fine sand (zS) to fine-very fine sand (S) facies (Fig. 5) interpreted as LM deposits forming the thickest portion of Barrier III (Fig. 3). It encompasses the depositional Unit 1 characterized in both GPR transects (Fig. 4A and B) by subhorizontal and landward-dipping reflections that indicate migration of the margin. The sediment color varies from dark grayish green (5GY 4/2) at its base to yellowish brown (10YR 5/4) in its upper portion. Abundant mollusk shells, foraminifers, and fragments of other marine invertebrates, such as echinoids, cirripeds, and crabs, were found in several boreholes, distributed over a large area (Fig. 2G). The mollusks are mostly coastal marine species, but a few specimens of two bivalves that inhabit low-energy, fully saline to brackish lagoon environments (Anomalocardia flexuosa and Erodona mactroides) were also found (Bettinelli et al., Reference Bettinelli, Dillenburg, Lopes and Caron2018; Lopes and Pereira, Reference Lopes and Pereira2018; Lopes et al., Reference Lopes, Ritter, Barboza, Rosa, Dillenburg and Caron2022). The microfossil assemblage is dominated by rotaliid foraminifers characteristic of coastal marine to lagoon environments (Elphidium discoidale, Ammonia beccari, and Buccella peruviana).
The ESR ages (Table 1) obtained from marine shells (E. purpurata) collected in back-barrier settings from a deposit at altitudes of +1 to +4 m in borehole G05A11 (Fig. 2G) ranged from 174 ± 43 to 306 ± 21 ka (Lopes et al., Reference Lopes, Pereira, Kinoshita, Mollemberg, Barbosa and Baffa2020). In borehole HM29A07, the shelly sand layer positioned at altitudes between −3.5 to +5.5 m yielded shells dated between 178 ± 20 and 271 ± 23 ka, whereas the shells retrieved from a deposit at altitudes between −5 and +5.5 m from borehole HM29A09 were dated at 251 ± 25 to 359 ± 38 ka (Lopes et al., Reference Lopes, Pereira, Kinoshita, Mollemberg, Barbosa and Baffa2020).
The SPT profiles (Fig. 3) indicate a maximum altitude of 7 to 10 m amsl for the LM deposit. The upper seaward part of the LM is a sandy (S) facies with few shells and lower compaction indicating a change in the depositional environment. It represents the depositional Unit 3 in GPR-2 (Fig. 4B), characterized by stacked, seaward-dipping parallel reflections indicating aggradation–progradation of the barrier, apparently in backshore–foreshore setting.
The overlying facies association 3 (Supplementary Table 2) includes organic-rich sand and peat retrieved in some boreholes (Figs. 2 G and 3) that indicate subaerial exposure and development of plant-rich lakes or swamps on top of the LM deposit on the main barrier body (profile 1 in Fig. 3) between the deposition of Units 1 and 2 identified in the GPR transects (Fig. 4A and B). Unit 2 represents a depositional variation of LM deposits, with high-amplitude, subhorizontal, and landward-dipping reflections. It is a massive to laminated yellowish brown (10YR 5/4), moderately well sorted very fine to medium sandy facies (S), less compacted than Unit 1. The sediments retrieved from boreholes made on top of the main barrier body exhibit pedogenic features indicating subaerial (aeolian) deposition, whereas the low-angle, high-amplitude landward-dipping reflections in both GPR transects (Fig. 4A and B) show that on the back-barrier, Unit 2 accumulated in subaqueous environment and was then covered with aeolian sand, thus filling the lagoon.
The upper portion of Units 2/3 consists of a clayey silty sand (czS) facies, oxidized at the top and containing iron oxide nodules and larger irregular masses, mottlings, and root traces, represented in the GPR transects by a subaerial unconformity (Fig. 4A and B). The overlying Unit 4 is characterized in both GPR transects by subhorizontal high-amplitude reflections indicating aeolian accumulation. It consists of a greenish-gray (GLEY 1 6/1) sandy clayey silt (scZ) facies, probably a mixture of wind-blown sand with silt accumulated during the last glacial as the Cordão Formation (Lopes et al., Reference Lopes, Dillenburg and Schultz2016), exhibiting irregular nodules of iron-manganese produced by weathering and oscillations of the water table, sparse carbonate nodules, and a clay-rich Bt horizon beneath the sandy soil cover.
Seaward portion of Barrier III
There is little subsurface information on the middle-seaward barrier due to the thickness of the overlying aeolian facies (Fig. 3) and the few SPTs and boreholes made seaward. The outcrops AC-01, AC-02, and AC-03 (Fig. 2) exhibit a depositional succession of marine and continental (aeolian) deposits (Fig. 6A). Marine Unit A is the Chuy Formation described by Delaney (Reference Delaney1965), a well-sorted, fine sand (S) facies with rounded and polished quartz grains, ranging in color from very pale brown (10YR 7/4) to brownish yellow (10YR 6/8) due to iron oxide precipitation. Trough cross-stratification (Fig. 6B) is visible at the base of AC-02, overlain by large-scale cross strata dipping at angles of 18° to 24° (Fig. 6C). The upper marine deposit at AC-01 exhibits sets of landward-dipping planar laminations intercalated with subhorizontal laminations and ripples (Fig. 6D). Subspherical mudclasts and dark-brown aggregates of iron-manganese-coated sand grains are dispersed in the matrix, and heavy minerals are concentrated along bedding planes. The heavy mineral assemblage is dominated by detrital ilmenite (58.4%) and magnetite (13.5%), with smaller amounts of translucent minerals such as zircon, rutile, and pyroxenes (Silva Reference Silva1979). No carbonate fossils are preserved, but oxidized molds left by dissolved disarticulated bivalve shells in concave-down position are visible along bedding planes at AC-02 (Fig. 6E). Mud-lined ichnofossils O. nodosa were observed at AC-01 (Fig. 6F) and AC-03. This unit exhibits a strong reddish color (10YR 5/8) at the top due to subaerial weathering and iron oxide precipitation (Fig. 6G).
The top of the marine unit is positioned ~4 m amsl based on the altitude of O. nodosa at AC-01 and AC-03. The OSL-dated sediment samples collected at ~3.6 m amsl (Fig. 6A, Table 2) provided ages of 104.75 ± 10.2 ka at AC-01 and a minimum age of 101.81 ± 8.86 ka at AC-03 (B3-01-LOE). At AC-02, however, the dated samples are much older, ranging from 128.3 ± 6.9 ka at the altitude of +1.5 m (AC-02A), 140.8 ± 8.5 at +3.5 m (AC-02B), and 131.7 ± 6.8 at +4.8 m (AC-02C). A similar age inversion occurred in the northern CPRS, where the sample obtained at +5.1 m was dated to 106.49 ± 9.4 ka, whereas the sample at +9.7 m was dated at 134.09 ± 11.39 ka (Table 2).
As the focus here is the marine deposits, the overlying continental deposits will be described in another paper. Nevertheless, the marine–continental transition at AC-01 is gradual and characterized by mottling features and plant root traces (Fig. 6G), with interdune (backshore) deposits (Unit B) topped by a strongly oxidized weathered surface, overlain by the aeolian units C–E. One OSL age of 82.3 ± 12.4 ka was obtained at the base of Unit C (Fig. 6A), and successive younger ages above indicate continuous aeolian deposition up to about 10 ka, intercalated with organic-rich accumulations suggestive of incipient soil development.
The dated shells of E. purpurata from subsurface deposits on the seaward Barrier III include seven specimens obtained at Passo da Lagoa in the southwestern shore of Mangueira Lagoon (Fig. 2G). These shells were recovered from an altitude between +2 and +3 m and yielded ESR ages ranging from 100 ± 9 to 130 ± 10 ka (Table 1). The other dated shells were recovered from a deposit located at an altitude between −2 and −7 m reached by the borehole G10A08 (Fig. 2G) and yielded ages ranging from 87 ± 5 to 248 ± 21 ka (Lopes et al., Reference Lopes, Pereira, Kinoshita, Mollemberg, Barbosa and Baffa2020).
DISCUSSION
The stratigraphic successions observed in the boreholes and SPTs across Barrier III, characterized by muddy LB facies unconformably overlying weathered sediments of Barrier II and overlain by sandy shell-bearing LM deposits topped by aeolian units (Figs. 3 and 5), record a complete transgressive–regressive cycle bounded by subaerial unconformities (Kraft and John, Reference Kraft and John1979; Thom, Reference Thom1983; Posamentier and James, Reference Posamentier, James and Posamentier1993). These deposits allow the reconstruction of the evolution of Barrier III through analysis and correlation of the data obtained in subsurface and outcrops and comparison with other records of the MIS 5 transgression. Although the data presented here are limited with respect to the total extension (>600 km) of Barrier III along the CPRS, they provide a basis for comparison with results obtained in other portions of this unit and with the Holocene Barrier IV described by different studies performed along the CPRS.
Age of Barrier III
The barrier-lagoon systems of the CPRS were correlated to interglacial marine transgressions separated by some 100 ka (Villwock et al., Reference Villwock, Tomazelli, Loss, Dehnhardt, Horn, Bachi, Dehnhardt and Rabassa1986; Villwock and Tomazelli, Reference Villwock and Tomazelli1995) based on δ18O curves of marine foraminifers (Shackleton and Opdyke, Reference Shackleton and Opdyke1973). As the CPRS is a far-field site, distant from glaciated areas, and regarded as tectonically stable throughout the Quaternary, the development of the barrier-lagoon systems and elevation of the coastal deposits mainly reflect the effects of glacial–interglacial sea-level oscillations. Each transgressive maximum (sea-level high stand) was followed by a marine regression (low stand), thus allowing the characterization of the evolution of the systems as a succession of depositional sequences (Rosa et al., Reference Rosa, Barboza, Dillenburg, Tomazelli and Ayup-Zouain2011, 2017).
The ESR-dated shells from Barrier-Lagoon System III exhibit a wide age range (Lopes et al., Reference Lopes, Pereira, Kinoshita, Mollemberg, Barbosa and Baffa2020; Table 1). Although no shells from the back barrier provided results within the range of the LIG (MIS 5e, 130.1–115.1 ka), ages corresponding to that stage were obtained on the seaward barrier in two shells from Passo da Lagoa (130 ± 10 and 116 ± 12 ka) at an altitude of some +2 m amsl, and one from borehole G10A08 (118 ± 9 ka) (Lopes et al., Reference Lopes, Pereira, Kinoshita, Mollemberg, Barbosa and Baffa2020; Table 1). The mixing of shells with different ages indicates reworking and redeposition of older specimens together with younger ones by erosion during a transgression, resulting in fossil assemblages with large time averaging. It is assumed that the youngest shells in each group are closer in age to the transgressive event that produced the mixing and thus point to the maximum age of each deposit. Under that assumption, the two youngest shells from the back barrier with ages of ~174 and 178 ka (Lopes et al., Reference Lopes, Pereira, Kinoshita, Mollemberg, Barbosa and Baffa2020; Table 1), may correspond to a positive sea-level oscillation during the glacial low stand of MIS 6 (191–130.1 ka) (Thompson and Goldstein, Reference Thompson and Goldstein2005) and would have been eroded and redeposited during MIS 5e. The presence in back-barrier settings of shells much older than MIS 6 and even MIS 7 (Lopes et al., Reference Lopes, Kinoshita, Baffa, Figueiredo, Dillenburg, Schultz and Pereira2014b, 2020) indicates that this transgression also reworked deposits of the underlying Barrier II.
An important result of this study is the recognition that the Barrier III/Chuy Formation, originally correlated to the MIS 5e high stand of ~126 ka (Villwock and Tomazelli, Reference Villwock and Tomazelli1995), also includes younger deposits. The ages on the seaward barrier indicate deposits formed by one, or possibly two, post–MIS 5e sea-level oscillations of smaller amplitudes. The OSL ages of 128.3 ± 6.9 ka (MIS 5e), 131.7 ± 6.8 ka, and 140.8 ± 8.5 ka (MIS 6) from AC-02 (Table 2) are older than those obtained some 450 m landward at AC-01 (Fig. 6A) and could have been the result of incomplete resetting of the OSL signal in quartz grains. This phenomenon can result from partial bleaching due to short exposure time to sunlight, filtering, or attenuation of sunlight during transport, especially in turbid or deep waters, and may produce overestimated ages or age inversions in depositional successions (Wallinga, Reference Wallinga2002a, Reference Wallinga2002b; Singarayer et al., Reference Singarayer, Bailey, Ward and Stokes2005; Hu et al., Reference Hu, Zhang, Qiu and Zhou2010). In the case of AC-02, partial bleaching could have occurred as a result of the short time of transport and redeposition of sediments eroded from older deposits or filtering/attenuation of light by the iron oxide coatings on the grains. This phenomenon could also explain the age inversion in the sediments dated to 134.09 ± 11.39 ka (MIS 6) overlying the sample B3N-A-02 dated to 106.49 ± 9.40 ka (MIS 5c) in the northern CPRS (Table 2) and a muddy sand dated to 109.1 ± 7.7 ka (Lopes et al., Reference Lopes, Souza, Pereira, Raupp, Tatumi, Yee and Dillenburg2021) deposited on top of a Holocene diatomite, eroded from a paleo-spit developed on a Pleistocene terrace (Fig. 7A and B) on the shore of Mirim Lagoon.

Figure 7. (A) Google Earth image and (B) digital elevation map generated with NASA's Shuttle Radar Topographic Mission (SRTM) data of the study area in the southernmost Coastal Plain of the state of Rio Grande do Sul (CPRS) showing the site where an optically stimulated luminescence (OSL) age of ~109 ka was obtained in sediments from terrace T2 (white dot; Lopes et al., 2021a), and the location of the paleo-inlet (white arrow) across Barrier III (Barboza et al., Reference Barboza, Ayup-Zouain, Tomazelli, Rosa and Ferreira2005) (B, barrier; L, lagoon systems). (C) Google Earth image showing a subaqueous platform on the eastern shore of Mangueira Lagoon built by sediments from the Barrier IV dune field. (D) Google Earth image showing intralagunar deltas built by sediments transferred from Barrier IV by rain-fed creeks.
One TL age of 109 ± 7.5 ka was obtained in the central CPRS some 300 km to the north of the study area, on relict sediments interpreted as foreshore–shoreface deposits outcropping on the modern shore (Fig. 2F) beneath a Holocene basal peat (Delaney, Reference Delaney1965; Buchmann and Tomazelli, Reference Buchmann and Tomazelli2003). The OSL age of 109.1 ± 7.7 ka from the aforementioned terrace on the shore of Mirim Lagoon (Lopes et al., Reference Lopes, Souza, Pereira, Raupp, Tatumi, Yee and Dillenburg2021; Fig. 7A and B) and some shells from Passo da Lagoa (Lopes et al., Reference Lopes, Pereira, Kinoshita, Mollemberg, Barbosa and Baffa2020; Fig. 2G) with similar ESR ages (112 ± 9, 110 ± 8, 116 ± 12 and 108 ± 7 ka) are consistent with deposition during the stadial substage MIS 5d (115.1–105.9 ka).
The OSL ages (Table 2) obtained in the outcrops AC-01 (104.75 ± 10.2 ka) and AC-03 (>101.81 ± 8.86 ka), and the youngest shell from Passo da Lagoa (100 ± 9 ka) (Lopes et al., Reference Lopes, Pereira, Kinoshita, Mollemberg, Barbosa and Baffa2020; Table 1), indicate deposition by a positive sea-level oscillation during the interstadial substage MIS 5c (105.9–92.8 ka). The ages ranging from 128.3 ± 6.9 to 140.8 ± 8.5 ka at AC-02 (Table 2) indicate reworking of MIS 5e and MIS 6 deposits by this MIS 5c transgression. Two shells from the seaward barrier obtained in the borehole G10A08 (Fig. 2G) were dated to 101 ± 7.7 ka (MIS 5c), but the youngest shell from this borehole, dated to 87 ± 5 ka, suggests that the deposit may be younger, correlated to the stadial MIS 5b (92.8–84.7 ka), or more likely to the interstadial MIS 5a (84.7–71 ka) high stand.
The evolution of Barrier III
The stratigraphy and ages indicate that Barrier III is a complex structure built by successive sea-level oscillations during MIS 5. Its different constituent deposits had not been distinguished before, due to the lack of numerical ages, thick aeolian cover (Fig. 3), essentially identical sediment composition, and lateral juxtaposition of the sedimentary units, as recorded in the U.S. Atlantic coast, where MIS 5e deposits are difficult to distinguish from younger units (Muhs et al., Reference Muhs, Wehmiller, Simmons, York, Gillespie, Porter and Atwater2003). Because the deposits located on the landward and seaward portions of Barrier III seem to be related to distinct sea-level oscillations within the same transgressive–regressive cycle, its evolution can be subdivided into distinct phases.
Low-stand phase
The older Pleistocene deposits are represented in the stratigraphic succession by the shell-bearing silty sand (zS1) marine facies correlated to the transgressive phase of Barrier System II. The upper weathered silty sand (zS2) facies indicates subaerial exposure and implies a significant time break before the deposition of the overlying lagoon deposits and thus represents a subaerial unconformity developed during a sea-level low stand (regressive phase) after System II was established. The younger ESR age from the borehole CH07A11 (247 ± 20 ka; Table 1) allows correlation of these deposits to MIS 7 (243–191 ka) and the subaerial unconformity to MIS 6.
Transgressive phase
This phase (Transgression III) is recorded by the deposits on the landward portion of the barrier and the back-barrier lagoon, and although the data obtained from boreholes and SPTs described earlier (Fig. 3) do not provide details such as facies contacts and sedimentary structures, they allow recognition of major large-scale features and depositional units. Transgressive barriers develop as a result of the vertical and horizontal (landward) movements of the coastline in response sea-level rise in low-gradient, wave-dominated coasts and are characterized by marine (shoreface–foreshore) and aeolian sediments overlying lagoon units (Swift, Reference Swift1968; Kraft, Reference Kraft1971; Roy et al., Reference Roy, Cowell, Ferland, Thom, Carter and Woodroffe1997; Cattaneo and Steel, Reference Cattaneo and Steel2003). These deposits have low preservation potential due to their erosional nature and are maintained through equilibrium between the rate of sea-level rise/shoreface erosion and the input of sediment eroded from the shoreface and transferred to the back barrier (Reinson, Reference Reinson1979; Roy et al., Reference Roy, Cowell, Ferland, Thom, Carter and Woodroffe1997).
The early stage of the transgression is represented by the muddy LB facies at the base of System III, a common feature of lagoons developed in microtidal coasts (Reading and Collinson, Reference Reading, Collinson and Reading1996). Its extension beneath the LM sediments (Fig. 3) shows that Barrier III was probably formed seaward of its present position and migrated landward over lagoon deposits as the sea level rose. Similar behavior is observed in some sectors along Barrier IV, where Holocene lagoon and aeolian deposits overlie Pleistocene sediments exposed on the foreshore–backshore (Tomazelli et al., Reference Tomazelli, Villwock, Dillenburg, Bachi and Dehnhardt1998; Buchmann and Tomazelli, Reference Buchmann and Tomazelli2003; Dillenburg et al., Reference Dillenburg, Tomazelli and Barboza2004; Travessas et al., Reference Travessas, Dillenburg and Clerot2005; Caron, Reference Caron2014).
The scarcity and small size of the marine shells found in the basal LB facies suggest only sporadic and selective transport of marine sediments and shells from the foreshore to the back barrier at this stage. The material was likely transported through ephemeral channels or overwash and only under certain conditions such as storms, because if several permanent and deeper channels existed, they would increase the transport of coarse material to the lagoon (Boothroyd et al., Reference Boothroyd, Friedrich and McGinn1985). For example, the shell material recovered from the LB facies differs from the more diverse and larger marine shells found at the bottom of the permanent modern estuarine channel connecting the Patos Lagoon (Fig. 1C) to the ocean, subject to strong hydrodynamics (Lopes et al., Reference Lopes, Ritter, Barboza, Rosa, Dillenburg and Caron2022).
Considering that the development and maintenance of coastal barriers depend on the equilibrium between sea-level rise and sediment supply (Curray, Reference Curray and Miller1964), Barrier III was probably built by sediments eroded from the shelf during Transgression III (Dillenburg et al., Reference Dillenburg, Roy, Cowell and Tomazelli2000), because all fluvial input of sediments to the shore since the emplacement of Barrier II during the previous marine transgression some 100 ka earlier (MIS 7) became trapped in the Lagoon System II, represented today by Mirim Lagoon (Fig. 1C). It was estimated that a sea-level rise in the CPRS would erode between 3 and 10 m of the sediments on the shelf surface (Dillenburg, Reference Dillenburg1996), depending on the depth of shoreface erosion and shelf slope (Belknap and Kraft, Reference Belknap and Kraft1985). The low average shelf slope (0.03° to 0.08°) implies that the relatively high rates of sea-level rise estimated for the last interglacial transgression (~16 m/ka) could have eroded substantial volumes of shelf sediments (Roy et al., Reference Roy, Cowell, Ferland, Thom, Carter and Woodroffe1997; Rohling et al., Reference Rohling, Grant, Hembleen, Siddall, Hoogakker, Bolshaw and Kucera2008). Reworking of preexisting marine deposits is also indicated by the dated shells older than MIS 5.
In the northern CPRS, the subaerially exposed shelf was dissected by fluvial systems before the Holocene Transgression IV, which increased the preservation potential of the sediments trapped in fluvial paleochannels (Dillenburg, Reference Dillenburg1996; Dillenburg et al., Reference Dillenburg, Roy, Cowell and Tomazelli2000). In the southern CPRS, however, the lack of major fluvial drainages cutting across the subaerially exposed shelf after Barrier II was formed likely reduced the preservation potential of shelf sediments exposed during the Low Stand II (MIS 6), which would then be eroded by the Transgression III. Part of the eroded sediments would have been transported offshore to the shelf (Roy et al., Reference Roy, Cowell, Ferland, Thom, Carter and Woodroffe1997) and the remainder would be transferred to the foreshore to build Barrier III.
As the sea level continued to rise and the shoreline moved farther landward, the transfer of material from the shoreface–foreshore to the back-barrier lagoon increased, as indicated by the thickness, coarsening-upward trend (Fig. 6), and abundant shell content found in the LM deposits (Fig. 3), corresponding to depositional Unit 1 in the GPR transects (Fig. 4A and B). The predominance of marine species in the shell assemblages found in the lagoon deposits (Bettinelli et al., Reference Bettinelli, Dillenburg, Lopes and Caron2018; Lopes and Pereira, Reference Lopes and Pereira2018) indicates a paleo-lagoon subject to strong marine influence. The shells older than Barrier II (Lopes et al., Reference Lopes, Pereira, Kinoshita, Mollemberg, Barbosa and Baffa2020) indicate reworking of older sediments in back-barrier settings, although at least part of the material could have been exposed on the shoreface–foreshore of Barrier III and redeposited on the backshore through inlets or overwash (Bettinelli et al., Reference Bettinelli, Dillenburg, Lopes and Caron2018; Lopes et al., Reference Lopes, Kinoshita, Baffa, Figueiredo, Dillenburg, Schultz and Pereira2014b).
Inlets and channels cutting across the barrier are a major pathway of sediment transfer from the foreshore–shoreface to back-barrier areas (Leatherman, Reference Leatherman1979). In wave-dominated microtidal coasts, these channels are shallow and in general exhibit an ephemeral character, being developed under extreme storm conditions, and can disappear in a matter of months to a few years without leaving distinct geologic evidence (Armon and McCann, Reference Armon and McCann1979; Kahn and Roberts, Reference Kahn and Roberts1982; Boothroyd et al., Reference Boothroyd, Friedrich and McGinn1985; Reading and Collinson, Reference Reading, Collinson and Reading1996). Although no clear evidence of such channels was identified in the subsurface deposits, geomorphological evidence (Barboza et al., Reference Barboza, Ayup-Zouain, Tomazelli, Rosa and Ferreira2005) suggests the presence of an inlet across Barrier III in the southern study area (Figs. 2 G and 7A and B). The wide distribution of marine shells along Lagoon III (Fig. 2G) could indicate that other channels may have cut across Barrier III during the transgressive phase.
Together with tidal channels and inlets, overwash is one of the main processes responsible for transporting material from the foreshore–shoreface to backshore lagoons (Armon and McCann, Reference Armon and McCann1979; Kahn and Roberts, Reference Kahn and Roberts1982; Boothroyd et al., Reference Boothroyd, Friedrich and McGinn1985; Reading and Collinson, Reference Reading, Collinson and Reading1996; Sedgwick and Davis, Reference Sedgwick and Davis2003). It results from surges driven by storm events that cause waves to overtop low-relief areas of the barrier and deposit sediments and shells on the back barrier (Deery and Howard, Reference Deery and Howard1977; Leatherman, Reference Leatherman1979, Reference Leatherman1983; Davis Reference Davis and Davis1994), although it can also occur in the absence of storms, driven by other factors such as coastal subsidence, wave regime, absence or low height of foredunes, and barrier width (Morton et al., Reference Morton, Gonzalez, Lopez and Correa2000; Matias et al., Reference Matias, Ferreira, Vila-Concejo, Morris and Dias2010; Rodriguez et al., Reference Rodriguez, Theuerkauf, Ridge, VanDusen and Fegley2020). In barriers under a transgressive (retrograding) regime characterized by weakly developed and discontinuous foredunes, overwash may account for some 50% of the barrier deposits above the mean sea level (Morton, Reference Morton and Davis1994). This process allows the retrograding barrier to maintain its dimensions if there is equilibrium between erosion on the seaward side and deposition on the back barrier, which under conditions of sea-level rise and constant sediment supply results in landward migration of the barrier (Swift, Reference Swift1975, Leatherman, Reference Leatherman1983). The resulting washover fan deposits are conspicuous features on the landward portion of retrograding barriers and are characterized by landward-dipping strata formed of subhorizontal planar laminations, but may include distal foresets of strata dipping at ~30° if these are deposited under water (Schwartz, Reference Schwartz1982; Sedgwick and Davis, Reference Sedgwick and Davis2003).
Although primary structures were not clearly defined in the sediments extracted from the boreholes, the stacked landward-dipping reflections on the back barrier recorded as Unit 2 in the GPR transects (Fig. 4A and B) indicate landward migration and aggradation of the barrier, probably by sand transferred from the adjacent barrier through overwash, wind, and creeks draining rain-fed interdune lakes. An analog of this process is observed today on the southeastern shore of Mangueira Lagoon in the southern CPRS, where subaqueous platforms (Fig. 7C) and intralagunar deltas (Fig. 7D) are built by sediments transferred from dune fields of the adjacent Barrier IV, which exhibits a retrograding (transgressive) behavior in this part of the coast, as indicated by landward-dipping reflections in GPR surveys (Caron, Reference Caron2014).
The contemporaneous Lagoon III in the southern CPRS is characterized by the absence of a lagoon body, whereas in the central-northern sectors, it is occupied by the Patos Lagoon (Fig. 1B). The thickness of the back-barrier LM deposits (Fig. 3) and the overlying depositional Unit 2 in the GPR transects (Fig. 4A and B) indicate total infilling of the paleo-lagoon, thus implying high transfer of sediments to the back barrier, especially if Barrier III was narrow and without well-developed foredune ridges during the transgressive phase (Rodriguez et al., Reference Rodriguez, Theuerkauf, Ridge, VanDusen and Fegley2020). Aeolian transport and lagoon deltas built by streams draining rain-fed interdune lakes, as observed in the Holocene Barrier IV in the northern (Rosa et al., Reference Rosa, Hoyal, Barboza, Fedele, Abreu, Budd, Hajek and Purkis2016; Rocha and Rosa, Reference Rocha and Rosa2021) and southern CPRS (Fig. 7D), probably contributed to lagoon infilling. Sediment transfer could also have been influenced by increased storminess at that time, as suggested by Pleistocene coastal features in other sites pointing to extreme storm events (Hansen et al., Reference Hansen, Sato, Hearty, Ruedy, Kelley, Masson-Delmonte and Russell2016; Hearty and Neumann, Reference Hearty and Neumann2001; Hearty and Tormey, Reference Hearty and Tormey2017) or stronger swell waves (Rovere et al., Reference Rovere, Casella, Harris, Lorscheid, Nandasena, Dyer and Sandstrom2017) between MIS 5e and 5d driven by warmer ocean-surface temperatures, although such events are better represented in tropical latitudes.
High stand and regressive phases
The thick LM deposits (Fig. 3), vertically stacked subhorizontal reflections in GPR-1 (Fig. 4A), and landward-dipping reflections in GPR-2 (Fig. 4B) indicate infilling of the back-barrier lagoon and vertical aggradation of the barrier marking the transition from the transgressive to the high-stand phase. The in-place vertical growth of the barrier would have resulted from an equilibrium situation between the sediment supply and slowing of the rates of sea-level rise, which reduced the horizontal and increased the vertical component of shoreface translation (Swift, Reference Swift1975; Davis, Reference Davis and Davis1994; Morton, Reference Morton and Davis1994). In a similar way, vertical aggradation of Barrier IV in the northern CPRS is observed in deposits formed during the final stage of the Holocene marine transgression (Dillenburg et al., Reference Dillenburg, Barboza, Tomazelli, Hesp, Clerot, Zouain, Dillenburg and Hesp2009).
Slowing rates of sea-level rise during the high stand could have resulted from short-term sea-level oscillations. Some records suggest an MIS 5e high stand characterized by two peaks at 123 and 121.5 ka, separated by a small low stand at 122.5 ka, with a possible minor peak at 119.5 ka following a low stand at 120.5 ka (Hearty et al., Reference Hearty, Hollin, Neumann, O'Leary and McCulloch2007; Rohling et al., Reference Rohling, Grant, Hembleen, Siddall, Hoogakker, Bolshaw and Kucera2008). Although the stratigraphic record and ages of Barrier III do not allow us to evaluate whether it was affected by such fluctuations, these could have contributed to coastal erosion and high sediment transfer to the aggrading barrier.
The MIS 5e high stand seems to have lasted from ~127 to 114 ka (Muhs et al., Reference Muhs, Simmons, Schumann and Halley2011). No direct sea-level indicators such as sedimentary structures or ichnofossils could be identified in the boreholes, but based on the highest altitude of the back-barrier shell deposits, the maximum relative sea level (RSL) estimated in the study area was at least +6 to +7 m amsl (Fig. 3), although this could be underestimated if shells were subaerially dissolved, as observed in the outcrops (Fig. 6E). That RSL is consistent with the altitude of 7 ± 1 m amsl estimated from foreshore deposits of Barrier III in the northern CPRS (Tomazelli and Dillenburg, Reference Tomazelli and Dillenburg2007) and within the range of global sea-level estimates for the MIS 5e high stand (Hearty and Kindler, Reference Hearty and Kindler1995; Stirling et al., Reference Stirling, Esat, Lambeck and McCulloch1998; Hearty et al., Reference Hearty, Hollin, Neumann, O'Leary and McCulloch2007; Rohling et al., Reference Rohling, Grant, Hembleen, Siddall, Hoogakker, Bolshaw and Kucera2008; Kopp et al., Reference Kopp, Simons, Mitrovica, Maloof and Oppenheimer2009; Muhs et al., Reference Muhs, Simmons, Schumann and Halley2011; Dutton and Lambeck, Reference Dutton and Lambeck2012). That high stand would have flooded Mirim Lagoon, cutting the terrace T2 positioned at 5–6 m amsl on sediments accumulated on its eastern shore (Fig. 7A and B) and building the paleo-spit dated to 109.1 ± 7.7 ka (Lopes et al., Reference Lopes, Souza, Pereira, Raupp, Tatumi, Yee and Dillenburg2021).
The change from retrograding to prograding behavior of Barrier III is marked by the seaward-dipping reflections in GPR-2 (depositional Unit 3; Fig. 4B) on the seaward deposits interpreted as backshore–foreshore environments. The height and width of Barrier III in the northernmost and longest SPT line (profile 1 in Fig. 3) suggest that progradation (normal regression) may have started before the highest sea level was reached. Such diachronic behavior is observed in the modern shoreline of Rio Grande do Sul, where subtle differences in substrate slope and sediment budget between distinct coastal sectors result in prograding (regressive), aggrading (stable), and retrograding (transgressive) behaviors and variation in width along the >600-km-long Holocene Barrier IV (Dillenburg et al., Reference Dillenburg, Roy, Cowell and Tomazelli2000, 2009; Barboza et al., Reference Barboza, Rosa, Hesp, Dillenburg, Tomazelli and Ayup-Zouain2011, Reference Barboza, Rosa, Dillenburg, Watanabe, Esteves, Martins and Gruber2018; Rosa et al., Reference Rosa, Barboza, Abreu, Tomazelli and Dillenburg2017; Bittencourt et al., Reference Bittencourt, Dillenburg, Manzolli and Barboza2020).
The small lakes or swamps developed on top of the barrier body represented by the peat and organic-rich sand deposits (see Fig. 2 G and profile 1 in Fig. 3) indicate subaerial exposure marking the transition from high stand to regressive phase as a result of sea-level fall. The aeolian facies (uppermost depositional Unit 2 and Unit 4; Fig. 4A and B) extending across Barrier III and Lagoon III was likely formed of foreshore sand transferred landward by aeolian processes as transgressive dune fields. These are found in both prograding and retrograding sectors along the Barrier IV in the CPRS, and their development can be triggered by higher sea level and/or relatively drier climate (Hesp et al., Reference Hesp, Dillenburg, Barboza, Clerot, Tomazelli and Ayup-Zouain2007; Dillenburg et al., Reference Dillenburg, Barboza, Tomazelli, Hesp, Clerot, Zouain, Dillenburg and Hesp2009; Miot da Silva et al., Reference Miot da Silva, Hesp, Keim, Martinho and Ferligoj2013; Mendes et al., Reference Mendes, Giannini, Guedes, DeWitt and Andrade2015). The thickness (>2.5 m) and extent of the aeolian facies could be the result of a combination of high onshore sediment transfer by multiple sea-level oscillations and continuous aeolian processes throughout the last glacial cycle, as indicated by the OSL ages obtained at AC-01 (Fig. 6A). Transgressive aeolian pulses could have been initiated by MIS 5c and MIS 5a high stands, as suggested by OSL ages of 98.67 ± 6.73 ka from an aeolian deposit at ~8 m amsl at Cassino Beach close the estuary of Patos Lagoon (Dillenburg et al., Reference Dillenburg, Barboza, Rosa, Caron and Sawakuchi2017), and 82.3 ± 12.4 ka obtained at ~5 m amsl at AC-01 (Fig. 6A), respectively.
Post–MIS 5e sea-level oscillations
The orbitally induced climate oscillations driven by cyclic variations in Northern Hemisphere (65°N) insolation at timescales of ~21–23 ka (Milankovitch forcing) resulted in ice volume changes that have been a major control on sea-level fluctuations throughout the Quaternary (Mesolella et al., Reference Mesolella, Matthews, Broecker and Thurber1969; Shackleton and Opdyke, Reference Shackleton and Opdyke1973; Lambeck et al., Reference Lambeck, Esat and Potter2002). Mismatches of amplitude and phase relationships between sea levels and insolation, exemplified by records of high stands at suborbital timescales that do not correspond to insolation maxima during MIS 6 and 7 indicate influence of other factors or feedbacks (Lambeck et al., Reference Lambeck, Esat and Potter2002; Potter et al., Reference Potter, Esat, Schellmann, Radtke, Lambeck and McCulloch2004; Thompson and Goldstein, Reference Thompson and Goldstein2005). The available MIS 5 sea-level records indicate three high stands related to insolation peak maxima modulated by high eccentricity in agreement with the Milankovitch theory (Shackleton and Opdyke, Reference Shackleton and Opdyke1973; Lambeck et al., Reference Lambeck, Esat and Potter2002), although estimates of the timing of high sea levels inferred from insolation values and geologic/fossil records exhibit some discrepancies. Paleo-shorelines and dated corals indicate the MIS 5e high sea level correlated with the Eemian interglacial of Europe (Shackleton, Reference Shackleton1969) may have coincided with or predated the insolation peak by ~2 ka, whereas the MIS 5c and 5a high stands lag behind the respective insolation peaks by ~3 ka (Lambeck and Nakada, Reference Lambeck and Nakada1992; Gallup et al., Reference Gallup, Lawrence Edwards and Johnson1994; Stirling et al., Reference Stirling, Esat, Lambeck and McCulloch1998; Siddall et al., Reference Siddall, Chappell, Potter, Sirocko, Claussen, Sánchez Goñi and Litt2007).
The ages obtained in Barrier III indicate a seaward decrease in age related to post–MIS 5e sea-level oscillations. The deposit interpreted as foreshore–shoreface exposed on the shoreline and dated to 109 ± 7.5 ka in the central CPRS (Buchmann and Tomazelli, Reference Buchmann and Tomazelli2003) would indicate a sea level similar to the present, although the upper boundary of that deposit has not been determined. This age corresponds to the stadial MIS 5d (115.1–105.9 ka), characterized by a small low stand resulting from a rapid sea-level fall driven by cooling and ice sheet expansion after the LIG high stand (Hearty and Neumann, Reference Hearty and Neumann2001; Sherman et al., Reference Sherman, Fletcher, Rubin, Simmons and Adey2014; Cawthra et al., Reference Cawthra, Jacobs, Compton, Fisher, Karkanas and Marean2018).
If the MIS 5d RSL in the southern Brazilian coast was at or close to the present, it could indicate a less pronounced low stand than inferred from oxygen isotopes (δ18O) in benthic foraminifera, but considering the dating uncertainties, it could agree with records of eustatic sea level as high as the present until ~111 ka ago, resulting from the warm climate during the early MIS 5d (Muhs, Reference Muhs2002; Kukla et al., Reference Kukla, Bender, de Beaulieu, Bond, Broecker, Cleveringa and Gavin2002; Shackleton et al., Reference Shackleton, Chapman, Sánchez-Goñi, Pailler and Lancelot2002, Reference Shackleton, Sánchez-Goñi, Pailler and Lancelot2003; Otvos, Reference Otvos2015). On the other hand, different coastal records point to lower than present MIS 5d sea level (e.g., Dodge et al., Reference Dodge, Fairbanks, Benninger and Maurasse1983; Dumas et al., Reference Dumas, Hoang and Raffy2006; Sherman et al., Reference Sherman, Fletcher, Rubin, Simmons and Adey2014; Cawthra et al., Reference Cawthra, Jacobs, Compton, Fisher, Karkanas and Marean2018). The discrepancies between isotopic estimates of ice volumes and the sea-level records reach tens of meters, influenced by effects of deep-water temperatures on the isotopic signal (Bradley, Reference Bradley1999; Kukla et al., Reference Kukla, Bender, de Beaulieu, Bond, Broecker, Cleveringa and Gavin2002; Siddall et al., Reference Siddall, Rohling, Almogi-Labin, Hemleben, Meischner, Schmeizer and Smeed2003). The variable RSL estimated from different geologic records reflects distinct coastal morphologies, nonuniform spatial variations of the height of the geoid, or differential isostatic responses among sites located at variable distances from ice sheets, implying that the RSL does not reflect the global mean sea level (GMSL) (Potter and Lambeck, Reference Potter and Lambeck2003; Kopp et al., Reference Kopp, Simons, Mitrovica, Maloof and Oppenheimer2009; Lambeck et al., Reference Lambeck, Purcell and Dutton2012; Barlow et al., Reference Barlow, McClymont, Whitehouse, Stokes, Jamieson, Woodroffe and Bentley2018).
The lack of more detailed chronostratigraphic data does not allow us to assess whether the MIS 5d records in the CPRS represent the post–MIS 5e sea-level fall or the later (MIS 5c) positive oscillation, represented by the vertically aggrading subaqueous deposits on the seaward portion of Barrier III (Unit A in Fig. 6). The MIS 5c interstadial sea-level rise is indicated by the OSL ages of ~104 ka from AC-01, >101 ka from AC-03, ~106 ka in the northern CPRS (Table 2), and the ESR-dated shells of ~101–100 ka from the borehole G10A08 and Passo da Lagoa (Fig. 2G, Table 1). The MIS 5c high stand apparently reached a smaller amplitude (~4 and ~5.1 m amsl in the southern and in the northern CPRS, respectively) compared with the estimated MIS 5e RSL of +6 to +7 m (Tomazelli and Dillenburg, Reference Tomazelli and Dillenburg2007; Fig. 3).
The transition from the cold stadial MIS 5d to the warm interstadial MIS 5c was rapid and characterized by reduction of ice volumes and increased sea level (Potter and Lambeck, Reference Potter and Lambeck2003). Numerical modeling estimates a global mean sea level of about −9.4 m relative to the present during MIS 5c (Creveling et al., Reference Creveling, Mitrovica, Clark, Waelbroeck and Pico2017), supported by variable estimates from isotopic (Chappel and Shackleton, Reference Chappel and Shackleton1986), fossil, and geologic records (Szabo, Reference Szabo1985; Cutler et al., Reference Cutler, Edwards, Taylor, Cheng, Adkins, Gallup, Cutler, Burr and Bloom2003; Potter et al., Reference Potter, Esat, Schellmann, Radtke, Lambeck and McCulloch2004; Schellmann et al., Reference Schellmann, Radtke, Potter, Esat and McCulloch2004; Radtke and Schellmann, Reference Radtke and Schellmann2005; Parham et al., Reference Parham, Riggs, Culver, Mallinson and Wehmiller2007; Gzam et al., Reference Gzam, El Medjoub and Jedoui2016). Other records, however, indicate an MIS 5c sea level above the present (Fig. 8), including +4 m in South Africa (Ramsay and Cooper, Reference Ramsay and Cooper2002), +2 to +5 m in Grand Cayman (Coyne et al., Reference Coyne, Jones and Ford2007), +1 m in Sardinia (Sechi et al., Reference Sechi, Andreucci and Pascucci2013), and +1.5 m in Bermuda (Wainer et al., Reference Wainer, Rowe, Thomas, Mason, Williams, Tamisiea, Williams, Düsterhaus and Henderson2017).

Figure 8. (A) Paleo–sea level estimated from the dated samples of Barrier III compared with MIS 5 sea levels estimated from deep-sea δ18O (black line) and the standard deviation (gray line) (Spratt and Lisiecki, Reference Spratt and Lisiecki2016). (B) Dated post–MIS 5e sea levels estimated from coastal deposits worldwide, the vertical bars indicate maximum and minimum values, and the black diamonds indicate point estimates. The gray areas show the range of global mean sea-level (GMSL) estimates for MIS 5c and 5a (Creveling et al., Reference Creveling, Mitrovica, Clark, Waelbroeck and Pico2017). (a) Dumas et al., Reference Dumas, Hoang and Raffy2006; (b) Potter et al., Reference Potter, Esat, Schellmann, Radtke, Lambeck and McCulloch2004; (c) Wainer et al., Reference Wainer, Rowe, Thomas, Mason, Williams, Tamisiea, Williams, Düsterhaus and Henderson2017; (d) Wenmiller et al., Reference Wenmiller, Simmons, Cheng, Edwards, Martin-McNaughton, York, Krantz and Shen2004; (e) Hearty and Kindler, Reference Hearty and Kindler1995; (f) Muhs et al., Reference Muhs, Simmons, Schumann and Halley2011; (g) Dodge et al., Reference Dodge, Fairbanks, Benninger and Maurasse1983; (h) Ludwig et al., Reference Ludwig, Muhs, Simmons, Halley and Shinn1996; (i) Hearty, Reference Hearty2002; (j) Coyne et al., Reference Coyne, Jones and Ford2007; (k) Ramsay and Cooper, Reference Ramsay and Cooper2002; (l) Harmon et al., Reference Harmon, Mitterer, Kriausakul, Land, Schwarcz, Garrett, Larson, Vacher and Rowe1983; (m) Sechi et al., Reference Sechi, Andreucci and Pascucci2013; (n) Blakemore et al., Reference Blakemore, Murray-Wallace and Lachlan2014; (o) Murray-Wallace et al., Reference Murray-Wallace, Brooke, Cann, Belpeio and Bourman2001.
The age of 87 ± 5 ka from the youngest shell from a depth between −2 and −7 m below the present sea level in the borehole G10A08 corresponds to the stadial MIS 5b (92.8−84.7 ka). The other dated shells from that borehole include two with identical ages of 101 ± 7.7 ka (MIS 5c) and others with ages from 112 to 108 ka (MIS 5d). This mixing of shells suggests a sea-level rise during the interstadial MIS 5a (84.7−71 ka) that reworked MIS 5c deposits. This rise would have been the result of melting of the Laurentide Ice Sheet (Muhs et al., Reference Muhs, Simmons and Steinke2002) and characterized in some sites by two suborbital high-stand peaks at ~85−82 ka and ~77 ka (Muhs et al., Reference Muhs, Wehmiller, Simmons, York, Gillespie, Porter and Atwater2003; Potter et al., Reference Potter, Esat, Schellmann, Radtke, Lambeck and McCulloch2004, Schellmann et al., Reference Schellmann, Radtke, Potter, Esat and McCulloch2004; Dumas et al., Reference Dumas, Hoang and Raffy2006; Wainer et al., Reference Wainer, Rowe, Thomas, Mason, Williams, Tamisiea, Williams, Düsterhaus and Henderson2017). Different geologic records in uplifted or subsided sites (Fig. 8) indicate lower than present sea levels, as in Haiti (−10 to −11 m; Dodge et al., Reference Dodge, Fairbanks, Benninger and Maurasse1983; Dumas et al., Reference Dumas, Hoang and Raffy2006), some areas of the U.S. Atlantic coast (Potter and Lambeck, Reference Potter and Lambeck2003; Parham et al., Reference Parham, Riggs, Culver, Mallinson and Wehmiller2007), Barbados (−19 to −18 m; Potter et al., Reference Potter, Esat, Schellmann, Radtke, Lambeck and McCulloch2004), and the Gulf of Mexico (−11 m; Simms et al., Reference Simms, DeWitt, Rodriguez, Lambeck and Anderson2009). On the other hand, sites in tectonically stable areas indicate sea levels close to or above the present (Fig. 8), such as Bermuda (−1 to +2 m; Harmon et al., Reference Harmon, Mitterer, Kriausakul, Land, Schwarcz, Garrett, Larson, Vacher and Rowe1983; Hearty and Kindler, Reference Hearty and Kindler1995; Ludwig et al., Reference Ludwig, Muhs, Simmons, Halley and Shinn1996; Wainer et al., Reference Wainer, Rowe, Thomas, Mason, Williams, Tamisiea, Williams, Düsterhaus and Henderson2017), the U.S. Atlantic coastal plain (Szabo, Reference Szabo1985), Grand Cayman (+3m; Coyne et al., Reference Coyne, Jones and Ford2007) and Mallorca (+1 m; Doralle et al., Reference Doralle, Onac, Fornós, Ginés, Ginés, Tuccimei and Peate2010).
Considering these multiple records, the ~87 ka shell could indicate deposition by an MIS 5a transgression that reached a lower RSL compared with MIS 5e and 5c. As this hypothesis is based on only one ESR age, and the possibility of diagenetic alteration of this specimen is not discarded (Lopes et al., Reference Lopes, Pereira, Kinoshita, Mollemberg, Barbosa and Baffa2020), it must be taken with caution. If this was the case, the deposit could represent the MIS 5c high stand, as indicated by the associated shells dated at ~101 ka. Nevertheless, the luminescence ages of ~82 ka in the aeolian sediments overlying marine and backshore deposits at AC-01 (Fig. 6, Table 2) and ~85 ka in the northern CPRS (Poupeau et al., Reference Poupeau, Soliani, Rivera, Loss and Vasconcellos1988) seem consistent with increased onshore sand supply available for aeolian redistribution triggered by an MIS 5a sea-level rise (Porat and Botha, Reference Porat and Botha2008; Bateman et al., Reference Bateman, Carr, Dunajko, Holmes, Roberts, McLaren and Bryant2011; Tamura et al., Reference Tamura, Kodama, Bateman, Saitoh, Watanabe, Matsumoto and Yamaguchi2011; Galiforni-Silva et al., Reference Galiforni-Silva, Wijnberg and Hulscher2020).
Correlation with other records along the Brazilian coast
Other MIS 5 sea-level records on the eastern coast of South America include deposits along the uplifted coast of Argentina dated to MIS 5e, although estimated from minimum radiocarbon ages (Gowan et al., Reference Gowan, Rovere, Ryan, Richiano, Montes, Pappalardo and Aguirre2021). Similarly, shell-rich deposits at 0.5 to 1 m amsl exposed on the shore at La Coronilla in Uruguay are correlated to MIS 5e based on 14C ages regarded as minimum values (Rojas and Martínez, Reference Rojas, Martínez, Gasparini, Rabassa, Deschamps and Tonni2016). Two OSL ages consistent with MIS 5a were obtained in shell-rich deposits on the upper estuarine zone of the La Plata River (Fig. 9) in the localities of Zagarzazú (88.355 ± 7.07 ka) at an altitude of 0.5 to 1 m amsl and Nueva Palmira (80.680 ± 5.5 ka) at 12.5 ± 2.8 m amsl (Rojas and Martínez, Reference Rojas, Martínez, Gasparini, Rabassa, Deschamps and Tonni2016).

Figure 9. Blue Marble image of the Uruguayan (Uy) and Brazilian coasts with the location of the dated MIS 5 records (white circles) shown on the right, compared with the relative sea-level curve of Spratt and Lisiecki (Reference Spratt and Lisiecki2016): (a) Zagarzazú and Nueva Palmira (Rojas and Martínez, Reference Rojas, Martínez, Gasparini, Rabassa, Deschamps and Tonni2016), (b and c1) southern Coastal Plain of the state of Rio Grande do Sul (CPRS) (Lopes et al. [2020] and this paper, respectively), (d) Cassino Beach (Dillenburg et al., Reference Dillenburg, Barboza, Rosa, Caron and Sawakuchi2017), (e) central CPRS (Buchmann and Tomazelli, Reference Buchmann and Tomazelli2003), (f and c2) northern CPRS (Poupeau et al. [1988] and this paper, respectively), (g) Santa Catarina (Giannini et al., Reference Giannini, Sawakuchi, Martinho and Tatumi2007), (h) Paraná (Barreto et al., Reference Barreto, Angulo, Tatumi, Watanabe and Ayta1999a), (i and j) São Paulo (Watanabe et al. [2003] and Suguio et al. [2003], respectively), (k) Bahia (Martin et al., Reference Martin, Bittencourt and Vilas-Boas1982), (l) Pernambuco and Paraiba (Suguio et al., Reference Suguio, Bezerra and Barreto2011), (m and n) Rio Grande do Norte (Barreto et al. [1999b] and Barreto et al. [2002], respectively), (o) Amapá (Bezerra et al., Reference Bezerra, Nogueira, Guimarães and Truckenbrodt2015). Insolation and eccentricity at 65°N according to the LR04 orbital solution (Laskar et al., Reference Laskar, Robutel, Joutel, Gastineau, Correia and Levrard2004).
The first MIS 5 dated records from the Brazilian coast were coral specimens from a reef located at 2.5–3 m amsl in Olivença (Bahia State; Fig. 9) U/Th dated to MIS 6 and MIS 5e, the latter being represented by three specimens with ages of 124 ± 8.7, 122 ± 6.1, and 116 ± 6.9 ka, with a mean age of 123.5 ± 5.7 ka (Martin et al., Reference Martin, Bittencourt and Vilas-Boas1982). Other luminescence-dated marine terraces of the Cananeia Formation in southeastern Brazil yielded ages of 122 ± 4.5 to 85.78 ± 9.8 ka (Barreto et al., Reference Barreto, Angulo, Tatumi, Watanabe and Ayta1999a) and 84.8 ± 1.8 to 78.3 ± 7.2 ka (Suguio et al., Reference Suguio, Tatumi, Kowata, Munita and Paiva2003). In the northeastern Brazilian coast, ages of 117 ± 4 and 110 ± 10 ka (Barreto et al., Reference Barreto, Bezerra, Suguio, Tatumi, Yee, Paiva and Munita2002) and 120 ± 2 to 86 ± 5 ka (Suguio et al., Reference Suguio, Bezerra and Barreto2011) were obtained in terraces of the Touros Formation. On the northern Brazilian coast, tidal deposits of the Itaubal Formation at the mouth of the Amazon River yielded ages between 120.6 ± 12 and 70.85 ± 6.7 ka (Bezerra et al., Reference Bezerra, Nogueira, Guimarães and Truckenbrodt2015). Although aeolian deposits are not direct sea-level indicators, the development of several coastal dune fields seem to have been initiated by MIS 5e to 5a positive sea-level fluctuations, as indicated by luminescence-dated dunes with ages of 129.1 ± 15 to 92.6 ± 11 ka (Giannini et al., Reference Giannini, Sawakuchi, Martinho and Tatumi2007), 125 ± 15 to 79 ± 10 ka (Watanabe et al., Reference Watanabe, Tatumi, Suguio, Munita and Paiva2003), and 110 ± 5 and 109 ± 7 ka (Barreto et al., Reference Barreto, Tatumi, Suguio, Oliveira, Ayta and Watanabe1999b; Fig. 9).
Different deposits found at elevations several meters above the present sea level along the Brazilian coast, representing the Cananeia (Suguio and Martin, Reference Suguio and Martin1978) or Penultimate (Bittencourt et al., Reference Bittencourt, Martin, Vilas Boas and Flexor1979) Transgression, had been traditionally assigned to LIG/MIS 5e (e.g., Suguio et al., Reference Suguio, Martin, Bittencourt, Dominguez, Flexor and Azevedo1985) through correlation with the dated corals from Bahia State (Martin et al., Reference Martin, Bittencourt and Vilas-Boas1982; Fig. 8). The more recent dates cited above agree with that estimate, but also indicate the presence of younger deposits correlated to the substages MIS 5d to 5a, thus consistent with the ages obtained in Barrier III and other deposits worldwide (Figs. 8 and 9). Although most of the deposits along the Brazilian coast do not have precise altimetric measurements or seem to have been affected by neotectonics (e.g., Barreto et al., Reference Barreto, Bezerra, Suguio, Tatumi, Yee, Paiva and Munita2002), which makes it difficult to establish a precise MIS 5 sea-level curve, the available ages indicate that the Cananeia/Penultimate/Transgression III transgressive event was more complex than inferred from geomorphology alone, but agrees with the predicted orbitally forced sea-level oscillations recognized globally.
The results presented here indicate Barrier III is a complex structure that prograded seaward through juxtaposition of transgressive deposits (Fig. 10A) produced by the successive MIS 5 high stands driven by high insolation and eccentricity (Fig. 9). The correspondence of the studied deposits with other records worldwide (Figs. 8 and 9) point to large-scale allogenic forcing (i.e., sea-level change) as the main driving process controlling the development and evolution of Barrier III. The lack of additional outcrops available for study, however, makes it difficult to evaluate the influence of autogenic (local processes) forcings, although these may have played a significant role on the evolution of that unit, as suggested by variations of shoreline behavior observed along the Holocene Barrier IV (Dillenburg et al., Reference Dillenburg, Roy, Cowell and Tomazelli2000; Rosa et al., Reference Rosa, Barboza, Abreu, Tomazelli and Dillenburg2017).
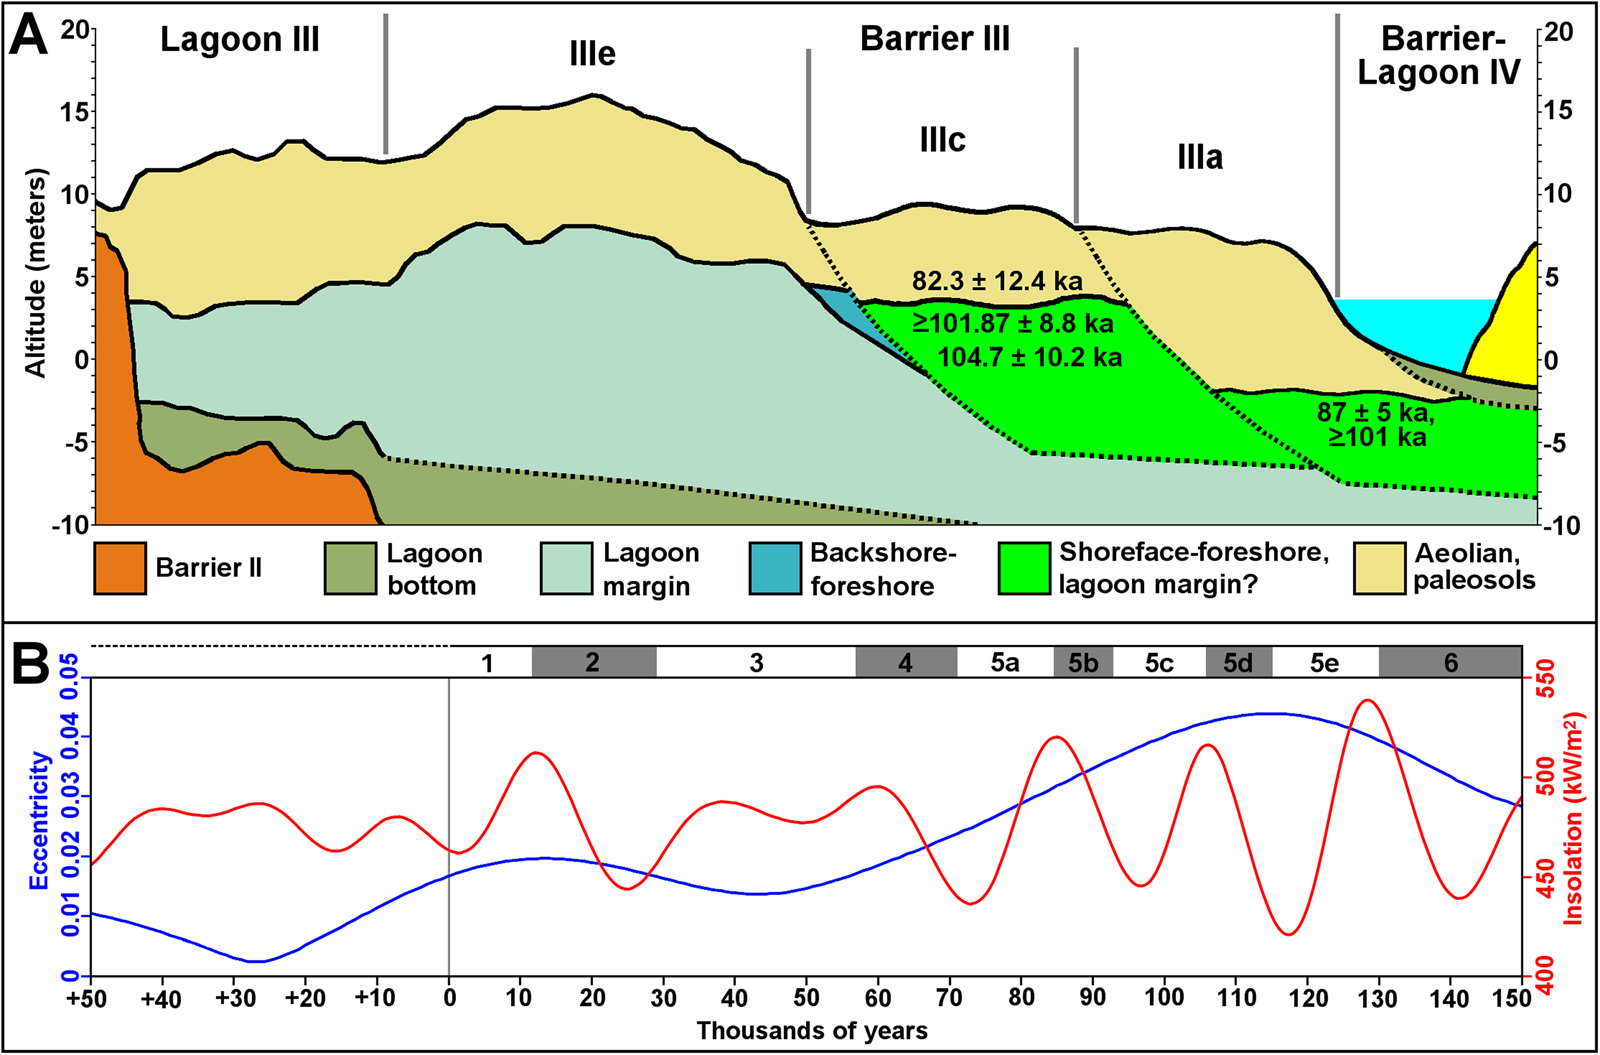
Figure 10. (A) Conceptual model of the structure of Barrier III considering three Marine Isotope Stage (MIS) 5 high stands, with the positions of MIS 5c and 5a samples indicated. Dashed lines show uncertain contacts (the true width of systems IIIc and IIIa are unknown). (B) Variations of summer insolation and eccentricity at 65°N from the last 150 ka up to the next 50 ka (from Laskar et al., Reference Laskar, Robutel, Joutel, Gastineau, Correia and Levrard2004).
Although the obtained data suggest the presence of possibly three subunits of Barrier III, hence designated as IIIe, IIIc, and IIIa (Fig. 10A), the juxtaposition of the deposits does not allow us to resolve the degree of erosion and overlapping and the contact relationships between the subunits. Nevertheless, the OSL ages >128 ka obtained in the MIS 5c unit (Barrier IIIc) at AC-02 indicate sediments eroded from preexisting MIS 6 and MIS 5e deposits. The relative abundance in the putative subsurface MIS 5a deposit (Barrier IIIa) of estuarine bivalves A. flexuosa and E. mactroides, an association characteristic of lagoon settings in the CPRS (Bettinelli et al., Reference Bettinelli, Dillenburg, Lopes and Caron2018; Lopes et al., Reference Lopes, Ritter, Barboza, Rosa, Dillenburg and Caron2022) on the seaward side of the barrier, suggests erosion of a lagoon deposit from the MIS 5c subunit by a sea-level oscillation, indicated by the marine shells with ages >101 ka (Fig. 9).
The two (possibly three) MIS 5 high-stand deposits represented in Barrier III agree with the global records cited earlier, which show significant variability between estimated past sea levels (Fig. 8). The relative stability of Holocene sea level compared with the previous interglacials MIS 5 and 7 probably results from the low amplitude of the precession-driven insolation owing to the low eccentricity (Thompson and Goldstain, Reference Thompson and Goldstein2005). Considering the orbitally driven sea-level MIS 5 oscillations as a basis for comparison, the current lower insolation and eccentricity, which will remain so for tens of thousands of years (Fig. 10B), imply that orbital forcing may not be a significant factor on projections of sea-level rise in the near future.
CONCLUSIONS
The stratigraphy and ages of the MIS 5 Barrier III/Chuy Formation of the southern Brazilian coast indicate a more complex structure and evolution than previously inferred. This complexity is related to the multiple sea-level fluctuations during MIS 5, characterized by three orbitally forced high stands in agreement with the Milankovitch theory. The presence of deposits correlated to the globally recognized MIS 5e high stand of ~125 ka is deduced indirectly from facies successions and altitude of shelly deposits, whereas the MIS 5c high stand of ~101 ka is better defined by stratigraphy with associated luminescence and ESR ages. A younger (MIS 5a) high stand is suggested by one age of ~87 ka of one ESR-dated shell and correlated aeolian deposits. The main problem in evaluating the structure of Barrier III in detail results from the partial reworking, amalgamation, and superposition of deposits formed by the successive depositional sequences driven by sea-level fluctuations. Nevertheless, the subdivisions of Barrier III correspond to coastal deposits of similar age along the Brazilian coast and worldwide, indicating an allogenic control on its evolution, possibly influenced by small-scale autogenic processes as well.
Supplementary material
The supplementary material for this article can be found at https://doi.org/10.1017/qua.2023.67.
Acknowledgments
The authors thank the reviewers and editors for their corrections and suggestions. This study was funded through postdoctoral grant no. 150153/2014-7 provided by the National Council for Scientific and Technological Development (CNPq) to RPL. The authors declare no competing interests.


