


It has been now well established that there are five basic taste modalities: sweet, sour, bitter, salty and umami. Nevertheless, a growing number of studies have stressed the existence of a sixth taste modality – that is taste of fat( Reference Besnard, Passilly-degrace and Khan 1 ). Dietary lipids represent an important source of energy. However, if consumed in large quantity, dietary fat may lead to different health complications such as obesity, the metabolic syndrome, cancer, type 2 diabetes mellitus (T2DM)( Reference Garduno-Diaz and Khokhar 2 ) and Alzheimer’s disease( Reference Hanson, Bayer-Carter and Green 3 , Reference Šerý, Povová and Míšek 4 ). As far as the incidence of obesity is concerned, the Czech Republic ranks at the fourth place in Europe( Reference Spilková 5 ).
The oro-sensory perception of dietary lipids is principally mediated by two receptors, GPR120 and CD36, in humans( Reference Ichimura, Hirasawa and Poulain-Godefroy 6 , Reference Laugerette, Passilly-Degrace and Patris 7 ). CD36 exhibits high affinity for long-chain fatty acids (LCFA), whereas GPR120 is a low-affinity receptor( Reference Ozdener, Subramaniam and Sundaresan 8 ). Consequently, genetic variations in CD36 have been shown to influence oral lipid perception. The first study that was focused on the implication of CD36 SNP in oral fat sensitivity showed that human participants with the AA genotype of the rs1761667 polymorphism exhibited a higher detection threshold for LCFA compared with subjects with the GG genotype( Reference Pepino, Love-Gregory and Klein 9 ). Since this pioneer work, a number of studies have reported similar results in African-American( Reference Keller, Liang and Sakimura 10 ), Tunisian( Reference Mrizak, Šerý and Plesnik 11 ), Algerian( Reference Sayed, Šerý and Plesnik 12 ) and Italian( Reference Melis, Sollai and Muroni 13 ) populations.
Besides the rs1761667 SNP, other CD36 SNP such as rs1527483 and rs3212018 are also interesting by the point of view of obesity. Bokor et al. ( Reference Bokor, Legry and Meirhaeghe 14 ) have reported the relationship between the rs1527483 polymorphism (25 444 C>T) and obesity, high BMI and percentage of body fat (BF%). This SNP is also implicated in high NEFA plasma levels in Caucasians subjects( Reference Ma, Bacci and Mlynarski 15 ). Another study conducted on African-American subjects showed, for the first time, a possible role of the rs1527483 polymorphism in dietary lipids oral perception( Reference Keller, Liang and Sakimura 10 ), although a later study did not confirm this finding( Reference Melis, Sollai and Muroni 13 ). As regards the rs3212018 polymorphism, Keller et al. have reported that this CD36 polymorphism was associated with BMI and waist circumference (WC) in African-American participants. Moreover, Gautam et al.( Reference Gautam, Agrawal and Banerjee 16 ) studied the association of rs3212018 with T2DM in an Indian population.
The primary aim of our study was to determine whether two common CD36 polymorphisms, rs1527483 and rs3212018, play a role in the modulation of oral fatty acid perception and adiposity in young Czech adult participants. Second, we studied the relationship between food preferences, CD36 genotype and anthropometric parameters. Finally, we performed DNA sequencing of exons 5 and 6 encoding hydrophobic pocket of CD36( Reference Kuda, Pietka and Demianova 17 ) in order to find out any additional polymorphisms/mutations related to oral sensitivity of dietary lipids.
Methods
Participants
In all, 116 young adult Caucasian participants (forty-three male and seventy-three female, age 21·8 (sem 0·28) years) were recruited in this study. To avoid any influence of age on taste perception( Reference Mojet, Christ-Hazelhof and Heidema 18 ), the subjects belonged to the same age group. We recruited lean and obese subjects. The participants did not follow any energy or dietary restriction regimen (such as veganism or gluten-free diet). Other exclusion criteria were as follows: significant weight loss in the past 3 months, any medication known to affect appetite, sudden taste loss, regular smoking (more than one packet per week), pregnancy and lactation and medical conditions such as hypertension or diabetes. Before the recruitment for the study, the participants were informed about the aim of the study and the procedures they would undergo. Each person approved and signed a written informed consent. The study was approved by the Ethical Committee of the Masaryk University in Brno.
Anthropometrics
The parameters were measured without shoes and in light clothing. Body weight was measured with an electronic weight scale with an accuracy of 100 g. Height was measured using a measuring tape with an accuracy of 0·1 cm. Waist and hip circumferences were measured in standing position on the narrowest diameter between xiphoid process and the iliac crest and at the widest part over the greater trochanters, respectively. The circumferences were measured to an accuracy of 0·1 cm. From obtained measurements, we determined the following parameters: BMI (BMI=weight/height2, kg/m2), waist:hip ratio (WHR=WC/hips circumference, cm/cm) and waist:height ratio (WHtR=WC/height, cm/cm).
Questionnaires
To observe the craving for dietary lipids, a modification of validated self-administered questionnaire Food Craving Inventory (FCI)( Reference White, Whisenhunt and Williamson 19 ) was used. The FCI is a questionnaire composed of thirty-seven items and is designed to measure the frequency of cravings for specific food. The food items were divided into four groups: high fats, sweets, carbohydrates/starches and fast-food fats. The participants then rated, from scale 1 ‘never’ to 5 ‘always/almost every day’, how often they craved for each item during the last month of the study. In our study, we were focused only on dietary lipids, and thus we used only the food items that were categorised as ‘high fat’ and ‘fast-food fat’. The ‘fatty’ food items are very similar in both American and Czech diets, and thus we removed only one item from the ‘high-fat’ group – that is ‘maize bread’, which is very uncommon in the Czech diet. Because we used only the lipid-rich food items, we did not perform the same computation as in the original paper. Hence, we calculated the mean craving for each food group and also for both the groups together.
The participants were also asked whether they consumed alcoholic beverages and what was their average consumption per week. On the basis of their answers, we calculated the quantity of consumed alcohol as alcohol units per week.
Oral linoleic acid detection thresholds
Linoleic acid (LA) detection thresholds were determined according to alternative forced choice method( Reference Chalé-Rush, Burgess and Mattes 20 ), using ascending concentration of LA (i.e. 0·018, 0·18, 0·37, 0·75, 1·5, 3, 6 and 12 mmol/l) in deionised water containing Arabic gum (5 %, w/v) and EDTA (0·01 %, w/v). Control samples contained only Arabic gum (5 %, w/v) and EDTA (0·01 %, w/v). All chemicals were purchased from Sigma-Aldrich. The emulsion was homogenised using sonication probe MS 72 (Bandelin). The samples were diluted and immediately used or stored at 4°C in the absence of light. To prevent oxidation, the samples were stored in oxygen-free atmosphere (pure N2). The samples were used within 48 h.
The day before the tasting session, the participants were instructed to avoid smoking and consumption of alcoholic beverages and hot spicy meals (such as chilli, garlic or horseradish). On the tasting day, the participants were suggested to come early in the morning without taking breakfast (fasting state).
During the tasting session, the participants were subjected to a set of three solutions. Each set contained two control samples and one sample with LA. The subjects were instructed that in each set there is only one odd sample, and they were unknown to the nature of the tested molecule (such as oily or bitter). The participants kept each sample in their mouths for a few seconds. They were not allowed to drink the solution; rather, they had to spit it out. The participants were asked to rinse their mouth with deionised water between each concentration used. To mask visual and olfactory cues, participants wore a nose clip and a blindfold. After each set, the participants were asked to identify the odd samples containing LA. When an incorrect response was given, we increased the LA concentration. The procedure was terminated when the subject correctly identified the solution containing the LA three times.
CD36 polymorphisms genotyping
Genomic DNA was isolated from buccal swabs using DNA extraction system Prepito (PerkinElmer) based on paramagnetic particles separation. The isolated DNA was used to determine genotypes of two CD36 gene polymorphisms: rs1527483, which encodes C/T substitution, and rs3212018, which encodes 16-bp deletion. We used restriction fragment length polymorphism method using Taq thermostable DNA polymerase (Kapa Biosystems). To genotype rs1527483, a 235-bp fragment was amplified using forward 5'-GCCAATTAGAATCACTTCATAAACC-3' and reverse 5'-TGATGGATTAAACCCAAATGAA-3' primers. PCR primers for rs3212018 were as follows: forward 5'-TCTGGGAGAAATGAGATAAAAGATG-3' and reverse 5'-GCAGCAATCCTGGTCTTATG-3', with a 182-bp PCR product. Both polymorphisms were amplified by the same protocol using annealing temperature at 56 °C.
For the rs1527483 polymorphism, a 236-bp product was digested by TaqI restriction enzyme (Thermo Fisher Scientific). The fragments were as follows: 107 and 129 bp (T-allele) and 37, 70 and 129 bp (C-allele). Regarding the rs3212018 polymorphism, the PCR product had one fragment of 182 bp in case of wild type (insertion), and in case of deletion one 166-bp product was observed. The PCR products from the both polymorphisms were separated by 2 % (w/v) agarose gel, stained with ethidium bromide.
CD36 sequencing
We sequenced exons 5 and 6, which encode hydrophobic pocket, a part of extracellular domain of CD36 that is responsible for fatty acid binding( Reference Kuda, Pietka and Demianova 17 ). These exons encode amino acids 95–143 (exon 5) and 144–203 (exon 6). Out of our study group, we selected subjects who were absolutely unable (no correct response in the taste test) to detect LA (n 4) and the same number of subjects with lowest detection threshold for LA (supertaster). First, we amplified selected regions using standard PCR. Sequences of used primers and temperatures profile are displayed in the Table 1. The 5' end of the forward primers started 31 bp and 122 bp before exon 5 and 6, respectively, and the 5' end of the reverse primers started 110 and 170 bp behind exons 5 and 6, respectively. The PCR product was then purified using Shrimp Alkaline Phosphatase and Exonuclease I (Thermo Fisher Scientific). The mixtures were incubated at 37 °C for 15 min and 85 °C for 15 min to inactivate the enzymes, followed by sequencing with BigDye® Terminator version 3.1 (Thermo Fisher Scientific) with the forward PCR primers as sequencing primers. The amplicons were then purified using EDTA/ethanol precipitation, resuspended in 10 μl of Hi-Di Formamide (Thermo Fisher Scientific) and sequenced on an automated ABI 3130 Genetic Analyzer (Thermo Fisher Scientific). The resulting sequences were analysed in MEGA 7 software( Reference Kumar, Stecher and Tamura 21 ) and NC_000007.14 sequence from Nucleotide NCBI database was used for alignment.
Table 1 Sequences of the primers and the temperature profile used for sequencing of CD36 exons 5 and 6
Data analyses
Statistical analyses were conducted using Statistica 12 software (StatSoft) and the data are presented as means with their standard errors. According to the Shapiro–Wilk test, most parameters were found to be non-normally distributed, and thus non-parametric tests were used in each test. To compare two variables, the Mann–Whitney U test was used; in the case of three variables, Kruskal–Wallis ANOVA was used. For correlation between various parameters, Spearman’s rank correlation was performed. The two-tailed Fisher’s exact test was used for comparison of allelic frequencies. Hardy–Weinberg equilibrium was tested by the χ 2 test. P values ≤0·05 were considered statistically significant.
Results
Subjects descriptive statistics
On the basis of BMI, we observed twelve obese participants with BMI>30 kg/m2 in our study. Out of the twelve obese subjects, six were male and six were female. Table 2 shows the anthropometric parameters. We noticed higher BMI, WHR, WHtR and WC in the male group compared with the female group. As expected, we observed a strong positive association for all four measured parameters (R>0·32, P<0·01). The average age of the participants was 21·84 (sem 0·22) years.
Table 2 Characteristics of the study groupFootnote * (Mean values with their standard errors)
WC, waist circumference; WHR, waist:hip ratio; WHtR, waist:height ratio.
* The P values were obtained by using the Mann–Whitney U test
Questionnaires
We noticed a positive relationship between all anthropometric parameters and craving for ‘high-fat’ food items. The participants who tend to have more frequent craving for fatty food had larger BMI, WC, WHR and WHtR (P values, respectively, 0·026, 0·007, 0·011 and 0·044). In addition, LA detection threshold was high in subjects who often craved for ‘high-fat’ food items (P=0·033). The ‘fast-food fat’ items did not, however, associate with any one of the parameters. Interestingly, the consumption of alcohol is associated with ‘fast-food fat’ items. The subjects who consumed more alcohol exhibited more frequent craving for ‘fast-food fat’ food items (P=0·021). The obese participants reported more frequent craving for lipids items than controls; nonetheless, the difference was statistically marginal (P=0·05). The list of food items and exact P values are displayed in Table 3.
Table 3 Correlations between Food Craving Inventory (FCI) food item groups and measured adiposity parameters, linoleic acid detection threshold and weekly alcohol consumption in the participants (n 116)Footnote *
WC, waist circumference; WHR, waist:hip ratio; WHtR, waist:height ratio; WAC, weekly alcohol consumption.
* The results are summarised using R coefficient with corresponding P value (Spearman’s rank correlation). The composition of the food item groups is as follows: fast-food fat (hamburger, French fries, chips, pizza) and high fat (fried chicken, sausage, gravy, fried fish, bacon, hot dog, steak).
Linoleic acid sensitivity
Out of 116 subjects, eleven subjects were classified as non-tasters who failed to detect LA even at the highest concentration of the fatty acid used in the study. We observed a positive correlation between LA detection threshold and all the parameters – for example, BMI, WC, WHR and WHtR (Fig. 1, P values 0·047, 0·004, 0·016, 0·025, respectively). The male subjects had almost 3-fold-higher detection threshold (lower sensitivity) than the female participants (P=0·003). We did not observe any difference in the detection threshold between obese and lean participants. However, LA oral detection threshold correlated with the craving for ‘high-fat’ food items (P=0·033) but not with ‘fast-food fat’ items according to the FCI questionnaire (Table 3).
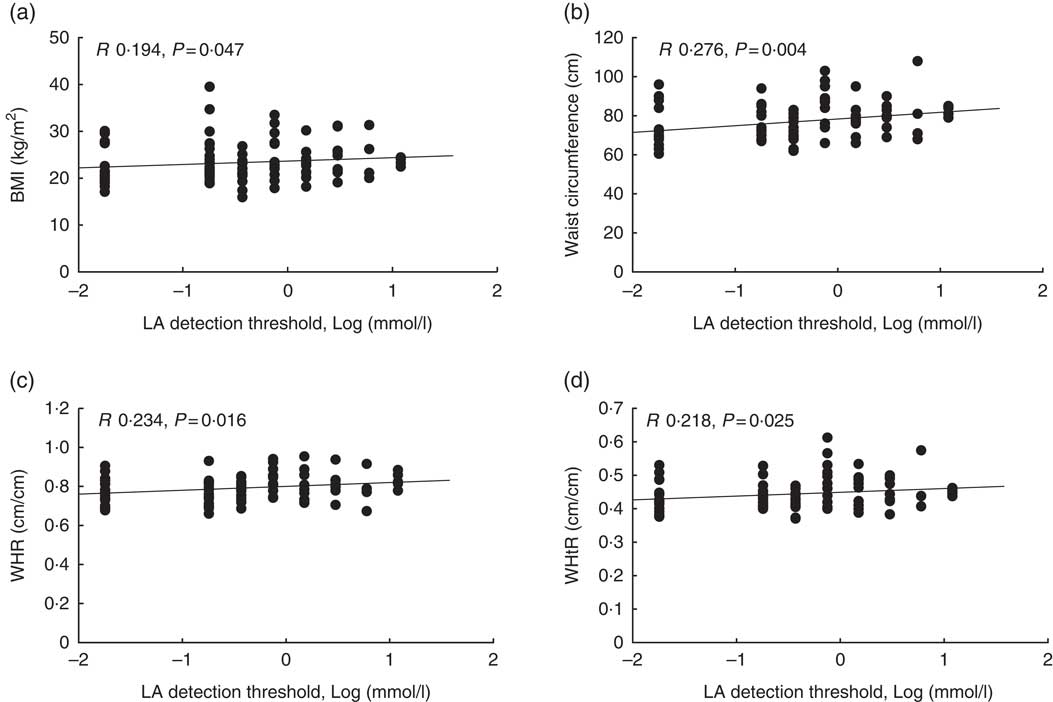
Fig. 1 Correlation between adiposity parameters and linoleic acid (LA) detection threshold (n 116). We observed a positive correlation between LA acid detection threshold and BMI (a), waist circumference (b), waist:hip ratio (WHR) (c) and waist:height ratio (WHtR) (d). The R and P values were obtained using Spearman’s rank correlation.
Genetic analyses
The studied polymorphisms did not deviate from Hardy–Weinberg equilibrium. We obtained χ 2 values of 1·40 (P=0·24) and 0·00 (P=1) for rs1527483 and rs3212018, respectively. To maximise the number of subjects in each group, we combined into one group the subjects with minor homozygous genotypes and those with heterozygous genotypes (e.g. TT + CC for rs1527483 and DD + ID for rs3212018). The genotype and allelic frequencies are shown in Table 4. The CT/TT genotypes (P=0·007) and T-allele (P=0·004) were more frequent in the obese group. The participants with CT/TT genotypes had higher BMI, WC and WHtR than the participants with the CC genotype (P values were 0·011, 0·005 and 0·010, respectively). Nonetheless, the difference in WHR was only marginally non-significant (P=0·077) (Fig. 2). We also noticed that subjects with CT/TT genotypes were less sensitive to LA (higher threshold) than participants with the CC genotype (P=0·037, Fig. 3). We did not observe any significant association between rs3212018 and the measured parameters.
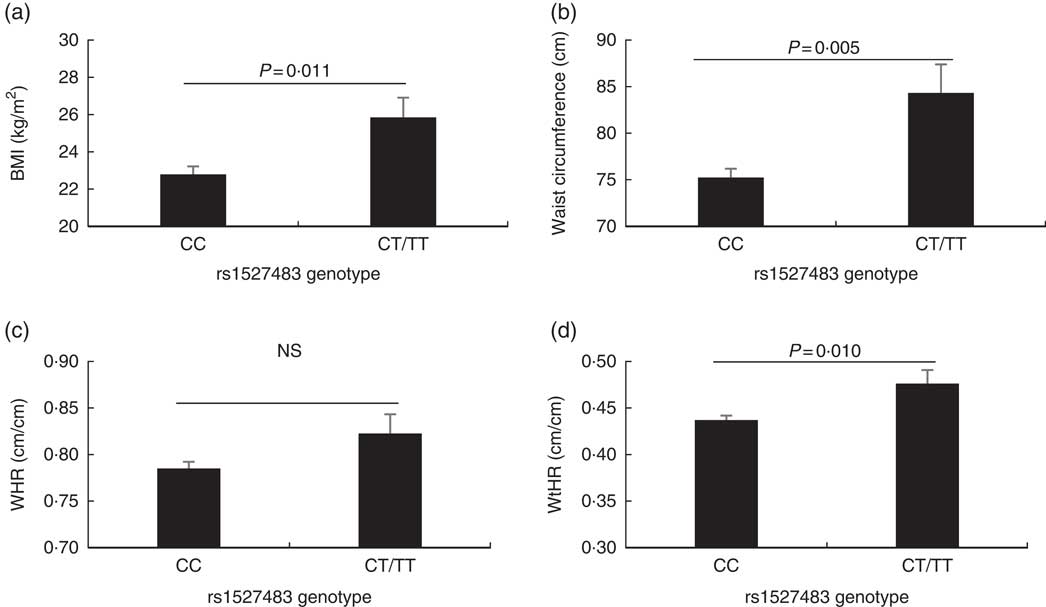
Fig. 2 Association between measured adiposity parameters and the CD36 rs1527483 genotype. The participants with CT or TT genotypes (n 19) had significantly larger BMI (a), waist circumference (b) and waist:height ratio (WHtR) (d), but not WHR (c), than subjects with the CC genotype (n 97). P values were obtained using the Mann–Whitney U test. Values are means, with their standard errors represented by vertical bars.
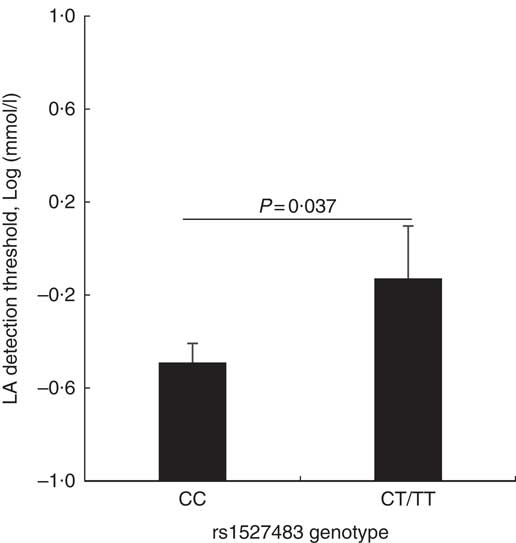
Fig. 3 Relationship between the CD36 rs1527483 genotype and linoleic acid (LA) detection threshold. Subject with CT or TT genotypes (n 19) had significantly higher LA detection threshold than subjects with the CC genotype (n 97). P values were obtained using the Mann–Whitney U test. Values are means, with their standard errors represented by vertical bars.
Table 4 Genotype and allelic frequencies of CD36 polymorphisms (Numbers and percentages)
The sequenced exons 5 and 6 corresponded to sequences, described on an online database. We sequenced base pairs 80 661 027–80 661 322 (exon 5) and base pairs 80 662 855–80 663 346 (exon 6) on chromosome 7. In the analysed DNA sequences of four non-tasters and supertasters, we did not find any polymorphism.
Discussion
Dietary perception involves a combination of several senses – that is, vision, olfaction, somatosensation and taste( Reference Rolls 22 ). It has been recently shown that dietary lipids are perceived by olfactory and somatosensory systems( Reference Heinze, Preissl and Fritsche 23 ). Moreover, a gustatory cue might also be involved in the perception of dietary lipids( Reference Besnard, Passilly-degrace and Khan 1 ).
It is generally accepted that dietary habits and food preferences play an important role in the development of adiposity. We observed that craving for ‘fat’ food was associated with adiposity parameters. Some of the food items in the FCI questionnaire are rich in saturated and trans-unsaturated fatty acids, and overconsumption of these lipids has been previously associated with high BMI, obesity and T2DM( Reference Phillips, Kesse-Guyot and McManus 24 – Reference Wang and Beydoun 26 ). We noticed that increased craving for these food items was associated with high oral detection threshold for LA. This observation agrees well with previous reports, demonstrating that intake of dietary lipids might result in decreased oral lipid sensitivity in humans( Reference Stewart and Keast 27 , Reference Daoudi, Plesník and Sayed 28 ) and rodents( Reference Ozdener, Subramaniam and Sundaresan 8 ).
Our study also shows that obese subjects exhibited high detection thresholds for LA; however, the values were not statistically significantly different owing to the small number of participants (data not shown). Nonetheless, there was a positive correlation between LA detection threshold and measured adiposity parameters (i.e. BMI, WC, WHR and WHtR). Our previous studies conducted on Algerian children( Reference Sayed, Šerý and Plesnik 12 ) and teenagers( Reference Daoudi, Plesník and Sayed 28 ) also showed a significant positive correlation between oleic acid detection threshold and WC and BMI, respectively. BMI is currently the most used method to appreciate adiposity in the populations worldwide. However, if the study group is composed of subjects with high lean/muscle mass, the BMI values may be misinterpreted( Reference Garrido-Chamorro, Sirvent-Belando and Gonzalez-Lorenzo 29 ). To eliminate this misinterpretation, we additionally calculated other adiposity parameters. All the parameters were in strong positive correlation. Interestingly, we also noticed a significantly high detection threshold in male participants. Similarly, Ong et al.( Reference Ong, Tan and Say 30 ) showed that female subjects exhibited higher oral lipid sensitivity than male participants.
Our major findings are related to rs1527483 and LA oral detection. Hence, participants with the CC genotype were more sensitive to LA detection than subjects with CT/TT genotypes. This is the first study that shows a statistically significant relationship between this SNP and dietary lipid oral detection threshold in Czech subjects. Our observations corroborate to a few studies that have established a plausible association between rs1527483 with oral fat perception of lipids in African-American and Asian participants( Reference Keller, Liang and Sakimura 10 , Reference Ong, Tan and Say 30 ), although a study conducted on Italian population did not confirm these findings( Reference Melis, Sollai and Muroni 13 ). The discrepancy between these results might be owing to two major aspects: the study of Keller et al. included relatively high number of subjects (more than 300 participants)( Reference Keller, Liang and Sakimura 10 ), whereas the study of Melis et al. was performed only on sixty-four subjects (with only seven subjects with the CT genotype and none with the TT genotype)( Reference Melis, Sollai and Muroni 13 ). The difference might also arise from the techniques used to assess fatty acid detection sensitivity. In fact, Melis et al. used a paper disc, impregnated with oleic acid, placed on the centre of the tongue, which means no contact with circumvallate papillae, located on the posterior region of the tongue, whereas the tasting method used by our group( Reference Karmous, Plesník and Khan 31 ) and Keller et al. involved gargling with LA, which means that the fatty acid can reach the whole tasting area. We do not know the expression level of CD36 in different taste papillae in humans, although CD36 expression in circumvallate papillae and foliate papillae is, respectively, 9-fold and 3·5-fold higher than that in fungiform papillae in mice( Reference Laugerette, Passilly-Degrace and Patris 7 ).
In the past, the T-allele of rs1527483 was also associated with high BMI and BF%( Reference Bokor, Legry and Meirhaeghe 14 ). Despite the fact that we did not measure the BF% in our study, we used several adiposity parameters, and as expected we observed the same trend. Moreover, we observed a higher T-allele frequency in our obese group than the lean subjects, but, as mentioned earlier, the obese group was significantly smaller than the control group; hence, this observation should be confirmed in the future. In another study, no association between this SNP and BMI in Polish children was found( Reference Luczyński, Fendler and Ramatowska 32 ). However, this study was conducted on children with type 1 diabetes, and thus we cannot compare this study with our results. The rs3212018 polymorphism was previously associated with obesity and WC( Reference Keller, Liang and Sakimura 10 ), but we failed to confirm these findings. Moreover, a large meta-analysis of Choquet et al. ( Reference Choquet, Labrune and De Graeve 33 ) failed to observe any differences between CD36 SNP and BMI or obesity. To observe a clear role of rs3212018, a larger study group is required in the future.
To date, no clear explanation on how rs1527483 might influence CD36 function is available. In the past, Love-Gregory et al.( Reference Love-Gregory, Sherva and Schappe 34 ) showed that some of CD36 SNP may reduce CD36 expression in platelets and monocytes. This study also included rs1527483, but no difference was observed for this polymorphism. The study by Chevrot et al. also showed that decreased expression of CD36 directly influences oral sensitivity for fatty acids in rodents( Reference Chevrot, Bernard and Ancel 35 ). CD36 is known to be expressed in a number of cells, including endothelial cells, adipocytes, erythroblasts or striated muscle cells( Reference Silverstein and Febbraio 36 ). Thus, it may be possible that the rs1527483 polymorphism influences CD36 function in other tissues. The rs1527483 polymorphism is located in intron 11 of CD36, and intronic SNP may have a regulatory role as published elsewhere( Reference Millar, Horan and Chuzhanova 37 ). However, the exact physiological consequence of the rs1527483 polymorphism is still unclear. We tried to observe whether the craving for lipid-rich food items is related to CD36 genotypes, but we failed to observe any significant differences.
It is, thus, possible that a mutation located in the CD36 pocket may cause the dietary lipids oral insensitivity. In our study, eleven subjects were classified as LA non-tasters. We sequenced exons 5 and 6, which encode the region surrounding lysine-164. We did not find any mutation in this area, neither in selected non-tasters nor in supertasters. Thus, if there is a mutation that may determine LCFA oral insensitivity, it may be located outside of the hydrophobic pocket of CD36, or in the intronic region. This particular phenomenon requires further studies in future.
In conclusion, our study brings further evidence that oral perception of dietary lipids is influenced by CD36 polymorphisms. Moreover, the rs1527483 genotype and LA oral detection threshold are associated with adiposity parameters.
Acknowledgements
This work has been supported by Agency for Healthcare Research, Czech Republic (AZV CR) – grant project no. NV16-29900A.
One of the authors (J. P.) is thankful to the French Embassy in Prague for the sanction of the scholarship that enabled him to stay in Dijon for his PhD.
N. A. K. designed the study. J. P. conducted the research (data collection and SNP analysis). P. B. conducted DNA sequencing. J. P. performed the statistical analysis. O. S. supervised the hands-on conduct of the experiment and provided the facilities for the data collection. J. P., O. S. and N. A. K. wrote the manuscript. A. S. K participated in data analysis and linguistic correction of the manuscript. All authors have read and approved the final content of the manuscript.
The authors declare that there are no conflicts of interest.


