


1. Introduction
Detonation is a supersonic premixed combustion wave, which consists of a leading shock wave coupled with a reaction zone (Ficket & Davis Reference Ficket and Davis2000; Lee Reference Lee2008; Zhang Reference Zhang2012), velocity of which is around several millimetres per microsecond. Research on detonation is very active in terms of propulsion applications (Wolanski Reference Wolanski2013; Anand & Gutmark Reference Anand and Gutmark2019) and safety engineering (Oran, Chamberlain & Pekalski Reference Oran, Chamberlain and Pekalski2020). Indeed, pressure increase downstream of the detonation waves is very high. As such, the use of this combustion mode in a chamber may give many advantages over a conventional combustor based on deflagration. The Fickett–Jacob cycle shows that higher thermal efficiency can be theoretically achieved. The compressor and the combustion chamber may thus be more compact. On the other hand, unintentional detonations imply severe damage to humans and goods.
Chapman–Jouguet (CJ) theory can predict the experimental detonation velocity in the ideal case with great accuracy. A control volume embeds the leading shock and the state far from the front where a chemical equilibrium is achieved. The CJ velocity can be determined from the fact that the propagation velocity is minimum. The fact that the CJ velocity can be calculated from the initial conditions and the thermodynamic properties is the so-called Khariton principle, meaning that any material capable of exothermic reaction can detonate without losses from boundaries (Higgins Reference Higgins2012).
Later, Zel'dovich, von Neumann & Döring (ZND) proposed the steady one-dimensional (1-D) model for the detonation structure. The induction reaction is triggered by the adiabatic compression of the leading shock front, after which the exothermic reaction takes place. The reactants are transformed into products, the deflagration zone travelling at the same velocity as that of the shock. Characteristic lengths such as the induction and reaction lengths can thus be estimated by the integration of the ZND model.
In contrast to the ZND model assumptions, detonation has an unsteady, multidimension cellular structure (Gamezo, Desbordes & Oran Reference Gamezo, Desbordes and Oran1999a; Austin Reference Austin2003; Pintgen et al. Reference Pintgen, Eckett, Austin and Shepherd2003; Austin, Pintgen & Shepherd Reference Austin, Pintgen and Shepherd2005; Radulescu et al. Reference Radulescu, Sharpe, Lee, Kiyanda, Higgins and Hanson2005, Reference Radulescu, Sharpe, Law and Lee2007; Shepherd Reference Shepherd2009; Kiyanda & Higgins Reference Kiyanda and Higgins2013). The cornerstone of the latter consists of an incident shock, a Mach stem and a transverse wave, linked by a triple point, the trajectory of which draws a fish-cell-like structure. The stronger Mach stem and the weaker incident shock wave alternate in the propagation direction of the wavefront. The leading shock front velocity fluctuated around 0.9–1.25 and 0.7–1.7 times the CJ velocity in weakly unstable and unstable mixtures, respectively (Gamezo et al. Reference Gamezo, Desbordes and Oran1999a). Near the end of the cell, collision of transverse waves, propagating perpendicularly to the leading shocks, may result in very high explosion centres. As a result of all these events, a wide range of distribution of induction, reaction lengths and composition were present, due to the exponential dependence of the chemical reaction rates on temperature (Austin Reference Austin2003; Pintgen et al. Reference Pintgen, Eckett, Austin and Shepherd2003; Austin et al. Reference Austin, Pintgen and Shepherd2005).
From unsteady 1-D simulations, Ng et al. (Reference Ng, Higgins, Kiyanda, Radulescu, Lee, Bates and Nikiforakis2005a), Henrick, Aslam & Powers (Reference Henrick, Aslam and Powers2006) and Romick, Aslam & Power (Reference Romick, Aslam and Power2012) showed that the shock pressure followed a period-doubling Feigenbaum scenario, through the increase of the reduced activation, with Abderrahmane, Paquet & Ng (Reference Abderrahmane, Paquet and Ng2011) determining that the corresponding chaos was deterministic. Shepherd (Reference Shepherd2009) argued that the detonation could be statistically tractable. The hydrodynamic thickness  $x_{HT}$ is the distance between the leading shock and the mean location of the sonic locus, although the latter oscillated and did not strictly coincide any more with the end of the chemical reaction (Kasimov & Stewart Reference Kasimov and Stewart2004; Stewart & Kasimov Reference Stewart and Kasimov2005). As such, this length can be meant as a measure of the detonation driving zone (Short & Quirk Reference Short and Quirk2018; Chiquete & Short Reference Chiquete and Short2019) that embeds in the multidimensional case the leading shock and the sonic surfaces. Moreover, this length could be related to the dynamic parameters of detonation (Murray & Lee Reference Murray and Lee1983, Reference Murray and Lee1985, Reference Murray and Lee1986; Reynaud, Taileb & Chinnayya Reference Reynaud, Taileb and Chinnayya2020).
The hydrodynamic thickness was estimated from both experimental and numerical studies. In experimental studies, the bow shock technique (Vasil'ev et al. Reference Vasil'ev, Gavrilenko, Mitrofanov, Subbotin and Topchiyan1972; Weber & Olivier Reference Weber and Olivier2003) or the decay of the pressure signal (Edwards, Jones & Phillips Reference Edwards, Jones and Phillips1976; Jarsalé, Virot & Chinnayya Reference Jarsalé, Virot and Chinnayya2016) were used. Its estimation in numerical studies were determined by averaging the flow field (Lee & Radulescu Reference Lee and Radulescu2005; Radulescu et al. Reference Radulescu, Sharpe, Law and Lee2007) or by shortening the computational domain until the effect of the rarefactions of the Taylor wave were no more effective (Gamezo, Desbordes & Oran Reference Gamezo, Desbordes and Oran1999b; Mi et al. Reference Mi, Tang Yuk, Lee, Ng, Higgins and Nikiforakis2018). Gamezo et al. (Reference Gamezo, Desbordes and Oran1999a) investigated the effects of the reduced activation energy on detonation, by comparing the Reynolds averages from simulations with the ZND results. Later, Lee & Radulescu (Reference Lee and Radulescu2005) and Radulescu et al. (Reference Radulescu, Sharpe, Law and Lee2007) proposed a Favre averaging procedure in the mean shock frame. They revealed two important characteristic lengths, associated with chemical exothermicity and the slower dissipation of the hydrodynamic fluctuations, which govern the location of the average sonic surface, thus demonstrating the usefulness of the statistical analysis for detonation. Furthermore, Sow, Chinnayya & Hadjadj (Reference Sow, Chinnayya and Hadjadj2014) proposed the Favre average procedure for the detonation in the non-inertial instantaneous shock frame to take into account the unsteadiness of the shock front. So far, the Favre average procedure to obtain 1-D profiles was applied to planar detonations (Lee & Radulescu Reference Lee and Radulescu2005; Radulescu et al. Reference Radulescu, Sharpe, Law and Lee2007; Maxwell et al. Reference Maxwell, Bhattacharjee, Lau-Chapedlaine, Falle, Sharpe and Radulescu2017; Taileb et al. Reference Taileb, Reynaud, Chinnayya, Virot and Bauer2018; Sow, Lau-Chapdelaine & Radulescu Reference Sow, Lau-Chapdelaine and Radulescu2021; Taileb, Meluguizo-Gavilances & Chinnayya Reference Taileb, Meluguizo-Gavilances and Chinnayya2021b), in non-uniform mixtures (Mi, Timofeev & Higgins Reference Mi, Timofeev and Higgins2017a; Mi et al. Reference Mi, Higgins, Ng, Kiyanda and Nikiforakis2017b), in mixtures with concentration gradients (Han, Wang & Law Reference Han, Wang and Law2019), in mixtures with fluctuations in concentrations (Zhou et al. Reference Zhou, Zhang, Zhong, Deiterding, Zhou and Wei2022), cylindrical detonation (Han et al. Reference Han, Kong, Gao and Law2017), also in non-ideal configurations such as detonations bounded by an inert layer (Reynaud, Virot & Chinnayya Reference Reynaud, Virot and Chinnayya2017; Reynaud et al. Reference Reynaud, Taileb and Chinnayya2020), with wall losses (Chinnayya, Hadjadj & Ngomo Reference Chinnayya, Hadjadj and Ngomo2013; Sow et al. Reference Sow, Chinnayya and Hadjadj2014; Sow, Chinnayya & Hadjadj Reference Sow, Chinnayya and Hadjadj2015, Reference Sow, Chinnayya and Hadjadj2019), in two-phase detonations with water spray (Watanabe et al. Reference Watanabe, Matsuo, Matsuoka, Kawasaki and Kasahara2019, Reference Watanabe, Matsuo, Chinnayya, Matsuoka, Kawasaki and Kasahara2020, Reference Watanabe, Matsuo, Chinnayya, Matsuoka, Kawasaki and Kasahara2021) and with fuel spray (Jourdaine, Tsuboi & Hayashi Reference Jourdaine, Tsuboi and Hayashi2022).
All these studies have extracted their 1-D profiles from straight lines parallel to the direction of detonation propagation. However, Sow et al. (Reference Sow, Lau-Chapdelaine and Radulescu2021) showed that these straight lines did not coincide with the material trajectories, due to convective mixing, which increased with lower isentropic indexes, due to jet enhancement. Moreover, Borzou (Reference Borzou2016) and Radulescu (Reference Radulescu2018) tracked Lagrangian tracers, trajectories of which were affected by the cellular structure of a single-headed detonation. These studies are the very few previous investigations on dispersion behind a detonation front, to the best of our knowledge. In addition, the comparison between Lagrangian and Eulerian averaging processes has not been done yet.
In order to address this issue, unsteady two-dimensional (2-D) simulations with the Lagrangian particle tracking method were conducted for detonation in a straight channel for two mixtures of increased irregularity. Both the distance travelled by the Lagrangian particle behind the front and the time from shock passage were recorded in the course of the simulations. The degree of the dispersion and the relative dispersion (Babiano et al. Reference Babiano, Basdevant, Roy and Sadourny1990; Sawford Reference Sawford2001; Salazar & Collins Reference Salazar and Collins2009) were evaluated. Two new Favre average procedures, based on the distance travelled by the Lagrangian particle or the time from the shock passage were proposed to assess the accuracy of the previous Eulerian Favre average procedure.
The plan of this paper is as follows. The governing equations and the numerical method are presented in §§ 2.1 and 2.2, respectively. The procedure to record the values for each Lagrangian particle is explained in § 2.3. Section 3 describes the problem statement. The results and discussions are given in § 4. The dispersion behind the detonation front and the anisotropic motion are firstly examined in § 4.1. Then, the dispersion in the induction time scale is analysed in § 4.2. Furthermore, the relative dispersion is discussed in § 4.3. Moreover, the two new Lagrangian Favre average procedures are described and the 1-D profiles from these procedures are compared with the Eulerian estimates in § 4.4. Finally, the main conclusions are drawn in § 5.
2. Numerical set-up
2.1. Governing equations
The governing equations for the gaseous phase are the 2-D reactive compressible Navier–Stokes equations, with the ideal equation of state. The chemical reaction mechanism proposed by Hong, Davidson & Hanson (Reference Hong, Davidson and Hanson2011), which considers nine species ( $\textrm {H}_2$, $\textrm {O}_2$, H, O, OH, $\textrm {H}_2$O, H $\textrm {O}_2$, $\textrm {H}_2$ $\textrm {O}_2$ and $\textrm {Ar}$) and 20 elemental reactions, is used. In addition, the reliable performance of this detailed chemical reaction mechanism can be achieved over a range of the reactant concentrations, stoichiometries, pressures and temperatures from 950 K to greater than 3000 K according to the validation by Hong et al. (Reference Hong, Davidson and Hanson2011). Here,
 \begin{gather} \frac{\partial \boldsymbol{U}}{\partial t} + \frac{\partial \boldsymbol{E}}{\partial x} + \frac{\partial \boldsymbol{F}}{\partial y} + \frac{\partial \boldsymbol{E_{d}}}{\partial x} + \frac{\partial \boldsymbol{F_{d}}}{\partial y} = \boldsymbol{S}, \end{gather}
 \begin{gather}\boldsymbol{U} = \begin{bmatrix} \rho \\ \rho u \\ \rho v \\ e \\ \rho Y_k \\ \end{bmatrix},\quad \boldsymbol{E} = \begin{bmatrix} \rho u\\ \rho u^2 + p \\ \rho uv \\ (e+p)u \\ \rho Y_k u \\ \end{bmatrix},\quad \boldsymbol{F} = \begin{bmatrix} \rho v\\ \rho uv \\ \rho v^2 + p \\ (e+p)v \\ \rho Y_k v \end{bmatrix} , \end{gather}
 \begin{gather}\boldsymbol{E_{d}} = \begin{bmatrix} 0 \\ - \tau_{xx} \\ - \tau_{xy} \\ - \tau_{xx}u -\tau_{xy}v + q_x\\ j_{x,k} \end{bmatrix},\quad \boldsymbol{F_{d}} = \begin{bmatrix} 0 \\ - \tau_{yx} \\ - \tau_{yy} \\ - \tau_{yx}u -\tau_{yy}v + q_y\\ j_{y,k} \end{bmatrix},\quad \boldsymbol{S} = \begin{bmatrix} 0 \\ 0 \\ 0 \\ 0 \\ \dot{\omega}_{k} \end{bmatrix}, \end{gather}
 \begin{gather}p=\rho R T, \end{gather}
where,  $x$,
$x$,  $y$,
$y$,  $t$,
$t$,  $\rho$, $u$,
$u$,  $v$,
$v$,  $p$,
$p$,  $T$,
$T$,  $e$,
$e$,  $Y_{k}$ and $R =R_{u} (\sum _{k=1}^{N_{s}} Y_{k} / W_{k})$ are longitudinal coordinate, transverse coordinate, time, density, velocity in $x$ direction, velocity in $y$ direction, pressure, temperature, total energy, mass fraction of species $k$ and gas constant, respectively. Here $N_{s}$, $R_{u}$ and $W_{k}$ are the total number chemical species, universal gas constant, and molecular weight of species $k$.
$k$.  ${\bf \tau}$, $q$,
$q$,  $j_{k}$ and $\dot {\omega }_{k}$ denote the shear stress, heat flux, diffusion flux and reaction rate, respectively. The total energy can be written as the following formula:
 \begin{equation} e = \sum_{k=1}^{N_{s}} \rho Y_k h_k - p + \tfrac{1}{2} \rho ( u^2 + v^2 ). \end{equation}
Here,  $h_{k}$ is enthalpy for species $k$. The Stokes’ hypothesis is utilized and the bulk viscosity can be neglected. The shear stress is expressed as
 \begin{gather} \tau_{xx} = \frac{2}{3} \mu \left( 2 \frac {\partial u}{\partial x} - \frac {\partial v}{\partial y} \right), \end{gather}
 \begin{gather}\tau_{xy} = \tau_{yx} = \mu \left(\frac {\partial u}{\partial y} + \frac {\partial v}{\partial x} \right), \end{gather}
 \begin{gather}\tau_{yy} = \frac{2}{3} \mu \left(2 \frac {\partial v}{\partial y} - \frac {\partial u}{\partial x} \right). \end{gather}
Here,  $\mu$ is viscosity. The heat flux is the sum of the heat flux by the temperature gradient (i.e. Fourier's law) and the heat flux by the enthalpy transport. The heat flux caused by concentration gradients, i.e. Dufour effect, is neglected in this study because the Dufour effect is negligibly small in the combustion process (Warnatz, Maas & Dibble Reference Warnatz, Maas and Dibble2006).
 \begin{gather} q_{x} ={-}\kappa \frac {\partial T}{\partial x} - \rho \sum_{k=1}^{N_{s}} h_{k} D_{k} \frac {\partial Y_{k}}{\partial x}, \end{gather}
 \begin{gather}q_{y} ={-}\kappa \frac {\partial T}{\partial y} - \rho \sum_{k=1}^{N_{s}} h_{k} D_{k} \frac {\partial Y_{k}}{\partial y}. \end{gather}
Here,  $\kappa$ and $D_{k}$ are thermal conductivity and diffusion coefficient for species $k$. The diffusive flux is evaluated using Fick's law as the following equations:
 \begin{gather} j_{x,k} ={-}\rho D_{k} \frac {\partial Y_{k}}{\partial x} , \end{gather}
 \begin{gather}j_{y,k} ={-}\rho D_{k} \frac {\partial Y_{k}}{\partial y} . \end{gather}
 The diffusive flux caused by temperature gradient, i.e. Soret effect, is neglected in this study. The Soret effect is only important for light species and at low temperature (Warnatz et al. Reference Warnatz, Maas and Dibble2006) so that its effect will be negligible for the propagation of detonation wave and the flow field behind the front.  $D_{k}$ used in (2.11) and (2.12) is evaluated by the mixing rule for the diffusive flux in terms of the mass fraction (Kee, Coltrin & Glarborg Reference Kee, Coltrin and Glarborg2003) (see (2.33)) so that the expression for the diffusive flux in mixture average evaluation is consistent. The correction velocity to ensure that the summation of the diffusive fluxes is zero was not taken into account in our computations. Indeed, the magnitude of correction is significantly small (Reaction Design 2000). Moreover, in order to ensure that the summation of the mass fractions to be one numerically, each mass fraction was normalized by the summation of the mass fractions, after the numerical integration.
The thermodynamic properties such as enthalpy  $h_{k}$, specific heat at the constant pressure $c_{{p},{k}}$ and entropy $s_{k}^0$ for species $k$ are assumed to be functions of temperature and are determined from the Janaf thermochemical polynomials (McBride, Gordon & Reno Reference McBride, Gordon and Reno1993):
 \begin{gather} \frac{h_k}{(R_{{u}} / W_k) T} = a_{{1},k} + \frac {a_{{2},k}}{2} T + \frac {a_{{3},k}}{3} T^2 + \frac {a_{{4},k}}{4} T^3 + \frac {a_{{5},k}}{5} T^4 + \frac {a_{{6},k}}{T}, \end{gather}
 \begin{gather}\frac {c_{{p},{k}}}{R_{{u}} / W_k} = a_{{1},k} + a_{{2},k} T + a_{{3},k}T^2 + a_{{4},k} T^3 + a_{{5},k} T^4, \end{gather}
 \begin{gather}\frac {s_{k}^0}{R_{{u}} / W_k} = a_{{1},k} \ln T + a_{{2},k} T + \frac {a_{{3},k}}{2}T^2 + \frac {a_{{4},k}}{3} T^3 + \frac {a_{{5},k}}{4} T^4 + a_{{7},k}. \end{gather}
Here,  $a_{{1},k}$, $a_{{2},k}$, $a_{{3},k}$, $a_{{4},k}$, $a_{{5},k}$, $a_{{6},k}$ and $a_{{7},k}$ are the coefficients depending on the species $k$ and temperature range ( $T<1000$ K or $T\geqq 1000$ K).
From a preliminary study, a method proposed by Gordon, McBride & Zeleznik (Reference Gordon, McBride and Zeleznik1984) is shown to be accurate compared with the experimental data as for the viscosity and thermal conductivity. However, the coefficients for  $\textrm {HO}_2$ in a method proposed by Gordon et al. (Reference Gordon, McBride and Zeleznik1984) are not available. As for the transport properties of viscosity $\mu _{k}$ and thermal conductivity $\kappa _{k}$ for species $k$ apart from $\textrm {HO}_2$, a method proposed by Gordon et al. (Reference Gordon, McBride and Zeleznik1984) is used to estimate the gas viscosity and thermal conductivity as the following equations:
 \begin{gather} \ln \mu_k = C_{1,k}^{\mu} \ln T + \frac { C_{2,k}^{\mu}}{T} + \frac { C_{3,k}^{\mu}}{T^2} + C_{4,k}^{\mu}, \end{gather}
 \begin{gather}\ln \kappa_k = C_{1,k}^{\kappa} \ln T + \frac { C_{2,k}^{\kappa}}{T} + \frac { C_{3,k}^{\kappa}}{T^2} + C_{4,k}^{\kappa}. \end{gather}
Here,  $C_{1,k}^{\mu }$, $C_{2,k}^{\mu }$, $C_{3,k}^{\mu }$, $C_{4,k}^{\mu }$, $C_{1,k}^{\kappa }$, $C_{2,k}^{\kappa }$, $C_{3,k}^{\kappa }$ and $C_{4,k}^{\kappa }$ are the coefficients depending on the species $k$ and temperature range ( $T < 1000$ K or $T\geqq 1000$ K).
The viscosity and thermal conductivity for  $\textrm {HO}_2$ are calculated from the Chapman–Enskog method (Chapman & Cowling Reference Chapman and Cowling1991) and the Eucken method (Poling, Prausnitz & O'Connel Reference Poling, Prausnitz and O'Connel2001), respectively.
The viscosity for  $\textrm {HO}_2$ is evaluated by the Chapman–Enskog method (Chapman & Cowling Reference Chapman and Cowling1991) by
 \begin{equation} \mu_{\rm{HO}_2} = 2.6693 \times 10^{{-}6} \frac{\sqrt{W_{\rm{HO}_2} T}}{\sigma_{\rm{HO}_2}^2 \varOmega_{22}}. \end{equation}
Here,  $\sigma _{\mathrm {HO}_2}$ and $\varOmega _{22}$ are the Lennard–Jones collision diameter for $\textrm {HO}_2$ and the collision integral, respectively. The collision integrals $\varOmega _{22}$ are calculated from the following empirical formula suggested by Neufeld, Janzen & Aziz (Reference Neufeld, Janzen and Aziz1972):
 \begin{equation} \varOmega_{22} = C_1^{22} (T^*)^{{-}C_2^{22}} + C_3^{22} \exp{({-}C_4^{22} T^*)} + C_5^{22} \exp{({-}C_6^{22} T^*)}. \end{equation}
Here, the constants in (2.19) are defined as follows:  $C_1^{22} = 1.16145$; $C_2^{22} = 0.14874$; $C_3^{22} = 0.52487$; $C_4^{22} = 0.77320$; $C_5^{22} = 2.16178$; $C_6^{22} = 2.43787$. Here, $T^*$ is the reduced temperature given by
 \begin{equation} T^* = \frac{k_B T}{\varepsilon_k}. \end{equation}
Here,  $\varepsilon _k$ and $k_B$ are the Lennard–Jones potential well depth for species $k$ and the Boltzmann constant, respectively. The thermal conductivity for $\textrm {HO}_2$ is evaluated by the Eucken method (Poling et al. Reference Poling, Prausnitz and O'Connel2001) as
 \begin{equation} \kappa_{\rm{HO}_2} = \tfrac{7}{2} R_{\rm {u}} \mu_{\rm{HO}_2}. \end{equation}
The Wilke method (Wilke Reference Wilke1958) and the Wassiljewa method (Law Reference Law2006) are used to estimate the multicomponent gas viscosity and thermal conductivity based on the pure species values:
 \begin{gather} \mu = \sum_{k=1}^{N_{s}} \frac{\mu_k}{1 + \displaystyle\frac{1}{X_k} \sum_{l\neq k}^{N_{s}} X_l \varPhi_{kl}}, \end{gather}
 \begin{gather}\kappa = \sum_{k=1}^{N_{s}} \frac{\kappa_k}{1 + \displaystyle\frac{1.065}{X_k}\sum_{l\neq k}^{N_{s}} X_l \varPhi_{kl} }. \end{gather}
Here,  $X_k$ is the molar fraction for species k and $\varPhi _{kl}$ is calculated as
 \begin{equation} \varPhi_{kl} = \frac{ \lbrack 1 + (\mu_k / \mu_l)^{1/2} (W_l / W_k)^{1/4} \rbrack ^2} {2 \sqrt{2} (1+W_k / W_l )^{1/2}}. \end{equation}
 The diffusion coefficient of a compound  $k$ into the mixture of the other compounds is evaluated based on the binary diffusion coefficient between the species $k$ and $l$ from the Chapman–Enskog method (Chapman & Cowling Reference Chapman and Cowling1991). The binary diffusion coefficient between the species $k$ and $l$ is the function of temperature and pressure and expressed as the following formula:
 \begin{equation} D_{kl} = 2.628 \times 10^{{-}2} \frac{\sqrt{T^3}}{p \sigma^2_{kl} \varOmega_{11}} \sqrt{\frac{(W_k + W_l)}{2W_k W_l}}. \end{equation}
Here,  $\sigma _{kl}$ and $\varOmega _{11}$ are the effective collision diameter for species $k$ and $l$, and the collision integral. The collision integral $\varOmega _{11}$ is estimated by the following empirical formula (Neufeld et al. Reference Neufeld, Janzen and Aziz1972):
 \begin{gather} \varOmega_{11} = \frac{C_1^{11}}{(T^*_d)^{C_2^{11}}} + \frac{C_3^{11}}{\exp{(C_4^{11} T^*_d)}} + \frac{C_5^{11}}{\exp{(C_6^{11} T^*_d)}} + \frac{C_7^{11}}{\exp{(C_8^{11} T^*_d)}}, \end{gather}
 \begin{gather}T^*_d = \frac{k_B T}{\varepsilon_{kl}}. \end{gather}
Here, the constants in (2.26) are defined as follows:  $C_1^{11} = 1.06036$; $C_2^{11} = 0.15610$; $C_3^{11} = 0.19300$; $C_4^{11} = 0.47635$; $C_5^{11} = 1.03587$; $C_6^{11} = 1.52996$; $C_7^{11} = 1.76474$; $C_8^{11}= $ $ 3.89411$. Here $\varepsilon _{kl}$ is the effective Lennard–Jones potential well depth for species $k$ and $l$. Here $\sigma _{kl}$ and $\varepsilon _{kl}$ are estimated based on the Lennard–Jones collision diameter and Lennard–Jones potential well depth for species $k$ and $l$, and the formula is different depending on whether the collision partners are polar or non-polar. For the case that the partners are either both polar or both non-polar, the equations are
 \begin{gather} \varepsilon_{kl} = \sqrt{\varepsilon_{k} \varepsilon_{l}}, \end{gather}
 \begin{gather}\sigma_{kl} = \frac{\sigma_{k} \sigma_{l}}{2}. \end{gather}
Here,  $\varepsilon _k$, $\varepsilon _l$ are the Lennard–Jones collision potential well depth for species $k$ and $l$, respectively. Here $\sigma _k$ and $\sigma _l$ are the Lennard–Jones collision diameter for species $k$ and $l$, respectively. For the case for a polar molecule interacting with a non-polar molecule, the equations are
 \begin{gather} \varepsilon_{kl} = \xi^2 \sqrt{\varepsilon_{k} \varepsilon_{l}}, \end{gather}
 \begin{gather}\sigma_{kl} = \frac{\sigma_{k} \sigma_{l}}{2} \xi^{-({1}/{6})}, \end{gather}
 \begin{gather}\xi = 1 + \frac{1}{4} \alpha^*_{{np}} \mu^*_{{pol}} \sqrt{\frac{\varepsilon_{{pol}}}{\varepsilon_{{np}}}}. \end{gather}
Here,  $\alpha ^*_{{np}}$ and $\mu ^*_{{pol}}$ are the reduced polarizability for the non-polar molecule and the reduced dipole moment for the polar molecule, respectively. The subscripts for $np$ and $pol$ in (2.32) denote the non-polar and polar molecule, respectively. The diffusion coefficient of a compound $k$ into the mixture of the other compound $D_k$ to estimate the diffusive flux using the mass fraction gradient is calculated by the following mixing rule (Kee et al. Reference Kee, Coltrin and Glarborg2003):
 \begin{equation} D_k = \frac{ 1}{\displaystyle\sum_{l\neq k}^{N_{s}} \frac{X_l}{D_{kl}} + \frac{X_k}{1 - Y_k} {\sum_{l\neq k}^{N_{s}} \frac{Y_k}{D_{kl}}} }.\end{equation}
The trajectories of the gas particles can be simply obtained by massless Lagrangian particles with the following equations:
 \begin{gather} \frac {\mathrm{d}\kern0.7pt x_{{p},i}} {\mathrm{d} t} = u_{i}, \end{gather}
 \begin{gather}\frac {\mathrm{d}y_{{p},i}} {\mathrm{d} t} = v_{i}. \end{gather}
Here,  $x_{{p},i}$ and $y_{{p},i}$ are the $x$ position and $y$ positions for the $i$th Lagrangian particle. Here $u_{i}$ and $v_{i}$ are the $x$ and $y$ components of the velocity at the $i$th particle position, respectively.
2.2. Numerical methods
The detailed formulation of the numerical method can be found in Watanabe (Reference Watanabe2020). A classical first-order operator-splitting method is employed to couple the hydrodynamics with the detail chemistry. The spatial derivatives of the convective term are discretized by a fifth-order advection upstream splitting method using pressure-based weight functions (known as AUSMPW+) improved by Kim, Kim & Rho (Reference Kim, Kim and Rho2001) based on a modified weighted essentially non-oscillatory scheme (known as MWENO-Z) (Hu, Wang & Chen Reference Hu, Wang and Chen2016) and a second-order central differential scheme is applied to the discretization of the diffusive term. The time integration method for the convective and diffusion terms is the third-order total variation diminishing Runge–Kutta method (Gottlieb, Shu & Tadmor Reference Gottlieb, Shu and Tadmor2001), and the multi-time scale method (Gou et al. Reference Gou, Sun, Chen and Ju2010) is used for the time integration of the chemical source term.
The first-order Euler method is used for the integration of the Lagrangian particles. The gas phase quantities around the  $i$th Lagrangian particle $\psi _i$ are estimated by interpolating the surrounding three nearby Eulerian cell values by the barycentric interpolation (Shimura & Matsuo Reference Shimura and Matsuo2018) as follows (see (2.36)):
 \begin{equation} \psi_i = c_1 \psi_1 + c_2 \psi_2 + c_3 \psi_3. \end{equation}
Here,  $\psi _1$, $\psi _2$ and $\psi _3$ are the gas phase quantities at three Eulerian cells nearby the $i$th Lagrangian particle, respectively. Here $c_1$, $c_2$ and $c_3$ are the normalized coefficients which are estimated based on the ratio of area of the triangles to the area of the cell (Shimura & Matsuo Reference Shimura and Matsuo2018; Watanabe Reference Watanabe2020).
2.3. Recording the variables for each Lagrangian particle
The variables of each Lagrangian particle were recorded during the course of their trajectories, being updated every time step. The time when the Lagrangian particles passed the leading shock front  $t_{shock}$ was recorded by the first pressure jump experienced by the Lagrangian particles to estimate the time from the shock passage $\tau = t - t_{shock}$. The dispersion of the Lagrangian particles were evaluated by the distance travelled by the Lagrangian particle after the shock passage from (2.37), (2.38) and (2.39). The equations (2.37) and (2.38) refer to the longitudinal and transverse distances travelled by the Lagrangian particle after the shock passage, respectively; equation (2.39) represents the distance travelled by the Lagrangian particle after the shock passage:
 \begin{gather} x_{i} = \int u_{i} \,\mathrm{d}t, \end{gather}
 \begin{gather}y_{i} = \int | v_{i} | \,\mathrm{d}t, \end{gather}
 \begin{gather}x_{{xy},i} = \int ( u_{i}^2 + v_{i}^2 )^{1/2} \mathrm{d}t. \end{gather}
 Tracking of the Lagrangian particles enabled us to obtain the time when the induction process was completed. The thermicity  $\dot {\sigma }$, which denotes the influence of chemical reaction on the flow velocity due to both chemical energy release and change in the number of moles present, was used to define the induction time. The thermicity was defined by the following equation and calculated based on the variables at each Lagrangian particle position:
 \begin{equation} \dot{\sigma} = \sum_{k=1}^{N_{s}} \left( \frac{W}{W_k} -\frac{h_k}{c_{{p}} T} \right) \frac{\dot{\omega}_{k}}{\rho}. \end{equation}
 During the simulation, the time, the  $x$- and $y$- Lagrangian particle positions and the distance travelled by the Lagrangian particle when the thermicity was maximum were recorded and updated every time step. The induction time was defined as the time from the shock front to the time when the thermicity was maximum in this study. With the use of the Lagrangian particle tracking method, the induction time for each Lagrangian particle can be accurately evaluated from the difference between the time when the Lagrangian particle passed the leading shock front and the time when the thermicity was maximum.
3. Problem statement
The schematics for the computational target is shown in figure 1(a). The fully developed 2-D gaseous detonation propagates in a straight channel. Two types of reactive mixtures have been investigated: 70 % diluted stoichiometric hydrogen oxygen mixture 2H $_2$–O $_2$–7Ar and stoichiometric hydrogen oxygen mixture 2H $_2$–O $_2$ at ambient conditions (0.1 MPa and 300 K). The effect of instabilities can thus be assessed on the dispersion and the averaging processes. Figure 1(b) shows the thermicity profile for both mixtures. Table 1 lists the various parameters for both mixtures characterizing detonation such as the CJ velocity $D_{CJ}$, the CJ Mach number $M_{CJ}$, the induction length $x_{ind}$, the reaction length $x_{reac}$, the induction time $\tau _{ind}$, the reaction time $\tau _{reac}$, the reduced activation energy $E_{a}/(RT_{vN})$, the $\chi$ $=(E_{a}/(RT_{vN})) (x_{ind} / x_{reac}$) parameter, and the specific heat ratio at von Neumann (vN) state $\gamma _{vN}$. Following the definition by Radulescu (Reference Radulescu2003) and Ng et al. (Reference Ng, Radulescu, Higgins, Nikiforakis and Lee2005b), the induction length $x_{ind}$ was defined as the distance from the leading shock front to the position where the thermicity was maximum, and the reaction length $x_{reac}$ was estimated by $u_{CJ} / \dot {\sigma }_{max}$ using the maximum thermicity $\dot {\sigma }_{max}$ and the velocity at the CJ plane in the shock frame $u_{CJ}$. In addition, the induction time $\tau _{ind}$ was estimated from the time from the leading shock front to the time when thermicity was maximum, and the reaction time $\tau _{reac}$ was defined as the half-pulse-width time of thermicity, respectively. The induction time for the 2H $_2$–O $_2$ mixture is approximately two times shorter than that for the 2H $_2$–O $_2$–7Ar mixture and the peak thermicity for 2H $_2$–O $_2$ is approximately one order of magnitude higher compared with that for the 2H $_2$–O $_2$–7Ar mixture in the present conditions (figure 1b and table 1). The mixtures can be classified as weakly and mildly unstable mixtures, according to the stability analysis (Eckett, Quirk & Shepherd Reference Eckett, Quirk and Shepherd2000; Austin et al. Reference Austin, Pintgen and Shepherd2005) based on the reduced activation energy and CJ Mach number. Based on the $\chi$ parameter and CJ Mach number, the instability parameters lie slightly below and above the neutral stability curve, for the diluted and non-diluted cases (Ng et al. Reference Ng, Radulescu, Higgins, Nikiforakis and Lee2005b).

Figure 1. Simulation set-up. (a) Schematics of the computational target. (b) The ZND thermicity profile in 2H $_2$–O $_2$–7Ar and 2H $_2$–O $_2$ mixtures.
Table 1. Parameters of the reactive mixtures in the present conditions.

The channel widths for 2H $_2$–O $_2$–7Ar and 2H $_2$–O $_2$ mixtures are 2.6 and 2.0 mm, respectively. The boundary condition for the walls is the adiabatic non-slip wall and the transmissive boundary is applied to the left end. The grid is uniform and the grid width is equal at 2.0 and 1.6 $\mathrm {\mu }$m from the region from the shock front up to 20.6 and 11.5 mm behind the front for the 2 $\textrm {H}_2$– $\textrm {O}_2$–7Ar mixture and 2 $\textrm {H}_2$– $\textrm {O}_2$ mixture, respectively. The computational domain with the minimum grid width encompassed the mean leading shock front and the mean sonic plane, which were evaluated in § 4.4. Then, the grid is stretched. The grid resolution is approximately 38 and 30 points per CJ induction length for the 2 $\textrm {H}_2$– $\textrm {O}_2$–7Ar mixture and the 2 $\textrm {H}_2$– $\textrm {O}_2$ mixture, respectively. This resolution has been shown to be largely sufficient to capture the mean structure (Reynaud et al. Reference Reynaud, Virot and Chinnayya2017, Reference Reynaud, Taileb and Chinnayya2020). In addition, this resolution is enough to reproduce the features of the instantaneous flow fields for weakly unstable mixtures (Mazaheri, Mahmoudi & Radulescu Reference Mazaheri, Mahmoudi and Radulescu2012). The grid resolution study was performed in Appendix A and the main conclusions were not called into question by the present grid resolution. For more highly unstable mixtures, this resolution may not be sufficient to capture the unsteady burning mechanism of the unburnt pockets that are likely to form downstream of the leading shocks. The Courant–Friedrichs–Lewy number was fixed at 0.2 and the typical time step size was around $1.0\times 10^{-10}$ and $0.5\times 10^{-10}$ s for 2 $\textrm {H}_2$– $\textrm {O}_2$–7Ar and 2 $\textrm {H}_2$– $\textrm {O}_2$ mixtures, respectively.
The recycling block technique (Sow et al. Reference Sow, Chinnayya and Hadjadj2019) is applied to enable the detonation to propagate a distance long enough to obtain statistical values. When the leading shock front reached the right-hand boundary during the simulations, the new region with the upstream condition for unburned state was appended to the right of the computational domain and the region near the left-hand boundary which was far from the mean sonic plane was discarded. The same procedure was also applied for the Lagrangian particles. When the leading shock front reached the right-hand boundary during the simulations, the new Lagrangian particles were located to the right of the computational domain and the Lagrangian particles which were located in the discarded left-hand domain were excluded from the simulations. The recycling block technique was successfully utilized to reduce the computational cost by the use of smaller computational domain and to simulate the detonation propagation in the previous studies (Reynaud et al. Reference Reynaud, Virot and Chinnayya2017, Reference Reynaud, Taileb and Chinnayya2020; Sow et al. Reference Sow, Chinnayya and Hadjadj2019; Watanabe et al. Reference Watanabe, Matsuo, Chinnayya, Matsuoka, Kawasaki and Kasahara2020, Reference Watanabe, Matsuo, Chinnayya, Matsuoka, Kawasaki and Kasahara2021; Taileb, Meluguizo-Gavilances & Chinnayya Reference Taileb, Meluguizo-Gavilances and Chinnayya2021a; Taileb et al. Reference Taileb, Meluguizo-Gavilances and Chinnayya2021b). The length of the propagation for the average procedure is approximately 1000  $x_{ind}$ for 2H $_2$–O $_2$–7Ar and 1200 $x_{ind}$ for 2H $_2$–O $_2$. This study has cost approximately $2.0\times 10^6$ CPU hours with 64 processors.
The Lagrangian particles are initially located in the fresh mixture in every grid point. The number of these particles inside the computational domain changes during the simulation due to the recycling block method and are around  $34\times 10^6$ and $25\times 10^6$ for the 2H $_2$–O $_2$–7Ar mixture and the 2H $_2$–O $_2$ mixture, respectively. In order to get the averaged values, the instantaneous 2-D flow fields are saved each time the detonation front propagates 0.5 $x_{ind}$. The total number of the particles in the region where the detonation propagates is approximately $5 \times 10^7$ and $6 \times 10^7$ for the 2H $_2$–O $_2$–7Ar and 2H $_2$–O $_2$ mixtures, respectively.
4. Results and discussions
4.1. Dispersion and anisotropy
Firstly, the global features of the 2H $_2$–O $_2$–7Ar and 2H $_2$–O
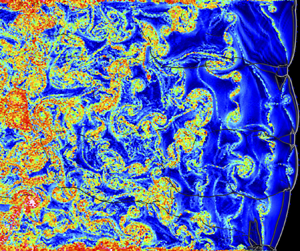
 $_2$ mixtures are depicted using the instantaneous 2-D flow fields in figures 2 and 3, respectively. In the 2 $\textrm {H}_2$– $\textrm {O}_2$–7Ar mixture, the cellular structure is regular with two cells in the channel (figure 2c). No unburned gas pocket is formed behind the front and the classical key stone feature can be observed (figure 2a,b). As for the 2 $\textrm {H}_2$– $\textrm {O}_2$ mixture, the cellular structure and the frontal shape were more irregular (figure 3), expected from the increased instability parameters. The unburned gas pockets are torn apart from the front and continue to burn downstream (figure 3a,b). In both cases, strong transverse wave structures occurred in the second part of the cell (figures 2b and 3b), as also observed experimentally by Desbordes & Presles (Reference Desbordes and Presles2012). The thermicity fields indicated that the heat release took place much more rapidly and sometimes one order of magnitude quicker in the non-diluted case than in the diluted case (figures 2b and 3b). The average propagation velocity for both mixtures agreed with that of the CJ velocity. The average cell width in the simulations from the manual measurement of 150 and 300 cells for the 2 $\textrm {H}_2$– $\textrm {O}_2$–7Ar and 2 $\textrm {H}_2$– $\textrm {O}_2$ mixtures is 1.3 and 0.7 mm, respectively. The experimental cell width for the 2 $\textrm {H}_2$– $\textrm {O}_2$–7Ar mixture is expected to be 2.7–4.0 mm from similar mixture conditions, and the cell width reported from experiments for the 2 $\textrm {H}_2$– $\textrm {O}_2$ mixture ranges from 1.4 to 2.1 mm (Kaneshige & Shepherd Reference Kaneshige and Shepherd1997). Therefore, the cell sizes in the simulations were thus smaller that the experimental ones by a factor of approximately 2–3. The numerical cell width is reported to be smaller as in previous studies (Taylor et al. Reference Taylor, Kessler, Gamezo and Oran2013; Taileb et al. Reference Taileb, Meluguizo-Gavilances and Chinnayya2021a). This is not due to the present numerical resolution but may be due to vibrational non-equilibrium effects (Taylor et al. Reference Taylor, Kessler, Gamezo and Oran2013; Shi et al. Reference Shi, Shen, Zhang, Zhang and Wen2017), uncertainties of the chemical reaction model in detonation conditions (Mével & Gallier Reference Mével and Gallier2018) and three-dimensional (3-D) effects (Taileb et al. Reference Taileb, Reynaud, Chinnayya, Virot and Bauer2018; Monnier et al. Reference Monnier, Rodriguez, Vidal and Zitoun2022; Crane et al. Reference Crane, Lipkowicz, Shi, Wlokas, Kempf and Wang2023).

Figure 2. The 2-D instantaneous flow fields in 2H $_2$–O $_2$–7Ar mixture: (a) temperature; (b) thermicity; (c) maximum pressure.

Figure 3. The 2-D instantaneous flow fields in 2H $_2$–O $_2$ mixture: (a) temperature; (b) thermicity, (c) maximum pressure.
Figures 4 and 5 show the instantaneous 2-D flow fields in the Lagrangian perspective for (a) time front shock passage; (b) longitudinal distance travelled by the particle  $x_{i}$; (c) transverse distance travelled by the particle $y_{i}$; (d) distance travelled by the particle $x_{{xy,i}}$ from shock passage for the 2H $_2$–O $_2$–7Ar and 2H $_2$–O $_2$ mixtures, respectively. As we move away from the leading shocks, the time from shock passage and the longitudinal distance $x_{i}$ increased. However, their distributions were not uniform in each section, regardless of the mixture instability. This non-uniform distribution of the Lagrangian particles is consistent with the numerical findings of Sow et al. (Reference Sow, Lau-Chapdelaine and Radulescu2021). The scales of the legends for figures 4(a) and 5(a) are different, due to the difference in detonation velocities for both mixtures. It can also be seen that $x_{i}$ and $x_{{xy},i}$ were almost the same, due to the fact that $y_{i}$ remained one order of magnitude lower. In the rest of the paper, only the field of $x_{i}$ will be discussed instead of that of $x_{{xy},i}$. More noticeable was that the transverse distance $y_{i}$ was much spottier for the non-diluted case, as we moved away from the leading shocks, indicative of more vortical structures. Large tongues of gas were also seen to penetrate the different layers and to be entrained in the $x$-direction. The longitudinal distance $x_{i}$ for the particles inside the boundary layer can also be seen to be shorter than that of the other particles in the core of the flow.

Figure 4. The 2-D instantaneous Lagrangian flow fields in 2H $_2$–O $_2$–7Ar mixture, superimposed with Schlieren density: (a) time from shock passage; (b) longitudinal distance travelled by the Lagrangian particle $x_{i}$; (c) transverse distance travelled by the Lagrangian particle $y_{i}$; (d) distance travelled by the Lagrangian particle $x_{{xy},i}$.

Figure 5. The 2-D instantaneous Lagrangian flow fields in 2H $_2$–O $_2$ mixture, superimposed with Schlieren density: (a) time from shock passage; (b) longitudinal distance travelled by the Lagrangian particle $x_{i}$; (c) transverse distance travelled by the Lagrangian particle $y_{i}$; (d) distance travelled by the Lagrangian particle $x_{{xy},i}$.
In order to compare the distribution of the distances for both mixtures, the average longitudinal distance  $\bar {x}_{i}$ is shown in figure 6. The slopes are different due to the difference in the velocity induced by detonation of both mixtures. The standard deviation for $x_{i}$ (see figure 7a) $[ \sum _i^N (x_{i} - \bar {x}_{i})^2 /N ]^{1/2}$ were almost the same. The average transverse distance $\overline {y}_{i}$ (see figure 7b) can be as high as twice for the non-diluted as compared with the more stable case.

Figure 6. Average longitudinal distance  $\bar {x}_{i}$ for 2H $_2$–O $_2$–7Ar and 2H $_2$–O $_2$ mixtures.

Figure 7. (a) Standard deviation for the longitudinal distance  $[ \sum _i^N (x_{i} - \bar {x}_{i})^2 /N ]^{1/2}$ and (b) average transverse distance $\overline {y}_{i}$ for 2H $_2$–O $_2$–7Ar and 2H $_2$–O $_2$ mixtures.
Figures 8(a,b) and 9(a,b) depict the joint probability density function (p.d.f.) between the times from shock passage and the longitudinal and transverse distances travelled by the particles. The width of the distributions became wider as the time from the shock passage increased. The fluctuations along the transverse distance  $y_{i}$ also increased (see figures 8d and 9d). From figures 8(c,d) and 9(c,d), the peak of the p.d.f. for the fluctuations along the longitudinal direction was lower than that of the transverse direction, meaning that the dispersion along the longitudinal direction was greater than that of the transverse one. This finding that the dispersion along the longitudinal direction was greater than that of the transverse wave was not what could be expected from the presence of the transverse waves, characteristics and cornerstones of the detonation cellular structure. Moreover, the comparison of figures 8(c,d) and 9(c,d) showed that the diluted case needed approximately five times more time to obtain the same level of dispersion than the non-diluted one. Indeed, the average transverse distance $\overline {y_{i}}$ became approximately one cell width after $17.8\,\mathrm {\mu }$s for the argon diluted case as compared with $3.6\,\mathrm {\mu }$s for the other case (figure 7b).

Figure 8. The 2H $_2$–O $_2$–7Ar mixture. Joint p.d.f. between (a) times from shock passage and longitudinal distances $x_{i}$, (b) times from shock passage and transverse distances $y_{i}$. The p.d.f. at different instants for (c) longitudinal distances $x_{i}$ and distances $x_{{xy},i}$, (d) transverse distances $y_{i}$.

Figure 9. The 2H $_2$–O $_2$ mixture. Joint p.d.f. between (a) times from shock passage and longitudinal distances $x_{i}$, (b) times from shock passage and transverse distances $y_{i}$. The p.d.f. at different instants for (c) longitudinal distances $x_{i}$ and distances $x_{{xy},i}$, (d) transverse distances $y_{i}$.
The 2-D instantaneous Lagrangian flow fields of the normalized fluctuations in the longitudinal distance ( $\delta x_{i} = (x_{i}- \bar {x}_{i}) / x_{i}$) and the normalized transverse distance $y_{i}/x_{i}$ have been plotted in figures 10 and 11 for both cases. Near the front, they came mainly from three factors. At first, the triple point collision resulted in forward jets with positive $\delta x_{i}$ and in backward jets with negative values. Second, the decaying incident shock in the second part of the cell induced negative values. Finally, the transverse waves and the vortical motions played a major role in increasing $y_{i}$, the more important contribution coming from the latter, as time passed. Some differences were also present for $\delta x_{i}$ near the boundary layer. The fluctuations appeared spottier in the more unstable non-diluted case, with vortical motions also playing a stronger role in the unstable case.

Figure 10. Diluted 2H $_2$–O $_2$–7Ar mixture. The 2-D instantaneous Lagrangian flow fields, superimposed with Schlieren density in diluted 2H $_2$–O $_2$–7Ar mixture. (a) Normalized fluctuations of the longitudinal distances $(x_{i}- \bar {x}_{i}) / x_{i}$. (b) Normalized transverse distance $y_{i}/x_{i}$.

Figure 11. Non-diluted 2H $_2$–O $_2$ mixture. The 2-D instantaneous Lagrangian flow fields, superimposed with Schlieren density in diluted 2H $_2$–O $_2$–7Ar mixture. (a) Normalized fluctuations of the longitudinal distances $(x_{i}- \bar {x}_{i}) / x_{i}$. (b) Normalized transverse distance $y_{i}/x_{i}$.
Figure 12 shows the time history of the variances of the  $x$- and $y$- displacements $\overline {x'^2_{{i}}}$ and $\overline {y'^2_{{i}}}$, as well as their correlation $\overline {x'_{{i}} y'_{{i}}}$, which can be evaluated by
 \begin{gather} \overline{x'^2_{{i}}} = \frac{1}{N} \sum_{i=1}^N \left[ (x_{{p},i} - x_{{p},i,0}) - \overline{(x_{{p},i} - x_{{p},i,0})} \right]^2 = \frac{1}{N} \sum_{i=1}^N \left( x_{i} - \overline{x_{i}} \right)^2, \end{gather}
 \begin{gather}\overline{y'^2_{{i}}} = \frac{1}{N} \sum_{i=1}^N ( y_{{p},i} - y_{{p},i,0} )^2, \end{gather}
 \begin{gather}\overline{x'_{{i}} y'_{{i}}} = \frac{1}{N} \sum_{i=1}^N \left[ (x_{{p},i} - x_{{p},i,0}) - \overline{(x_{{p},i} - x_{{p},i,0})} \right]\! ( y_{{p},i} - y_{{p},i,0} ). \end{gather}
Here,  $x_{{p},i,0}$ and $y_{{p},i,0}$ are $x$ and $y$ initial positions of the particle $i$, and $N$ is the number of particles.

Figure 12. (a) Time history of the variance of the  $x$- and $y$- displacements, $\overline {x'^2_{i}}$ and $\overline {y'^2_{i}}$; (b) non-dimensionalized $y$- displacements, $\overline {y'^2_{i}} / \overline {x'^2_{i}}$ as a function of the non-dimensionalized time $\tau / \tau _{ind}$; (c) $\overline {x'_{i} y'_{i}} / (\overline {x'^2_{i}} + \overline {y'^2_{i}})$; (d) non-dimensionalized $x$- displacements, $\overline {x'^2_{i}} / (E_{a} /(RT_{vN}) x_{ind} )^2$ as a function of the non-dimensionalized time $\tau / \tau _{ind}$.
The levels of fluctuations of the displacements  $\overline {x'^2_{{i}}}$ and $\overline {y'^2_{{i}}}$ were much higher, approximately twice in the more irregular case (see figure 12a). As shown previously, the fluctuations in $x_{i}$ and $y_{i}$ increased as we move away from the shock (figures 10 and 11). The cross-relation $\overline {x'_{{i}} y'_{{i}}}$ oscillated around zero (see figure 12c). Indeed, the leading shock is curved and thus, for some positive $y$-displacements at some locations, there will be corresponding negative $y$-displacements at other locations. Moreover, in 2-D, for each vortex rotating clockwise, there is another vortex rotating anticlockwise. Near the leading shock, the fluctuations of transverse displacements were approximately that of the longitudinal ones (see figure 12b). Then the $y$-levels decreased comparatively. Thus, far from the shock, the flow became anisotropic. The further evaluation of anisotropy can be found in Appendix B. In the 2-D flows investigated, there lacks the vorticity stretching mechanism that would help to return more rapidly to isotropy (see Taileb Reference Taileb2020). The good collapse of the curves in figure 12(d) suggested that a characteristic time scale was the induction time $\tau _{ind}$ and that a characteristic length scale was the induction length times the reduced activation energy $(E_{a}/(R T_{vN})) x_{ind}$. This scaling used for the fluctuations of $x$-displacement as a function of the time from the shock passage is consistent with asymptotic studies (Buckmaster Reference Buckmaster1989; Lee Reference Lee2008; Faria Reference Faria2014) even if the same characteristic length seemed to hold also for the transverse fluctuations in the present study.
4.2. Dispersion in induction time scale
The dispersion was studied in this subsection within the induction time scale and was related to the cellular structure.
The time sequence of the dispersion in terms of the distance travelled by the Lagrangian particle from shock passage for 2 $\textrm {H}_2$– $\textrm {O}_2$–7Ar and 2 $\textrm {H}_2$– $\textrm {O}_2$ mixtures are depicted in figures 13 and 14, respectively. Only the Lagrangian particles whose time from shock passage is less than the induction time are displayed. When the induction time was longer, the distance travelled $x_{{xy},i}$ which is only shown within the induction time scale was longer.

Figure 13. Time sequence of instantaneous 2-D flow fields of distance travelled from shock passage  $x_{{xy},i}$ in 2 $\textrm {H}_2$– $\textrm {O}_2$–7Ar mixture. Only the Lagrangian particles whose time from shock passage is less than the induction time are displayed. The Lagrangian particles selected for the display were separated by an initial vertical distance of $50\,\mathrm {\mu }$m. The lines are the density Schlieren and the grey contour in the background is the maximum pressure. The detonation propagated from the left to the right and the time passed from (a) to (f).

Figure 14. Time sequence of instantaneous 2-D flow fields of distance travelled from shock passage  $x_{{xy},i}$ in 2 $\textrm {H}_2$– $\textrm {O}_2$ mixture. Only the Lagrangian particles whose time from shock passage is less than the induction time are displayed. The Lagrangian particles selected for the display were separated by an initial vertical distance of $40\,\mathrm {\mu }$m. The lines are the density Schlieren and the grey contour in the background is the maximum pressure. The detonation propagated from the left to the right and the time passed from (a) to (f).
In the 2 $\textrm {H}_2$– $\textrm {O}_2$–7Ar mixture, the first observation is that the induction process was completed within first half of one cell cycle (figure 13). The induction length was shorter behind the Mach stem in the first part of the cell and longer behind the decaying incident shock front in the second part of the cell. After the collision of the transverse waves, the Lagrangian particles, which passed the weaker incident shock completed the induction process. The dispersion was slightly deviated from the straight line parallel to the propagation direction due to the curved leading shock front (Mölder Reference Mölder2016).
In the 2 $\textrm {H}_2$– $\textrm {O}_2$ mixture, more variation in the induction time behind the leading shock front was observed due to higher reduced activation energy (figure 14). The distance in the unburned gas pocket torn from the front was also much longer (see figure 14c,e). The leading shock curvatures were also higher, inducing more deviation.
In both cases, within the induction time scale, the transverse dispersion was mainly due to the curvature of the leading shock. This effect was more pronounced near the edges of the cell and during the first part of the cell, when the leading detonation front was a Mach stem.
To relate the dispersion with the geometry of the cellular structure, the distance travelled by the Lagrangian particle and the normalized number density of Lagrangian particles  $\alpha _{{L}}$ were shown in the position where they recorded their maximum thermicity (see figures 15 and 16). Note that the number density was the projection of Lagrangian data over the Eulerian grid, with a spacing five times greater than the minimum grid width. The number density was then normalized by its initial value at its initial position to obtain $\alpha _{{L}}$,
 \begin{equation} \alpha_{{L}} = \frac{N_{i}}{N_{i,0}}, \end{equation}
where  $N_{i}$ and $N_{i,0}$ are the number of the Lagrangian particles, which are located on the Eulerian grid used for the projection and the number of the Lagrangian particles in the initial condition, respectively. The estimation of other variables on the Eulerian grid, such as the distance travelled by Lagrangian particles, was done by the same projection over a box of width five times the grid cell size (see (4.5)),
 \begin{equation} \overline{\varPhi_{{L}}} = \frac{\displaystyle\sum_{k=1}^{N_i} \varPhi_{{{L}},k}}{N_{i}}. \end{equation}
Here,  $\overline {\varPhi _{{L}}}$ and $\varPhi _{{{L}},k}$ are the projected Lagrangian value and the Lagrangian value for the $k$th Lagrangian particle, which were located on the Eulerian grid, respectively. The distributions of the distance travelled by Lagrangian particle and the number density at the induction time can be seen to be closely related to the cellular structure (see figures 15, 16, 2c, 3c). There are regions in the cellular structure where the Lagrangian particles did not complete the induction process (figures 15, 16). From the instantaneous flow fields, these regions were seen to be thin non-reactive tails in the gas between the leading shock front and the transverse waves due to the lower temperature, which were reported numerically by Gamezo et al. (Reference Gamezo, Vasil'ev, Khokhlov and Oran2000) and observed experimentally by Xiao & Radulescu (Reference Xiao and Radulescu2020) in a hydrogen–oxygen–argon mixture.

Figure 15. The 2-D flow fields of the projected Lagrangian values in the position where the Lagrangian particles experienced the maximum thermicity in 2 $\textrm {H}_2$– $\textrm {O}_2$–7Ar mixture. (a) Projected longitudinal distance travelled $x_{{i}}$ at the induction time; (b) projected transverse distance travelled $y_{{x,i}}$ at the induction time; (c) ratio of transverse distance to longitudinal distance $y_{{i}} / x_{{i}}$ at induction time; (d) number density of Lagrangian particles normalized by the initial number density. The displayed region is the same as in figure 2(c). The region where no Lagrangian particle was located was displayed as white colour.

Figure 16. The 2-D flow fields of the projected Lagrangian values in the position where the Lagrangian particles experienced the maximum thermicity in 2 $\textrm {H}_2$– $\textrm {O}_2$ mixture. (a) Projected longitudinal distance travelled $x_{{i}}$ at the induction time; (b) projected transverse distance travelled $y_{{i}}$ at the induction time; (c) ratio of transverse distance to longitudinal distance $y_{{i}} / x_{{i}}$ at induction time, (d) number density of Lagrangian particles normalized by the initial number density. The displayed region is the same as in figure 3(c). The region where no Lagrangian particle was located was displayed as white colour.
The longitudinal distance  $x_{i}$ tended to be larger at the end of the cell (figures 15a, 16a), due to the decaying shock wave. Near the edge of the cells, the transverse distance $y_{i}$ was comparable to the longitudinal distance travelled $x_{i}$, due to the transverse waves (figures 15b, 16b). The ratio $y_{i}/x_{i}$ was also the highest near edges (figures 15c, 16c), and increased as the mixture became more unstable. This ratio was also minimum at the centreline of the cell.
The propagation of the cellular detonation dispersed the Lagrangian particles and their distribution was non-uniform (figures 15d, 16d). The Lagrangian particles were locally accumulated the trajectory of the triple points. Fewer Lagrangian particles were found inside the cells.
In the weakly unstable 2 $\textrm {H}_2$– $\textrm {O}_2$–7Ar mixture, the number density of Lagrangian particles was the highest between the collision of the transverse waves and the triple point collision. The accumulation of Lagrangian particles at the collision point of the transverse waves gave birth to the local explosion, which induced blast waves driving the cellular structure, as modelled by Vasilev & Nikolaev (Reference Vasilev and Nikolaev1978) and Crane et al. (Reference Crane, Shi, Lipkowicz, Kempf and Wang2021).
In addition, there were some differences in the simulation results. The transverse waves accumulated the Lagrangian particles along the triple point trajectory and the other particles completed the induction process inside the cell in the simulation. This observation was in line with the previous analysis by Strehlow (Reference Strehlow1970) that the major source of the energy that produced the blast wave came from the transverse shock waves. As the mixture instability increased, the contribution of the transverse waves in the accumulation of the Lagrangian particles experiencing the maximum thermicity increased (figures 15d, 16d). In the 2H $_2$–O $_2$ mixture, some of the strong transverse waves accumulated the particles along the triple point trajectories at the same level as near the transverse wave collision. In addition, the normalized number density can become locally higher as compared with the highest values of the diluted case.
The differences between the physical picture of the model (Vasilev & Nikolaev Reference Vasilev and Nikolaev1978; Crane et al. Reference Crane, Shi, Lipkowicz, Kempf and Wang2021) and the simulation results were more apparent in the 2 $\textrm {H}_2$– $\textrm {O}_2$ mixture than in the 2 $\textrm {H}_2$– $\textrm {O}_2$–7Ar mixture. These additional features on the accumulation and the dispersion of the Lagrangian particles in the induction time scale revealed in this study can provide guidelines for the development of a model for the prediction of the cellular structure and their size.
The p.d.f. for the values at the induction time were depicted in figure 17. The distribution of normalized  $x_{{i}}$ at the induction time became wider as the mixture instability increased due to the variation of the induction time behind the cellular detonation front by the higher reduced activation energy and the presence of unburned gas pockets (figure 17a,b). The distribution of $y_{{i}} / x_{{i}}$ was also wider and its average value was larger for the non-diluted mixture, due to stronger transverse waves (figure 17a–c). High values of $y_{{i}} / x_{{i}}$ with small $x_{{i}}$ could be found around the triple point trajectories, due to stronger transverse motion by stronger transverse waves (figures 15c, 16c, 17a,b). As $x_{{i}}$ increased, $y_{{i}} / x_{{i}}$ decreased (see figures 12b, 17a,b).

Figure 17. The p.d.f. for the values at the induction time. (a) Joint p.d.f. between normalized  $x_{{i}} / \hat {x}_{{i}}$ and $y_{{i}} / x_{{i}}$ in 2 $\textrm {H}_2$– $\textrm {O}_2$–7Ar mixture; (b) joint p.d.f. between normalized $x_{{i}} / \hat {x}_{{i}}$ and $y_{{i}} / x_{{i}}$ in 2 $\textrm {H}_2$– $\textrm {O}_2$ mixture; (c) p.d.f. for $y_{{i}} / x_{{i}}$; (d) p.d.f. for normalized number density. $\hat {x}_{{i}}$ is the average of $x_{i}$ at induction time over the whole computational domain.
The peak for distribution of  $y_{{i}} / x_{{i}}$ at the induction time was located around 0.1 (figure 17c) and the deviation of the trajectories of particles from the straight line in the induction time scale was not large, as seen in figures 13 and 14. The p.d.f. for the normalized number density of Lagrangian particles is depicted in figure 17(d). It had three and two peaks for diluted and non-diluted cases, respectively. For the diluted case, the first peak corresponded to particles inside the cell, which were the most and which are in the dilute side (values lower than one). The second peak corresponded to the trajectories of the triple points and the third one to the locations between the collisions of the transverse waves and of the triple points. These two latter peaks are in the dense side (values greater than one). For the non-diluted case, only two peaks can be highlighted. The first peak corresponded to the particles inside the cell, as in the diluted case. The second peak corresponded more or less to a merge between the second and third peaks of the diluted case.
The results in §§ 4.1 and 4.2 highlighted that the dispersion of the Lagrangian particles was promoted behind the detonation front. The fact that the scaling for the variance of the  $x-$displacement $\overline {x'^2_{{i}}}$ worked well using $(E_{a}/(R T_{vN})) x_{ind}$ suggested that the dispersion mainly came from a 1-D instability mechanism (figure 12d), mainly due to the pulsations of the leading shock.
The curvature of the leading shock front was responsible for the transverse dispersion of the particles (Mölder Reference Mölder2016), deviating the particles from horizontal detonation propagation direction (figures 13 and 14). Moreover, another source of transverse dispersion came from the presence of the reaction front. The value of  $\overline {y'^2_{{i}}} / \overline {x'^2_{{i}}}$ was maximum around 2 $\tau _{ind}$ in the simulation results, which was indicative that the dispersion in the transverse direction increased around the reaction front (figure 12b). Indeed, Buckmaster & Ludford (Reference Buckmaster and Ludford1986) showed in a study on linear stability of steady, plane, overdriven detonation that the transverse velocity arose from the transverse derivative of the horizontal distance between the locations of the leading shock and the reaction front. Transverse waves clearly contributed to increase these effects (Emmons Reference Emmons1958).
In addition, jets induced fluctuations in the longitudinal dispersion (figures 10 and 11). The role of the jets on the fluctuations in the dispersion are expected to become more important for mixtures with lower isentropic coefficient at vN state (Lau-Chapdelaine, Xiao & Radulescu Reference Lau-Chapdelaine, Xiao and Radulescu2021; Sow et al. Reference Sow, Lau-Chapdelaine and Radulescu2021; Taileb et al. Reference Taileb, Meluguizo-Gavilances and Chinnayya2021b).
4.3. Relative dispersion
The dispersion behind the front was further evaluated in terms of the relative dispersion in this subsection. The initial distance between two Lagrangian particles in the same pair was set to be the grid size upstream of the leading front, which is the minimum grid width. To distinguish the relative dispersion in the longitudinal and transverse directions, the following relative dispersions were evaluated:
 \begin{gather} r_{{xy}} = \left[ (x_{{p},i1} - x_{{p},i2})^2 + (y_{{p},i1} - y_{{p},i2})^2 \right]^{1/2}, \end{gather}
 \begin{gather}r_{{x}} = \left| x_{{p},i1} - x_{{p},i2} \right| , \end{gather}
 \begin{gather}r_{{y}} = \left| y_{{p},i1} - y_{{p},i2} \right| . \end{gather}
Here,  $x_{{p},i1}$ and $y_{{p},i1}$ are $x$ and $y$ positions of the particle i1, and $x_{{p},i2}$ and $y_{{p},i2}$ are $x$ and $y$ position of the particle i2 which forms the pair with particle i1.
The 2-D Lagrangian instantaneous flow fields for the relative dispersion for both mixtures are shown in figures 18 and 19. The relative dispersion  $\overline {r^2}_{xy}$ was the average value at the time from shock passage. The displayed value of $r_{xy}^2$ for each particle was the value averaged over its four pairs. Two main factors contributed to the highest values. First, the particles with higher relative dispersion experienced the shear layers emanating from the triple shock interaction and their curling to form the large-scale turbulent eddies. The second factor came from the presence of the boundary layer due to the velocity gradient. The normalized deviation from the average $(r^2_{xy}- \overline {r_{xy}}^2) / r^2_{xy}$ highlighted these two main contributions (figures 18b and 19b). The relative dispersion was higher for the irregular mixture (figures 18a and 19a), with particles with higher relative dispersion being more dispersed inside the channel.

Figure 18. Diluted 2H $_2$–O $_2$–7Ar mixture. The 2-D instantaneous Lagrangian flow fields, superimposed with Schlieren density. (a) Square of the relative dispersion $r_{xy}^2$; (b) normalized fluctuation of the square of the relative dispersion $(r^2_{xy}- \overline {r^2}_{xy}) / r^2_{xy}$.

Figure 19. Non-diluted 2H $_2$–O $_2$ mixture. The 2-D instantaneous Lagrangian flow fields, superimposed with Schlieren density. (a) Square of the relative dispersion $r_{xy}^2$; (b) normalized fluctuation of the square of the relative dispersion $(r^2_{xy}- \overline {r^2}_{xy}) / r^2_{xy}$.
Figure 20 shows the square of average relative dispersion for 2 $\textrm {H}_2$– $\textrm {O}_2$–7Ar and 2 $\textrm {H}_2$– $\textrm {O}_2$ mixtures. The Lagrangian Favre average used for figure 20(d) based on the time from shock passage is described in § 4.4. In both mixtures, the average of $r_{x}$ is higher than of $r_{y}$, highlighting again the anisotropy downstream of the leading front (figure 20a).

Figure 20. Time history of the average relative dispersion for 2 $\textrm {H}_2$– $\textrm {O}_2$–7Ar and 2 $\textrm {H}_2$– $\textrm {O}_2$ mixtures. (a) Square of average relative dispersion $\overline {r_{x}}^2$, $\overline {r_{y}}^2$, $\overline {r_{xy}}^2$, as a function of time passage $\tau$; (b) logarithm of $\overline {r_{xy}}^2 / \overline {r_{xy,0}}^2$ compensated by $\tau$; (c) time history of normalized $(\overline {r_{xy}}/ (\chi x_{ind} ))^2$ compensated by normalized $(\tau / \tau _{ind})^3$; (d) $x$-velocity fluctuations $\sqrt {\widetilde {u'^2}}$. Here $\overline {r_{xy,0}}$ is the initial value for $r_{xy}$.
After some time, corresponding to some  $\mathrm {\mu }$s and far from the leading shock, a self-similar behaviour for both mixtures was found when the mean relative dispersion $\overline {r}_{xy}$ was scaled by the characteristic length scale $\chi x_{ind}$. The $(E_{a}/(RT_{vN})) x_{ind}$ length scale used in § 4.1 was not found to give nice results. Indeed, the relative dispersion of nearby particles is related to their difference of velocities that could be a result of the acceleration of reactive fronts, which is reflected by the non-dimensionalized acceleration parameter $\chi$ (Sharpe Reference Sharpe2002; Radulescu, Sharpe & Bradley Reference Radulescu, Sharpe and Bradley2013; Tang & Radulescu Reference Tang and Radulescu2013). Moreover, compensated by $(\tau /\tau _{ind})^3$, the non-dimensionalized pair dispersion from figure 20(c) agreed with the Richardson–Obukhov (R-O) law (Richardson Reference Richardson1926; Salazar & Collins Reference Salazar and Collins2009), meaning that $( r_{xy} / ( \chi x_{ind} ) )^2$ scaled as $\sim (\tau /\tau _{ind})^3$. Darragh et al. (Reference Darragh, Towery, Poludnenko and Hamlington2021) in another context of high-speed premixed flames also found such scalings within some range but with different scalings. The exponential time dependence for inert flow (Babiano et al. Reference Babiano, Basdevant, Roy and Sadourny1990) did not hold (see figure 20b) for the lower times, the constant spanning over more than one order of magnitude. Indeed, the latter zone was the zone of the main heat release (see § 4.4 and Appendix C for further details on the estimation).
Figure 21 indicates the derivative of the relative dispersion with respect to time. The local exponent value is 3.77 ( $50 < \tau / \tau _{ind}< 80$) and 3.38 ( $20 <\tau / \tau _{ind}<40$) for the diluted and non-diluted case, respectively. However, the non-dimensionalized time $\tau / \tau _{ind}$ corresponding to the hydrodynamic thickness for both mixtures was around 50 (see Appendix C). Therefore, only the unstable case approached the R-O prediction within the detonation driving zone. The diluted case approached the R-O prediction only around the mean sonic surface. The initial distance in the stable case was larger than that in the unstable case, so the relaxation to the R-O scaling may also take longer (Bourgoin et al. Reference Bourgoin, Ouellette, Xu, Berg and Bodenschatz2006).

Figure 21. The 2 $\textrm {H}_2$– $\textrm {O}_2$–7Ar and 2 $\textrm {H}_2$– $\textrm {O}_2$ mixtures. (a) Time evolution of $(\overline {r_{xy}}/ (\chi x_{ind} ))^2$; (b) local scaling exponent of $\overline {r_{xy}}^2$ from $\mathrm {d} [ \log {(\overline {r_{xy}}/ ( \chi x_{ind} ))^2} ] / \mathrm {d} [ \log {(\tau / \tau _{ind})} ]$.
The R-O law reads  $r^2_{xy} / \tau ^3 \sim \langle \epsilon \rangle$, with $\langle \epsilon \rangle$ being the turbulent energy dissipation rate (Salazar & Collins Reference Salazar and Collins2009). One can thus estimate $\langle \epsilon \rangle \sim \langle \delta u \rangle ^2 / \tau _{ind}$ as the ratio between the square of the $x$-velocity fluctuations $\delta u$ and an induction time $\tau _{ind}$. From figure 20(d), the ratio of the velocity fluctuations between the diluted and non-diluted cases after the induction and reaction zones is ${\sim }2$. Another estimation came from the turbulent energy dissipation rates $\langle \delta u \rangle _{non\text {-}diluted} / \langle \delta u \rangle _{diluted} \sim [ \langle \epsilon \rangle _{non\text {-}diluted} / \langle \epsilon \rangle _{diluted} \times \tau _{ind,non\text {-}diluted} / \tau _{ind,diluted} ]^{1/2} \sim 3$. This very good correspondence from such rough estimates seemed to indicate that after the main heat release zone, the more unstable the mixture was, the more turbulent the flow can be considered to be.
To evaluate the distribution in the relative dispersion, the p.d.f. for the relative dispersion  $r_{xy}$ is depicted in figure 22 for the diluted and non-diluted mixtures, respectively. The curves for the diffusive limit and the inertia regime were also included in figure 22(c–f) for comparison. These equations are recalled in Appendix C. The distribution becomes wider as the time from the shock passage increased (figure 22a,b). The same levels of relative dispersion were obtained much more rapidly in the non-diluted case. The relative dispersion is strongly non-Gaussian, with long tails developing, indicative of rare events. In figure 22(c–f), the relative dispersion has been rescaled by $\overline {r_{xy}}$ and a reasonably good collapse of the curves was obtained, showing that the process was self-similar in time, except for the rare events. A good fit for the tails of the p.d.f.s reads $A\exp {(-\alpha (r_{xy}/\overline {r_{xy}})^\beta )}$ (Jullien et al. Reference Jullien, Paret and Tabeling1999) and their coefficients are given in table 2. The exponent was approximately 0.35 and applied well for values of $r_{xy}/\overline {r_{xy}}$ between 5 and 15 for the diluted mixture, and was approximately 0.63 for values of $r_{xy}/\overline {r_{xy}}$ between 2 and 8 for the non-diluted one. The exponent for the unstable case agreed very well with Richardson's proposal of 2/3 (Richardson Reference Richardson1926) while that in the diluted case was below the latter value. The normalized relative dispersion for the non-diluted was less steep and higher for the most probable events in the intermediate range (see values of the fitted function in table 2), consistent with the fact that the mixture was considered to be more unstable near the leading shocks based on the reduced activation energy and $\chi$ parameters. What was more surprising was the presence of very rare events with high levels of relative dispersion for the diluted and regular case.

Figure 22. (a,c,e) The 2H $_2$–O $_2$–7Ar mixture; (b,d,f) 2H $_2$–O $_2$ mixture. (a,b) The p.d.f. for relative dispersion $r_{xy}$; (c,d) p.d.f. for $r_{xy}/\overline {r_{xy}}$; (e,f) enlarged view of p.d.f. for $r_{xy}/\overline {r_{xy}}$.
Table 2. Coefficients of the function approaching the p.d.f. of the normalized relative dispersion  $r_{xy}/\overline {r_{xy}}$: $\mathrm {p.d.f.}=A\exp {(-\alpha (r_{xy}/\overline {r_{xy}})^\beta )}$ (Jullien, Paret & Tabeling Reference Jullien, Paret and Tabeling1999). The Richardson's prediction gives $\beta ={2/3}$.

The probability of rare events was higher than that of Richardson's prediction (Buaria, Sawford & Yeung Reference Buaria, Sawford and Yeung2015) (see figure 22e,f). In the derivation of the p.d.f. by Richardson, the dispersion process was described by a diffusive equation. This modelling was based on two assumptions (Boffetta & Sokolov Reference Boffetta and Sokolov2002). The first one is that the dispersion process was self-similar in time. In our case, this assumption that the dispersion process was self-similar in time was valid (see figure 22c–f). The second one was that the velocity field was short correlated in time (Sokolov Reference Sokolov1999). The relative velocity in quasi-Lagrangian coordinates (Boffetta et al. Reference Boffetta, Celani, Crisanti and Vulpiani1999) was then evaluated to check this validity of the latter assumption. The relative velocity in quasi-Lagrangian coordinates  $\boldsymbol {v}^{QL}(\boldsymbol {R},\tau )$ at time from shock passage $\tau$ was defined by the following equation:
 \begin{equation} \boldsymbol{v}^{QL}(\boldsymbol{R},\tau) = \boldsymbol{v}(\boldsymbol{r_1}(\tau)+\boldsymbol{R},\tau) - \boldsymbol{v}(\boldsymbol{r_1}(\tau),\tau). \end{equation}
Here,  $\boldsymbol {v}(\boldsymbol {r},\tau )$ is the Eulerian velocity field ( $u,v$) at the position $\boldsymbol {r}$ and the time from the shock passage $\tau$. The position of the Lagrangian particles at the time from the shock passage $\tau$ is $\boldsymbol {r_1}(\tau )$. The separation distance is $\boldsymbol {R}$. Note that only the particles that have passed the shock were taken into account. The velocities were obtained by interpolation of three nearby Eulerian cells (2.36).
The relative velocity in quasi-Lagrangian coordinates as a function of separation distance for 2 $\textrm {H}_2$– $\textrm {O}_2$–7Ar and 2 $\textrm {H}_2$– $\textrm {O}_2$ mixtures is shown in figure 23. When the separation distance was greater than the induction length, $(\boldsymbol {v}^{QL}(\boldsymbol {R},\tau ))^2$ was constant. However, when the separation distance was less than the induction length, regardless of the mixture regularity and time from shock passage, the square of relative velocity in quasi-Lagrangian coordinates was proportional to square of the separation distance, i.e. $(\boldsymbol {v}^{QL}(\boldsymbol {R},\tau ))^2 \propto (\boldsymbol {R}/x_{ind})^2$. This exponent of 2 was much higher than the exponent of 2/3, which is expected for the case of the Kolmogorov turbulence. Therefore, the velocity field behind the detonation front was not short time correlated. Thus, the dispersion process cannot be described by the diffusive equation proposed by Richardson. The probability of the rare event in the relative dispersion was then different from Richardson's prediction. In addition, the present finding that the velocity field behind the detonation front was different from that in the Kolmogorov turbulence can help us to develop a turbulent model for detonation. Indeed, Maxwell et al. (Reference Maxwell, Bhattacharjee, Lau-Chapedlaine, Falle, Sharpe and Radulescu2017) conducted a numerical simulation with a compressible linear eddy model for large-eddy simulation for the highly unstable mixture of methane–oxygen. They had to increase the Kolmogorov constant from the theoretical prediction for incompressible 3-D Kolmogorov turbulence to match the experimental results. In addition, in 2-D simulations of the transition of a turbulent shock-flame complex to detonation, Maxwell, Pekalski & Radulescu (Reference Maxwell, Pekalski and Radulescu2018) decreased this constant. These changes of the constant may come from the fact that the velocity field behind the detonation was not that of a Kolmogorov turbulence.

Figure 23. Square of relative velocity in quasi-Lagrangian coordinate as a function of separation distance normalized by induction length for various time from shock passage. (a) The 2H $_2$–O $_2$–7Ar mixture; (b) 2H $_2$–O $_2$ mixture. The black solid line is the curve with slope of 2 and the black broken line is the curve with slope of 2/3.
The fact that the velocities were not short correlated below the induction length, and that the relative dispersion scaled with the  $\chi$ parameter suggested that within the detonation driving zone, the heat release played a significant role. Indeed, $\chi = (x_{ind}/x_{reac}) (E_a/ (R T_{vN})) \propto (T/x_{reac})((\partial x_{ind} / \partial T)_{vN})$ is related to the rather rapid energy deposition, which promotes the dispersion of the particles on the reaction length scale.
The other possible reason for the departure of the probability of the rare event in the relative dispersion from Richardson's theory was the extreme events of the pair separating much faster and slower than the average. Scatamacchia, Biferale & Toschi (Reference Scatamacchia, Biferale and Toschi2012) reported in 3-D incompressible homogeneous and isotropic turbulence that the extreme events making much faster pair separation and much slower pair separation than the average induced the deviation from the behaviour in Richardson's theory. The relative dispersion behind the detonation front was much higher than the average for the Lagrangian particles, which experienced the shear layers emanating from the triple shock interaction and which were located in the boundary layer. The other particles separated much slower (figures 18, 19). The possible effect of the presence of slip lines and boundary layers (figures 18, 19) on the higher possibility of the rare event was estimated by making a p.d.f. from the data with and without their presence. The criterion to distinguish the higher relative dispersion due to the slip lines and boundary layers was that the normalized fluctuation of the square of the relative dispersion  $(r^2_{xy}- \overline {r_{xy}}^2) / r^2_{xy}$ was higher than $-0.95$.
To evaluate the distribution in the relative dispersion for the data with and without the presence of the slip lines and boundary layers, a new p.d.f. for the normalized relative dispersion for the new set of data is depicted in figure 24. Regardless of the data based on the value of  $(r^2_{xy}- \overline {r_{xy}}^2) / r^2_{xy}$, the shapes of the p.d.f. were the same as in figure 22(e,f) and probability of the rare event in the relative dispersion remained higher than that from Richardson's theory. The same conclusion was obtained if the threshold was changed from $-$0.95 to 0.95 (not shown here). Thus, the presence of the slip lines and boundary layers was not the main factor for the probability of rare events in the relative dispersion to be higher than that from Richardson's prediction in the flow field behind the detonation front.

Figure 24. The p.d.f. for  $r_{xy}/\overline {r_{xy}}$ from the categorized data (without slip lines and boundary layers) based on the value of $(r^2_{xy}- \overline {r_{xy}}^2) / r^2_{xy}$: (a,b) 2H $_2$–O $_2$–7Ar mixture; (c,d) 2H $_2$–O $_2$ mixture. (a,c) The p.d.f. for $r_{xy}/\overline {r_{xy}}$ from the data whose $(r^2_{xy}- \overline {r_{xy}}^2) / r^2_{xy}$ is higher than $-$0.95; (b,d) p.d.f. for $r_{xy}/\overline {r_{xy}}$ from the data whose $(r^2_{xy}- \overline {r_{xy}}^2) / r^2_{xy}$ is lower than $-$0.95.
Another possible reason for this difference in the p.d.f. of the relative dispersion is that the turbulence has two cascades: an upward cascade coming from exothermic reactions and the downward Kolmogorov-like cascade (Radulescu Reference Radulescu2003; Radulescu et al. Reference Radulescu, Sharpe, Lee, Kiyanda, Higgins and Hanson2005). In addition, the dispersion is slightly anisotropic in our 2-D case (see § 4.1), which can explain the deviations from results of isotropic turbulence (Xia et al. Reference Xia, Francois, Faber, Punzmann and Shats2019). Moreover, the curves in the p.d.f. in the simulation are different from that in the diffusive regime.
4.4. Eulerian and Lagrangian averaging procedures
As a result of the dispersion, the same distance from the mean leading shock can be reached by several Lagrangian particles at different times, travelling different distances. Figures 25 and 26 depict the joint p.d.f. between the longitudinal distance from the shock  $x_{s}$ and (a) the time from shock passage $\tau$ and (b) the distance travelled by the particle $x_{xy,i}$. The width of the distribution for $\tau$ and $x_{xy,i}$ at fixed $x_{s}$ increased as we moved away from the shock and as the mixture instability increased. A double peak can be observed in the regular case, whereas the dispersion became more uniform in the irregular case.

Figure 25. Distribution of  $\tau$ and $x_{xy,i}$ as a function of the longitudinal distance from shock front in 2H $_2$–O $_2$–7Ar mixture. (a) Joint p.d.f. between the longitudinal distance from shock front $x_{s}$ and time from shock front passage $\tau$, (b) joint p.d.f. between $x_{s}$ and the distance travelled by the particle along the trajectory $x_{xy,i}$; (c) p.d.f. of $x_{s}$ at several $\tau$; (d) p.d.f. of $x_{s}$ at several $x_{xy,i}$.

Figure 26. Distribution of  $\tau$ and $x_{xy,i}$ as a function of the longitudinal distance from shock front in 2H $_2$–O $_2$ mixture. (a) Joint p.d.f. between the longitudinal distance from shock front $x_{s}$ and time from shock front passage $\tau$. (b) Joint p.d.f. between $x_{s}$ and the distance $x_{xy,i}$; (c) p.d.f. of $x_{s}$ at several $\tau$, (d) p.d.f. of $x_{s}$ at several $x_{xy,i}$.
This subsection presents the comparison of the Favre average 1-D profiles in terms of Eulerian and Lagrangian points of view on the mean structure for the gaseous detonation. The Reynolds average values in the Eulerian mean procedure  $\bar {G}_{\textrm {EUL}}$ for the variable $G$ are computed by (Watanabe et al. Reference Watanabe, Matsuo, Chinnayya, Matsuoka, Kawasaki and Kasahara2020)
 \begin{equation} \bar{G}_{\textrm{EUL}}(x_{s}) = \frac{1}{H} \int^H_0 \lim_{T_{{s}}\rightarrow \infty} \left( \frac{1}{T_{s}} \int_0^{T_{s}} G(x-x_{shock}(y,t),y,t) \,\mathrm{d}t \right) \mathrm{d}y. \end{equation}
Here,  $x_{shock}(y,t)$ is the instantaneous $x$ position of the leading shock front, which is not straight due to cellular instabilities, $H$ is the channel width and $T_{s}$ is the period of sampling, respectively. The longitudinal distance from the leading shock front $x_{s} = x-x_{shock}$ perpendicular to the propagation direction is used for the Eulerian averaging process. The time from the shock passage $\tau$ and the distance $x_{xy}$ travelled by the Lagrangian particle from shock passage can thus be also candidates for the Lagrangian averaging procedures. Two Lagrangian average procedures have been proposed. The first consisted in computing the Reynolds average values in the Lagrangian mean procedure based on the time from shock passage $\bar {G}_{{\textrm {LAG}},{time}}$, as in (4.11); the second one consisted in computing the Reynolds average values in the Lagrangian average procedure based on the distance travelled by Lagrangian particle $\bar {G}_{{\textrm {LAG}},{dist}}$, as in (4.12),
 \begin{gather} \bar{G}_{{\textrm {LAG}},{time}}(\tau) = \frac{1}{N} \sum^N_{i=1} G_{i}(\tau), \end{gather}
 \begin{gather}\bar{G}_{{\textrm {LAG}},{dist}}(x_{{xy}}) = \frac{1}{N} \sum^N_{i=1} G_{i}(x_{{xy}}), \end{gather}
where  $G_{i}$ is the value of the parameter at hand on particle i, $\tau =t-t_{shock}$ is the time elapsed from shock passage, $x_{{xy}}$ is the postshock distance travelled by the particle and $N$ is the number of particles sampled.
Then, from the different Reynolds averaging procedures, the Favre average quantities can be obtained from Reynolds averaged conservative variables  $\tilde {\eta }=\overline{\rho \eta }/\bar {\rho }$, where $\eta$ is the conservative variable (Favre Reference Favre1965).
In order to enable the comparison between  $\bar {G}_{\textrm {EUL}}$ and $\bar {G}_{{\textrm {LAG}},{time}}$, we need to map the time elapsed from shock passage up to the longitudinal distance from the shock location $x_{s,time}$. The following mapping will be used in (4.11):
 \begin{equation} x_{s,time} = \int_0^\tau (\bar{D} - \tilde{u} )\,\mathrm{d}\tau. \end{equation}
Here,  $\bar {D}$ is the average propagation velocity of the detonation front and is equal to $D_{CJ}$ in the present simulation conditions. In order to map the distance travelled by the Lagrangian particle from the shock passage to the longitudinal distance from the shock location based on the distance travelled by the Lagrangian particle $x_{s,dist}$, the following mapping will be used in (4.12) for $\bar {G}_{{\textrm {LAG}},{dist}}$:
 \begin{equation} x_{s,dist} = \int_0^\tau (\bar{D} - \tilde{u} )\,\mathrm{d}t\quad \text{such as }\quad \mathrm{d}t = \mathrm{d}\kern0.7pt x_{xy} / \left[ \tilde{u}^2+\tilde{v}^2 \right]^{1/2}. \end{equation}
Here,  $\tilde {u}$ and $\tilde {v}$ are the Lagrangian Favre averages of the $x$ and $y$ components of the velocity in the laboratory frame. Figure 27 depicts the relations (4.13) and (4.14) between the distance from the shock front, the time from shock passage and the longitudinal distance from shock location. The results of the two Lagrangian procedures and the ZND model agreed well with each other, meaning that the procedures to convert the target values used in the Lagrangian procedures into the longitudinal distance from the shock front are appropriate.

Figure 27. Lagrangian Favre average 1-D profiles for both mixtures (a)  $x_{s}$ / $x_{ind}$ and $\tau$, (b) $x_{s}$ / $x_{ind}$ and $\tau$/ $\tau _{ind}$.
The effects of the distance travelled by the particle and the time elapsed from the shock passage are not taken into account in the Eulerian procedure. However, the time elapsed from the shock passage is more relevant as far as chemical reactions are concerned. There are also differences between the two Lagrangian procedures. Indeed, the difference is more apparent especially in the boundary layer. Due to the lower velocity in the boundary layer, the distance  $x_{xy}$ does not increase as that in the core of the flow, for the same time elapsed from shock passage.
The comparison of the Favre average 1-D profiles in the instantaneous shock frame for 2 $\textrm {H}_2$– $\textrm {O}_2$–7Ar and 2 $\textrm {H}_2$– $\textrm {O}_2$ mixtures are depicted in figures 28 and 29, respectively. The frozen sound speed was used to estimate the Mach number in figures 28(d) and 29(d). The trends for the profiles of pressure, temperature and Mach number were nevertheless similar regardless of the Favre average procedure, either from the Eulerian or the Lagrangian point of view. Slight oscillations in Lagrangian Favre averages are observed near the front for the diluted case. In all cases, the profiles differed from that of the ZND solution. Indeed, Radulescu et al. (Reference Radulescu, Sharpe, Law and Lee2007) and Sow et al. (Reference Sow, Chinnayya and Hadjadj2014) showed that the fluctuations delayed the energy deposition. Lalchandani (Reference Lalchandani2022) developed a physical model that explained the slower rate of the heat release by the decaying of the shock velocity inside the cell.

Figure 28. Favre average 1-D profiles in 2 $\textrm {H}_2$– $\textrm {O}_2$–7Ar mixture for (a) pressure, (b) temperature, (c) thermicity, (d) Mach number, (e) $\textrm {H}_2$ mass fraction, (f) OH mass fraction, and (g) $\textrm {H}_2$O mass fraction.

Figure 29. Favre average 1-D profiles in 2 $\textrm {H}_2$– $\textrm {O}_2$ mixture for (a) pressure, (b) temperature, (c) thermicity, (d) Mach number, (e) $\textrm {H}_2$ mass fraction, (f) OH mass fraction, and (g) $\textrm {H}_2$O mass fraction.
As for the regular case (figure 28), the distributions of the chemical species, the thermicity and the other variables in Lagrangian and Eulerian results were almost identical. On the other hand, as for the irregular case, the width of the thermicity was wider (figures 28c,e,f,g and 29c,e,f,g). The increasing part of the curves was similar, whereas differences were apparent in the decreasing part of the thermicity, after its peak. All the other profiles then followed the same trend: Eulerian results matched the Lagrangian results before the peak of thermicity, with Lagrangian results decreasing more smoothly afterwards. Fewer differences were observed in the pressure and Mach number profiles. The maximum differences for the H $_2$ mass fraction were located after the peak of thermicity. They reached 12 % and 18 % between the Eulerian and Lagrangian time and distance averages for the diluted mixture and increased up to 33 % and 36 % for the other mixture.
Based on the reduced activation energy and the related stability analysis for the emergence of longitudinal disturbances in 1-D cases, the mixtures could be classified as weakly and mildly unstable. Transverse disturbances then came into play in 2-D configurations. As argued at first by Radulescu et al. (Reference Radulescu, Sharpe, Law and Lee2007) and by many others (Maxwell et al. Reference Maxwell, Bhattacharjee, Lau-Chapedlaine, Falle, Sharpe and Radulescu2017; Taileb et al. Reference Taileb, Reynaud, Chinnayya, Virot and Bauer2018; Reynaud et al. Reference Reynaud, Taileb and Chinnayya2020; Sow et al. Reference Sow, Lau-Chapdelaine and Radulescu2021), the fluctuations and the induced dispersion explain the differences between the mean quantities from numerical simulations and the ZND results. All dispersion quantities ( $\overline {x'^2_{i}}$, $\overline {y'^2_{i}}$), when non-dimensionalized by $(E_{a}/(RT_{vN})) x_{ind}$ were found to be self-similar in the time $\tau /\tau _{ind}$. This good agreement suggests that the dispersion could result from a 1-D instability mechanism only. It may thus originate from the fluctuations of the leading shocks that induce the induction and reaction length fluctuations, with transverse waves being a necessary corollary.
On the other hand, the relative dispersion was also found to be self-similar in the time  $\tau /\tau _{ind}$, after the main heat release zone, when the relative dispersion was normalized by $\chi x_{ind}$, with $\chi$ considered as a dimensionless acceleration. Both mixtures lie on either side on the neutral stability curve. Small values of $\chi$ imply that the pulses of heat release of neighbouring particles will overlap (Radulescu Reference Radulescu2003). On the other hand, if this $\chi$ parameter is larger, gas-dynamic instabilities result from the lack of coherence of the power pulses and discreteness, and led to the deviations observed in the Eulerian and Lagrangian averaging processes after the peak thermicity for the irregular case.
The value of the specific heat ratio at vN state for the non-diluted case is 1.32 and was very close to the boundary where Mach bifurcation occurs due to jetting after triple point collision (Lau-Chapdelaine et al. Reference Lau-Chapdelaine, Xiao and Radulescu2021; Sow et al. Reference Sow, Lau-Chapdelaine and Radulescu2021), which results in more mixing behind the front. For the range of  $\gamma _{vN}$ investigated in this study, the impact of compressibility (see figure 7 in Sow et al. (Reference Sow, Lau-Chapdelaine and Radulescu2021)) can be estimated to be low.
Figures 30 and 31 show the joint p.d.f. of the fluctuations of the displacements  $x'_{i} = (x_{{p},i} - x_{{p},i,0}) - \overline {(x_{{p},i} - x_{{p},i,0})}$ and $y'_{i} = ( y_{{p},i} - y_{{p},i,0} )$ at a certain instant $t_0$ with that at a later time $t_0+\tau _{c}$, $\tau _{c}$ being equal to $\sim \tau _{HT}/2$ and $\sim 2\tau _{HT}$, where $\tau _{HT}$ is the time corresponding to the hydrodynamic thickness. If the motion were to be Brownian, the shape of the joint p.d.f. would correspond to a circle. Instead, in both cases, the joint p.d.f. lay along positive lines, meaning that they are positively correlated to each other. One can see that the shape of the joint p.d.f. got rounder as time passed, all the more so as we got outside the mean detonation driving zone. Table 3 lists the correlation coefficients for the joint p.d.f. of figures 30 and 31 that were very high.

Figure 30. Joint p.d.f. between displacement fluctuations at  $t_0$ and that at $t_0+\tau _{c}$ in 2H $_2$–O $_2$–7Ar mixture. (a) The $x'_{i}$ displacement fluctuations with $\tau _{c}=5\,\mathrm {\mu }$s, (b) $x'_{i}$ displacement fluctuations with $\tau _{c}=20\,\mathrm {\mu }$s, (c) $y'_{i}$ displacement fluctuations with $\tau _{c}=5\,\mathrm {\mu }$s, (d) $y'_{i}$ displacement fluctuations with $\tau _{c}=20\,\mathrm {\mu }$s.

Figure 31. Joint p.d.f. between displacement fluctuations at  $t_0$ and that at $t_0+\tau _{c}$ in 2H $_2$–O $_2$ mixture. (a) The $x'_{i}$ displacement fluctuations with $\tau _{c}=2\,\mathrm {\mu }$s, (b) $x'_{i}$ displacement fluctuations with $\tau _{c}=8\,\mathrm {\mu }$s, (c) $y'_{i}$ displacement fluctuations with $\tau _{c}=2\,\mathrm {\mu }$s, (d) $y'_{i}$ displacement fluctuations with $\tau _{c}=8\,\mathrm {\mu }$s.
Table 3. Correlation coefficients between displacements at  $t_0$ and at $t_0+\tau _{c}$.

Table 4 lists the characteristic lengths for both mixtures for the different Favre averaging procedures. The induction and reaction lengths were almost the same. The position of the peak thermicity can be captured regardless of the average method. Only a slight variation was observed for the hydrodynamic thickness for the irregular case after the peak thermicity. Therefore, the Eulerian Favre average procedure gave the mean structure of the gaseous detonation with a reasonable accuracy.
Table 4. Characteristic lengths normalized by induction length for 2 $\textrm {H}_2$– $\textrm {O}_2$–7Ar and 2 $\textrm {H}_2$– $\textrm {O}_2$ mixtures. Non-dimensionalized cell widths are added for comparison. The Lagrangian (distance) stands for the averaging process, described by (4.12), (4.14) and Lagrangian (time) refers to procedure based on (4.11), (4.13).

5. Conclusions
Two-dimensional simulations with the Lagrangian particle tracking method were conducted for weakly and mildly unstable hydrogen-based mixtures at ambient conditions. Two new Lagrangian Favre average procedures, based on the distance travelled by the particle or the time from the shock passage were proposed and 1-D profiles were compared with those from the Eulerian procedure, based on the longitudinal distance from the shock front. The integral length was the hydrodynamic thickness that encompasses the mean detonation driving zone from the leading shock to the mean sonic line. The results from the Eulerian and Lagrangian averaging processes gave similar induction length, reaction length and hydrodynamic thickness. The Eulerian results gave the mean structure with a reasonable accuracy. As the mixture instability increased, the Lagrangian results were smoother after the thermicity peak than the Eulerian results.
Dispersion is inherent to the detonation driving zone, due to the fluctuations of the leading shock and its curvature, the presence of the reaction front, transverse waves, forward and backward jets, vortical structures and boundary layer. The latter was minor as the detonation was ideal with no losses. The main findings were that dispersion could be scaled with  $(E_{a}/(RT_{vN})) x_{ind}$ and that the relative dispersion far from the shock, scaled by $\chi x_{ind}$ with $\chi$ as a dimensionless acceleration. The fact that these instability parameters were successful for these scalings strongly suggests that the main mechanism driving the dispersion was the 1-D leading shock fluctuations, i.e. its decaying and amplification upon triple shock collision within the cell. For more highly unstable mixtures with larger $E_{a}/(RT_{vN})$ and $\chi$, the presence of more frequent unburnt pockets of fresh gases along with their burning mechanisms can circumscribe these findings. Moreover, the displacement fluctuations at a given time were positively correlated to the displacement fluctuations at a later time, corresponding to approximately the hydrodynamic thickness time scale.
The dispersion in the induction time scale was closely related to the cellular structure. Particles are not only accumulated between the locations of the transverse wave and triple point collisions but were also along the triple point trajectories. Another finding was that as the mixture instability increased, the contribution of the transverse waves along the triple point trajectories in the accumulation of the particles increased. The differences with the physical picture of cell size model relying on discrete blast dynamics were more apparent.
The induction process was completed within first half of the cell cycle in the diluted case, whereas more variation in the induction time could be found in the non-diluted case due to the higher activation energy and the presence of unburnt pockets. Within the induction time scale, the transverse dispersion was mainly due to the curvature of the leading shock. This effect was more pronounced near the edges of the cell and during the first part of the cell, when the leading detonation front was a Mach stem.
The detonation could be described as a two-scale phenomenon, especially for the unstable mixture. The first scale, of a few induction lengths approximately  $5\sim 10 x_{ind}$, could be related to the main heat release zone, from the shock up to the vicinity of the peak thermicity. The influence of the transverse waves was still present. Indeed, the levels of $y'_{i}$ were approximately those of $x'_{i}$. Then after a transient, a new zone was present. The transverse $y'_{i}$ decreased, leading to small anisotropic dispersion ( $[ \overline {y'^2_{i}} / \overline {x'^2_{i}} ]^{1/2} \sim 0.6$). The Richardson–Obukhov scaling law surprisingly still held, in the zone of small heat release after the peak thermicity, suggesting that classical non-reacting laws of turbulence may remain relevant. Only the unstable case approached the R-O scaling within the mean detonation driving zone.
The dispersion of the Lagrangian particles was promoted behind the detonation front. We could try to sort out the production of these fluctuations:  $x$ displacements due to the decaying detonation front (1-D instability mechanism), then $y$ displacements due to the curvature of the leading inert shock front and the presence of the reaction front (due to density ratio). The variation of the distance between the leading shock and the reaction front in the transverse direction induced further transverse dispersion (maximum of $\overline {y'^2_{{i}}}/\overline {x'^2_{{i}}}$ around $2 \tau _{ind}$). Even if the reactive transverse waves were present in the diluted case, and some unburnt pockets in the non-diluted case, these differences do not manifest themselves on the dispersion of the Lagrangian particles (collapse of the histories of scaled $\overline {x'^2_{{i}}}/(E_{{a}}/(R T_{vN} x_{ind}))^2$ and $\overline {y'^2_{{i}}}/\overline {x'^2_{{i}}}$). In our case, due to high isentropic coefficients, the jets have not induced any cell bifurcation.
The study of the derivative of the relative dispersion with respect with time showed that after the main heat release, the relative dispersion relaxed towards the Richardson–Obukhov regime (exponent near 3), especially for the non-diluted case. The influence of the vortical motions coming from the jets and the slip lines, the fading of the transverse waves cannot be ignored in this transition.
Moreover, the exponent of the p.d.f. for the relative dispersion was also consistent with Richardson's prediction in the unstable case. Furthermore, the p.d.f. for the relative dispersion was self-similar in time. Nevertheless, the velocity field was not short time correlated with a separation distance below the induction length, meaning that the dispersion process could not be described by the diffusive equation. The relative dispersion scaled with the  $\chi$ parameter, which suggested that the rapid energy deposition on the reaction length scale also contributed to this phenomenon.
In addition, the present finding on the velocity field behind the detonation front can help to develop a turbulent model for detonation. Lagrangian averaging can have a merit over that from Eulerian results despite its higher computational cost. Conditional p.d.f. as in dispersed detonation flows (Watanabe et al. Reference Watanabe, Matsuo, Chinnayya, Matsuoka, Kawasaki and Kasahara2021) could improve our understanding of the links between pressure, vortical, entropy modes and chemistry in detonation.
Acknowledgements
A.C. and H.W. would like to thank V. Robin from Institut Prime for many fruitful discussions and advice. H.W. and A.C. are very grateful for the comments and suggestions by the anonymous referees during the revision of the manuscript.
Funding
This research was subsided by JSPS KAKENHI grant number JP20K22391 (Grant-in-Aid for Research Activity Start-up), JP21K14094 (Grant-in-Aid for Early Career Scientists), JP19J12758 (Grant-in-Aid for Specially Promoted Research), the Paloma Environmental Technology Development Foundation, and the CPER FEDER Project of Région Nouvelle Aquitaine and pertains to the French government program ‘Investissements d'Avenir’ (EUR INTREE, reference ANR-18-EURE-0010). H.W. is supported by JSPS Overseas Research Fellowships.
Declaration of interests
The authors report no conflict of interest.
Appendix A. Assessment of numerical convergence
In this appendix, the numerical convergence was assessed to check the effect of the grid resolution on the simulation results. The high computational cost for the numerical simulations with the Lagrangian particle tracking method prevented us using higher grid resolution than that used in the present study. According to previous studies, the present grid resolution satisfied the requirement for the grid resolution for the convergence of the 1-D average profiles (Reynaud et al. Reference Reynaud, Virot and Chinnayya2017, Reference Reynaud, Taileb and Chinnayya2020) for both mixtures and a reasonable physical structure in the instantaneous 2-D flow field (Mazaheri et al. Reference Mazaheri, Mahmoudi and Radulescu2012) in 2 $\textrm {H}_2$– $\textrm {O}_2$–7Ar mixture.
The numerical convergence was assessed by comparing the simulation results using a coarser grid, which was two times larger than the one used for the main results. The same simulation conditions were used and the propagation velocity was the same regardless of the grid resolution. In addition, the average cell width in the simulation from the manual measurement of 150 and 300 cells for the 2 $\textrm {H}_2$– $\textrm {O}_2$–7Ar and 2 $\textrm {H}_2$– $\textrm {O}_2$ mixtures in the coarse grid was 1.3 and 0.7 mm, respectively. The average cell width agreed well between the two different grid resolutions.
The comparison of the average dispersion between the two different grid resolutions was shown in figure 32. Although minor differences were observed, the profiles for average dispersion with different grid resolutions were similar (figure 32).

Figure 32. Average dispersion in 2 $\textrm {H}_2$– $\textrm {O}_2$–7Ar and 2 $\textrm {H}_2$– $\textrm {O}_2$ mixtures with two different grid resolutions. (a) Time history of $\overline {x'^2_{i}}$ and $\overline {y'^2_{i}}$, (b) $\overline {y'^2_{i}} / \overline {x'^2_{i}}$ as a function of $\tau / \tau _{ind}$, (c) $\overline {x'_{i} y'_{i}} / (\overline {x'^2_{i}} + \overline {y'^2_{i}})$, (d) $\overline {x'^2_{i}} / (E_{a} /(RT_{vN}) x_{ind} )^2$ as a function of $\tau / \tau _{ind}$.
The effect of the grid resolution on the relative dispersion was also evaluated. The initial distance between two particles in the same pair was doubled, as compared with the computations shown in § 4.3. Figure 33 depicts the average relative dispersion for 2 $\textrm {H}_2$– $\textrm {O}_2$–7Ar and 2 $\textrm {H}_2$– $\textrm {O}_2$ mixtures. The profiles were similar between the two grid resolutions. In the 2 $\textrm {H}_2$– $\textrm {O}_2$ mixture, the differences could be seen, as the time from shock passage increased. Nevertheless, the average relative dispersion $\bar {r}_{xy}$ normalized by the characteristic length scale $\chi x_{ind}$ as a function of the time from shock front passage $\tau /\tau _{ind}$ showed similar trends for both grid resolutions, meaning that the scaling worked well and that the R-O law still held.

Figure 33. Average relative dispersion in 2 $\textrm {H}_2$– $\textrm {O}_2$–7Ar and 2 $\textrm {H}_2$– $\textrm {O}_2$ mixtures with two different grid resolutions. (a) Average relative dispersion $\overline {r_{x}}^2$, $\overline {r_{y}}^2$, $\overline {r_{xy}}^2$, as a function of time passage $\tau$, (b) time history of normalized $(\overline {r_{xy}}/ (\chi x_{ind} ))^2$ compensated by normalized $(\tau / \tau _{ind})^3$.
The comparisons of the Favre average 1-D profiles in the instantaneous shock frame from Eulerian and Lagrangian points of view using the two different grid resolutions for 2 $\textrm {H}_2$– $\textrm {O}_2$–7Ar and 2 $\textrm {H}_2$– $\textrm {O}_2$ mixtures are depicted in figures 34 and 35. The characteristic lengths estimated from the Favre average 1-D profiles in the coarse grid are listed in table 5.

Figure 34. Favre average 1-D profiles in 2 $\textrm {H}_2$– $\textrm {O}_2$–7Ar mixture with two different grid resolutions for (a) pressure, (b) $\textrm {H}_2$ mass fraction, (c) Mach number, (d) thermicity.

Figure 35. Favre average 1-D profiles in 2 $\textrm {H}_2$– $\textrm {O}_2$ mixture with two different grid resolutions for (a) pressure, (b) $\textrm {H}_2$ mass fraction, (c) Mach number, (d) thermicity.
Table 5. Characteristic lengths normalized by induction length for 2 $\textrm {H}_2$– $\textrm {O}_2$–7Ar and 2 $\textrm {H}_2$– $\textrm {O}_2$ mixtures in the coarse grid resolution. Non-dimensionalized cell widths are added for comparison. The Lagrangian (distance) stands for the averaging process, described by (4.12), (4.14) and Lagrangian (time) refers to procedure based on (4.11), (4.13).

In the 2 $\textrm {H}_2$– $\textrm {O}_2$–7Ar mixture, the Favre average 1-D profiles for pressure, $\textrm {H}_2$ mass fraction, Mach number and thermicity were well converged between the two different grid resolution regardless of the Favre average procedure (figure 34). The Favre average 1-D profiles from Eulerian procedure for the 2 $\textrm {H}_2$– $\textrm {O}_2$ mixture were also similar between the two different grid resolutions (figure 35), except some minor differences.
Therefore, the characteristic lengths were similar between the two different grid resolutions. Moreover, the mean structure was also well captured by the present grid resolution (tables 4 and 5). This observation on the effect of grid resolution on the mean structure was in line with the previous studies (Reynaud et al. Reference Reynaud, Virot and Chinnayya2017, Reference Reynaud, Taileb and Chinnayya2020).
Thus, the profiles used for the analysis were well captured in the present grid resolution, and the conclusions on the Lagrangian dispersion and the mean structure in this study were not called into question by the numerical resolution.
Appendix B. Evaluation of anisotropy from the fluctuations in displacement
The dispersion was anisotropic (see figure 12b), where  $[\overline {y'^2_{i}} / \overline {x'^2_{i}} ]^{1/2}$ decreased from 1 near the front to 2/3 at the end of the detonation driving zone. To quantify further this dispersion, the joint p.d.f. between $x'_{i}$ and $y'_{i}$ is depicted in figures 36 and 37 for different instants to show their evolution. The centres are determined where $x'_{i}=y'_{i}=0$. The boundary of the joint p.d.f. shape was taken at $10^4$. The roundness and relative roundness were then evaluated as a measurement of the anisotropy:
 \begin{gather} R_{n} = \max ((e_{x,p}+e_{x,n}),(e_{y,p}+e_{y,n})) - \min ((e_{x,p}+e_{x,n}),(e_{y,p}+e_{y,n})), \end{gather}
 \begin{gather}R_{n,r} = R_{n} / \max ((e_{x,p}+e_{x,n}),(e_{y,p}+e_{y,n})). \end{gather}
Here,  $e_{x,p}$ and $e_{x,n}$ are the distances from the centre to the edges of the boundary in the $x$-axis, and in the same way for $e_{y,p}$ and $e_{y,m}$ in the $y$-axis. The roundness and relative roundness denote the degree of the symmetry of the joint p.d.f. and its relative magnitude, respectively. Their values are listed in table 6. The roundness was not zero and increased as time passed for both mixtures, which means that dispersion became anisotropic. However, the relative roundness rapidly saturated to 35 % and to 40 % for both mixtures, values of which are consistent with the ratio of $1-[ \overline {y'^2_{i}} / \overline {x'^2_{i}} ]^{1/2} \sim {1/3}$ found previously.

Figure 36. Joint p.d.f. for 2H $_2$–O $_2$–7Ar between the fluctuations of longitudinal displacements $x'_{i}$ and that of the transverse displacements $y'_{i}$ for different times from shock passage: (a) 5 $\mathrm {\mu }$s; (b) 10 $\mathrm {\mu }$s; (c) 15 $\mathrm {\mu }$s; (d) 20 $\mathrm {\mu }$s.

Figure 37. Joint p.d.f. for 2H $_2$–O $_2$ between the fluctuations of longitudinal displacements $x'_{i}$ and that of the transverse displacements $y'_{i}$ for different times from shock passage: (a) 2 $\mathrm {\mu }$s; (b) 4 $\mathrm {\mu }$s; (c) 6 $\mathrm {\mu }$s; (d) 8 $\mathrm {\mu }$s.
Table 6. Roundness and offset from the centre in joint p.d.f. for the fluctuations of longitudinal displacements and that of the transverse displacements.

Appendix C. The p.d.f. of the relative dispersion, correlation coefficients and characteristic time scales
The curves for the diffusive limit and the inertia regime are recalled here as they were included in figure 22(c–f) for comparison. The p.d.f. for the relative dispersion in the diffusive limit  $f_{diff}$ is given by (Buaria et al. Reference Buaria, Sawford and Yeung2015)
 \begin{equation} \mathrm{p.d.f.}_{diff} = 3 \sqrt{6 / {\rm \pi}} (r_{{xy}} / \overline{r_{{xy}}})^2 \exp\left[ -\tfrac{3}{2} (r_{{xy}} / \overline{r_{{xy}}})^2 \right]. \end{equation}
Richardson predicted the p.d.f. for the relative dispersion in the inertia regime  $\mathrm {p.d.f.}_{inertia}$ as follows (Sawford, Pope & Yeung Reference Sawford, Pope and Yeung2013):
 \begin{equation} \mathrm{p.d.f.}_{{inertia}} = \left(\tfrac{1144}{81}\right)^{3/2} \left(\tfrac{2187}{560 \sqrt{\rm \pi}}\right) (r_{{xy}} / \overline{r_{{xy}}})^2 \exp\left[ -\tfrac{9}{4} \left(\tfrac{1144}{81}\right)^{1/3} (r_{{xy}} / \overline{r_{{xy}}})^{2/3} \right]. \end{equation}
The characteristic times normalized by the induction time for both mixtures for the different Favre averaging procedure are listed in table 7.
Table 7. Characteristic times normalized by induction time for 2 $\textrm {H}_2$– $\textrm {O}_2$–7Ar and 2 $\textrm {H}_2$– $\textrm {O}_2$ mixtures. The Lagrangian (distance) stands for the averaging process, described by (4.12), (4.14) and Lagrangian (time) refers to procedure based on (4.11), (4.13).

The correlation coefficients between the displacements at  $t_0$ and at $t_0+\tau _{c}$ in longitudinal and transverse directions in table 3 are estimated by the following (C3) and (C4), respectively:
 \begin{gather} \sigma_{x'_{i}(t_0)x'_{i}(t_0+\tau_{c})} = \frac{\displaystyle\frac{1}{N_{c}} \sum_{i=1}^{N_{c}} (x'_{i}(t_0) - \overline{x'_{i}(t_0)}) (x'_{i}(t_0+\tau_{c}) - \overline{x'_{i}(t_0+\tau_{c}}) } {\displaystyle\sqrt{\frac{1}{N_{c}} \sum_{i=1}^{N_{c}} \left( x'_{i}(t_0) - \overline{x'_{i}(t_0)}\right)^2}\sqrt{\frac{1}{N_{c}}\sum_{i=1}^{N_{c}} \left( x'_{i}(t_0+\tau_{c}) - \overline{x'_{i}(t_0+\tau_{c})} \right)^2} }, \end{gather}
 \begin{gather}\sigma_{y'_{i}(t_0)y'_{i}(t_0+\tau_{c})} = \frac{\displaystyle\frac{1}{N_{c}} \sum_{i=1}^{N_{c}} y'_{i}(t_0) y'_{i}(t_0+\tau_{c})}{\displaystyle\sqrt{\frac{1}{N_{c}} \sum_{i=1}^{N_{c}} y'_{i}(t_0) y'_{i}(t_0) } \sqrt{\frac{1}{N_{c}} \sum_{i=1}^{N_{c}} y'_{i}(t_0+\tau_{c}) y'_{i}(t_0+\tau_{c}) }}. \end{gather}
Here,  $N_{c}$ is the number of Lagrangian particles inside the computational domain at $t_0+\tau _{c}$.


