


Introduction
Recent retreat or complete disintegration of some ice shelves along the Antarctic Peninsula (Vaughan and Doake, 1996, and papers in this volume) is among the most dramatic evidence yet of rapid regional climate change in the AntarctiC. However, those ice shelves are small features, at lower latitudes than the Ross Ice Shelf (RIS), which offers a useful contrast. SCAR/IGBP (1989) identified several indicators of global change that should be monitored, including positions of the fronts of the large ice shelves. Processes governing those ice shelves and related ocean characteristics need to be better understood in order to predict potential future changes in ice-ocean-atmosphere interactions.
The objectives of this paper are to identify recent changes in the front, movement and height of the RIS, assess whether such changes can be associated with known forcing, and evaluate the significance of such changes for the relative stability of the ice front. The paper is an update ofjacobs and others (1986) with similar ship-borne measurements. We recognise that our methods appear crude compared to techniques utilising synthetic aperture radar and Radarsat, but until very recently it has not been possible to obtain accurate position control for a long (800 km) evolving feature without fixed reference points (personal communication from J. Ferrigno, 1997). Historical observations also provide useful baselines for comparison with satellite-derived data.
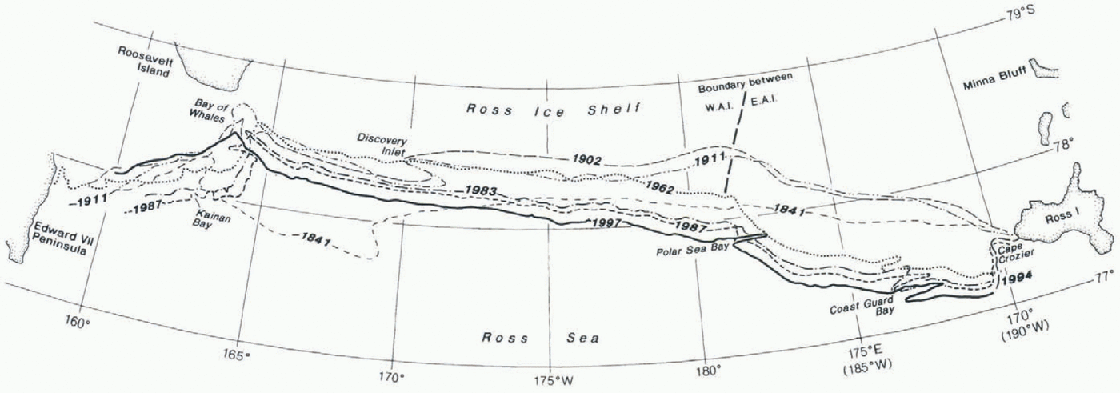
Fig. 1. RIS ice fronts 1841-1997 extended from Jacobs and others (1986). The boundary between ice derived from West (WA1) and East Antarctic ice (EA1) sheets is shown afterReference Thomas, MacAyeal, Filers, Gaylord, Hayes and BentleyThomas and others (1984).
Data and Methods
Ice-front position
We use positions of the ice front mapped from U.S. Coast Guard ice-breakers from radar ranges (typically 500-2000 m, ±2%) and bearings (±1°) measured during January-February 1983, 1987, 1994 and 1997. Mapping was done by the ships' officers and crews up to 1988, and under the direction ofH.K. in 1994 and 1997. Ship positions were derived from satellite navigation using Magnavox systems in 1983 and 1987 and the global positioning system in 1994 and 1997. We estimate the ice-front positions (Fig. 1) are accurate to ± 200-300 m for the 1994 and 1997 positions (confirmed by repeat mapping of short sections) and +500 m for the 1983 and 1987 positions.
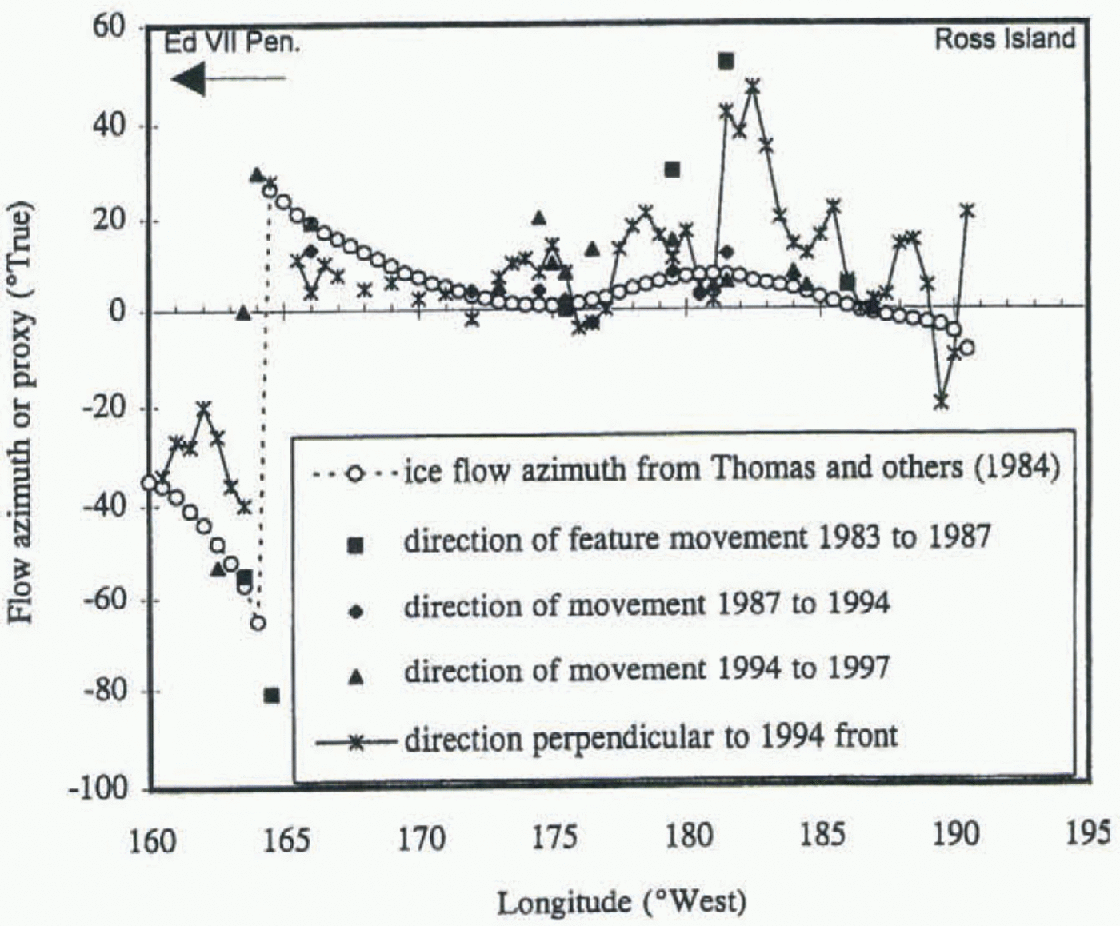
Fig. 2. Flow azimuth across the RIS front and indicators of the direction of ice-front movement. Note the use of °W for longitude west of 180° on this and subsequent figures.
Ice-flow direction and front advance rates
Secular changes in ice-flow direction and apparent advance rate of the ice front were quantified by measuring the differences between recognisable features at successive times. With a wide and relatively uniform ice front this is not straightforward since most small features change with time, and ice-flow azimuth (direction) varies spatially: in some places azimuth is not normal to the ice front (Fig. 2). From Thomas and others' (1984) measured ice velocities we derived baselines of ice-flow azimuth (to ±1-4°) and velocity along flowlines (to ±0.03-0.06 km a−1) at 0.5° longitude intervals along the ice front. Ice-front advances calculated in a fixed northwards direction (as in Jacobs and others, 1986) were generally similar to those measured downstream along flowlines (this paper) except where ice-flow vectors deviated most from vectors normal to the ice front or from true north. Based on feature movement, we estimate the maximum error in ice-flow direction at the ice front to be +10° for 1983-87 and 1994-97, and ±5° for 1987-94. Percentage errors in ice-front advance rates are sensitive to the net advance, averaging ±0.4, ±0.12 and ±0.23 km a−1 for 1983-87,1987-94 and 1994-97, respectively. Average percentage errors are ±41 %, 10% and 26%, respectively.
Ice-front heights
In 1994 and 1997, ice-front heights were measured from the ship's bridge using radar for range and bearing and a Frei-berger precision sextant and ship sextants for vertical angles. Open water was always present at the ice front during our cruises. With total measurement error of up to 5' in vertical angles, effects due to Earth curvature and refraction are negligible. Duplicate measurements by different observers in 1997 were repealable to ± 1 m at ship speeds up to 16 knots (30 km h). Assigned ship longitudes for these height meas-urements are up to 4' (400 m) from the longitude of the ice front, as the ship was not always directly north of the measured point.
A. G. E. Jones provided the 1902 and 1911 heights from expedition ship logbooks. in 1911 Terra Nova carried a Barr and Stroud range finder (personal communication from A. G. E. Jones, 1989), estimated to be accurate to 8-10% (personal communication from R. K. Headland, 1997). Assuming a sextant was used to measure vertical angles with an accuracy similar to that of modern sextants, total errors would have been 10-20%. lb be significant, differences between 1911 and our measurements need to be about 4 and 12 m for heights of 10 and 50 m, respectively. There was no range finder on the Discovery in 1902, but the heights recorded then are mostly within 5-10 m of the 1911 heights.
Ice-Front Changes
Position and shape
Most of the RIS front has continued its advance beyond that documented by Jacobs and others (1986). The western ice front is now well north of any position recorded during the last 156 years, and has not experienced major calving for at least 90 years (Fig. 1). On 9 February 1997 the northernmost point of the ice front was at 77°07.0'S, 170°57.5'E, 5.6 km north of the most northern point of Ross Island.
The last major change in the ice front occurred in October 1987, when the ice shelf calved along large rifts between Roosevelt Island and Edward VII Peninsula. This event produced the giant iceberg “B-9”, removed 5100 km2 of ice (estimated from Keys and others, 1990), or 1.0% of the 494 200 km2 ice-shelf area (Reference Fox and CooperFox and Cooper, 1994). The quasi-permanent Bay ofWhales had its southernmost point shifted 3 km south and 11 km east. The calving took away about 100 years of advance, judging by the width of the break-out, average advance and retreat rates between 1983 and 1994 and Thomas and others' (1984) ice velocities. Assuming constant velocities suggests calving would have occurred shortly before Scott's expeditions visited this area in 1902-11 (Fig. 1). However, that would make the 1954-55 position in Jacobs and others (1986, Fig. 5) an anomaly, since east of 162” wit appears south of Scott's ice front. A more northerly 1957 position shown by the American Geographical Society (1958) is consistent with the 1962 mapped position. Velocity changes in this part of the ice shelf (Table 1) and probable earlier mapping errors complicale the interpretation.
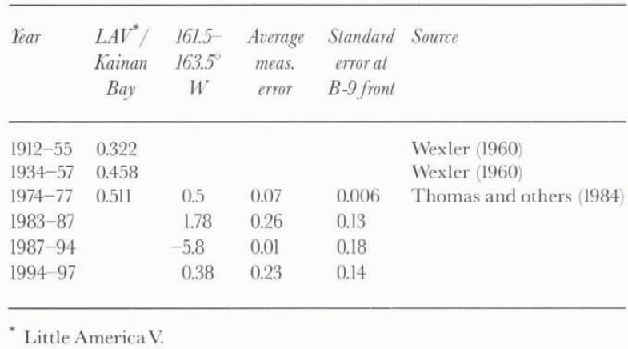
Table. 1. Velocity/advance rate (km a−1) of eastern Ross Ice Shelf/ice front this century
The general shape of the ice front has been approximately the same from Ross Island to 177 E (183° W: see Fig. 2 caption for longitude notation) since at least 1948, and from there eastward to the Bay of Whales since 1957 (from American Geographical Society, 1958). Minor changes in the shape of the ic e Iront have occurred due to ice flow, rifling and related bay formation, as well as minor calving. However, advance has persisted over most of the ice front: since at least 1957-62 west of Roosevelt Island, and since 1911 west of 178° w(Fig. 1).
Overall, most ice-front features have moved in the same direction as ice flow during the last 20years (Fig. 2), but in several places the ice front has moved in a different direction from the flow directions of 1973-77.The differences are most pronounced from 177° to 179.5° E (183-180.5° W) between 1983 and 1994, probably associated with the formation of the casi west-trending “Polar Sea Bay”, with its moulh at 178.5°E (181.5°W), which developed at the eastern end of transverse rifts between 1983 and 1987. Rifts normal to and offsetting apparent flow traces are visible here on Landsat TM-4 imagery obtained on 25 and 28 December 1989 (scenes 42719-18574 and 42722-19281). Such long-lived transverse rift systems upstream (Reference Bentley, Giovinetto, Weiler, Wilson and SeverinBentley and others, 1979), and younger rifts now extending west from the Bay of Whales (Landsat TM-4 image, 4 January 1990, scene 42729-17554; TM-4, 9 March 1989, scene 42428-1826; F-13 DMSP visible image, 5 February 1997; personal communication from R. Kwok, 1997), represent important modes of calving for RIS. The iwo largest bays on such rifts at present ("Coast Guard Bay” at 173°E (187° W) and “Polar Sea Bay") face in the opposite direction to the historic Discovery Inlet (Fig. 1). Other transverse rifts at various distances up to 60 km south of the ice front between 180° and 166° wwill be future calving sites: the western end of one intersects the ice front obli-quely at 166.2° wwhich is a site of minor calving. Small north-south-oriented features grouped mostly between 173° and 176.5° W, and from 175° to 176° E (184-185° W) along the ice front are at least partly associated with azimuth changes (Fig. 2) and probably represent divergent How. Most that were mapped in 1987 were still present in 1997, although sizes and shapes had changed. Flow-azimuth changes due to rifting were documented in the Nansen Ice Shelf by Reference Baroni, Frezzotti, Giraudi and OrombelliBaroni and others (1991).
Ice-Front Advance and Calving Rates
Since 1994 the entire ice front has advanced at an average speed of 0.90 ± 0.23 km a−1, slightly higher than the previous estimate of 0.8 km a−1 (Jacobs and others, 1986), but the difference is not significant. At 0.90 km a−1 over the 800 km wide ice front, the shelf area lost in the 1987 calving would have been regained in 7±1.8 years. The average advance rate west of 164.5° wfrom 1983 to 1997 (0.91 km a−1) is similar to ice velocities along most of the ice front (Fig. 3) west of 164.5°W (0.90 km a−1)

Fig. 3. Ice front net advance rates. 1983-97.
Calving rates clearly remain low aloni; most of the ice front. The calving and attrition rate is the difference between ice velocity and successive ice-front positions. To be significant, the front advance rate must be 0.44, 0.16 and 0.26 km a−1 larger or smaller than the ice velocity in the periods 1983-87, 1987-94 and 1994-97, respectively. Assuming constant ice velocity, these conditions are present most clearly in the B-9 and extreme western (i.e. west of 170.5°E (189.5° W)) fronts of the shelf (Fig. 3). Most calving has occurred in these areas at rates of up to 7 and 1 km a−1, respectively. Only minor calving and attrition have occurred along the ice front away from these areas (e.g. in small bays), at rates within or similar io measurement uncertainties. For example, from 165 wto 189.5 w(170.5° E) the average difference between ice velocity and the net change in ice-front position from 1987 to 1994 was only 0.03 km a (about 2.7 km a total loss for a front 150 m thick).
The assumption of time-invariant ice velocity may be invalid (Jacobs and others, 1986; Ferrigno and others, 1998). Thomas and others (1984) also noted the possibility that secular velocity changes have occurred in the eastern RIS. Input variability and other changes (e.g. at Crary Ice Rise) indicative of non-steady-state conditions also suggest that velocities may not be constant on time-scales from thousands of years to decades (Bentley and Reference Jezek and BentleyJezek, 1981). Ice velocities did increase cast of 164°W prior to the calving of B-9 (Table 1). Although B-9's perimeter had mostly been delineated by 1971 (Keys and others, 1990), the ice front accelerated in the decade before the actual calving. This acceleration may have been due, largely, to widening of existing transverse rifts and formation of an additional rift over the 1983-87 period. Since the velocity there has now decreased (Table 1), the change was probably not caused by any increased flow or flux from Ice Stream E. Recent transverse rifting may also have caused smaller accelerations of the ice front at 173-178.5° E (187-181.5°W) and 164.5-170.5° Wat various times (Fig. 3). Reference Bindschadler, Fahnestock, Skvarca and ScambosBindschadler and others (1994) detected increased velocities prior to some of the major retreats in the Larsen Ice Shelf.

Fig. 4. Height of the ice front this century.
Ice-Front Heights
Figure 1 shows ice-front heights measured on two historic and two recent cruises. As variability is high along the front on a scale of tens of metres to tens of km, the recent data have been smoothed. Two brief traverses with a Thomen precision altimeter along the surface of the ice shelf in February 1997, together with ship-based observations, suggested thai most of this variability is due to local irregularities, particularly bay formation (rifting) and buoyancy effects often causing bay “headlands” to be high points. Surface elevations measured 1 km south of and parallel to the ice front varied within 2-4 m and did not match height changes of up to 10 m along the ice front. The heights of individual features measured in 1994 and again in 1997 changed by 5-10 m (both up and down) in this period. Mean heights across the ice Iront were 30.7 m (standard error = 0.95) in 1994 and 29.0 m (s.e. = 0.71) in 1997. Heights in 1902 and 1911 are also similar to each other. Despite the variability, the overall trend is a general decrease in height from east to west (Fig. 4). This generally corresponds to published ice-thickness patients (e.g. USGS, 1972), but less so with surface elevations just south of the ice front mapped by Bamber and Bentley (1994). The three datasets show that thick ice derived from Ice Streams D and E persists to the ice front. Figure 4 suggests that east of 177 wthere has been little change in ice thickness this century.
Heights are relatively low from 171° to 177° W.This is the location of a “warm” Modified Circumpolar Deep Water circulation beneath the outer ice shelf (Jacobs and others, 1985) which may cause this low-elevation feature by enhancing basal melting. Between 171° and 177°W, there is a 3.8 m difference in mean heights between 1994 and 1997, which is the largest sustained difference along the ice front (Fig. 4). This amount may not be significant given the high variability noted above and the 1 m repeatability in individual measurements, but the implied thickness change suggests a basal melt rate about twice the 3 m a−1 average along the whole ice front in Jacobs and others (1986). Bamber and Bentley (1994) suggested the low-elevation feature was thin ice that had broken off from the lee of Steershead Crevasses upstream. Alternatively, their data could be interpreted as indicating that strong melting extends more than 100 km under the shelf at 171-172° W. This ocean-ice interaction has persisted apparently throughout this century, based on the similarities between modern and historic heights.
Modern heights are lower than historic heights west of 175° E (185° W), probably because the ice shelf here is much further north than it was in 1901-11 and thick ice from the Transantarctic Mountain glaciers has had more time to thin by melting and creep. The edge of thick ice flowing past Minna Bluff and derived from Byrd Glacier (Bamber and Bentley, 1994) may relate to the abrupt increase in front height east of Ross Island in 1911 (Fig. 4). Possibly calving had occurred a relatively short time before 1901 and certainly after 1841 (Fig. 1), consistent with the 100 year period it would have taken the ice front to move north to the 1997 position at the velocities measured by Thomas and others (1984). The ice shelf is thin enough here (see also USGS, 1972) for seasonally warmed surface water to flow beneath it near Ross Island (Reference Lewis, Perkin and JacobsLewis and Perkin, 1985; Jacobs and others, 1989), increasing basal melting in this area (Mac-Aycal and Thomas, 1986; Bamber and Bentley, 1994).
Modern heights exceed historic heights at 178° w179°E (178-182°W), and average heights in 1994 were greater than in 1997 at 179° E. This is close to the location of an 8-10 m height anomaly (Bamber and Bentley, 1994) at 177-178° E (182-183° W) near the mouth of “Polar Sea Bay” and continuing eastward along the ice front to 178°W. Calving, basal melting, ice-flow changes or deformation may have occurred in this region, which is close to the boundary between West and East Antarctic ice (Fig. 1). Low heights here suggest a large rift or bay-like feature was present in 1902-11.
Discussion
Antarctic ice shelves and ice tongues are characterised by slow advance and more rapid retreat (Jacobs and others, 1986), but calving rates are not constant (Reference FrezzottiFrezzotti, 1997). in the RIS, spatial patterns of surface mass balance (Bentley andjezek, 1981), 10 m temperatures (Thomas and others, 1984) and known ice influx (Reference MacAyeal and ThomasMacAyeal and Thomas, 1986) show no apparent relationship to the ice-front movement in general or to the continued advance of the western ice front in particular. Recent thickness changes in the ice shelf have been less than ±4 m (Bamber and Bentley, 1994), so changing ice flux through the Transantarctic Mountains seems unlikely to be the cause. The ice shelf as a whole has been more or less in steady slate during the last 1500-2500 years (Thomas and MacAyeal, 1982). The differences in ice-front height west of 177° wcould simply relate to time since the last major calving. The lack of bottom crevasses (Jezek and Bentley, 1983) or surface rifts and crevasses (Reference Casassa and TurnerCasassa and Turner, 1991) near the western ice front may lead to long intcrvals between calving events. Elsewhere such crevasses are more numerous (Jczek and Bentley, 1983, and see above) and although they are large distances (and decades of ice flow) apart in places, their presence is consistent with more recent and relatively more frequent calving.
Relatively fewer bottom crevasses might account for the continued advance of the western RIS front. It is less clear whether this implies that the underlying ice derived from East Antarctica has a higher fracture toughness than West Antarctic ice or is simply exposed to less stress during ungrounding (Jezek and Bentley, 1983). Whether enhanced basal melting near Ross Island could reduce ice-shelf thickness to some critical threshold, whereby colder, stronger ice remains, or percolated brine (e.g. from the ice front) freezes basal crevasses closed (MacAyeal and Thomas, 1986), remains to be determined.
Since RIS calving rates are generally low at present, most calving must be accomplished by very large events if the ice front is to roughly maintain its position between Ross and Roosevelt Islands. At an average advance rate of 0.9 km a−1, the ice front covers 720 km2 of ocean each year. This requires a B-9-sized event every several years to main-lain the same average ice-front position, something which has not occurred during the historical record. However, such large events represent small (1%) changes compared to the size of the ice shelf. The difference between the size of the RIS in 1911 and its size in 1997 is 35 000 km2; this may seem large, but over the 156 year record the area of the RIS has not varied by more than 4% from its average value. Although the historical record is short compared to the residence time of RIS ice (> 1000 years at 150 m depth; Thomas and MacAyeal, 1982), the small percentage variation implies a large-scale stability. This is consistent with long-term more or less steady-state conditions in a region where mean annual air temperatures are 10-15°G colder than the -5°C limit for viable ice shelves (Vaughan and Doake, 1996). in contrast, the weslern part of the nearby McMurdo Ice Shelf, in the same temperature zone but a different glaciolo-gical regime, has decreased by 30% in area this century (Reference Gow and GovoniGow and Govoni, 1994).
The more northward position of the RIS front over historic time is duplicated by the Filchner-Ronne and (since 1963) Amery Ice Shelves (personal communication from A. Jenkins, 1997 and from I. Allison, 1997). This has some interesting implications for estimates of iceberg standing stocks which have been utilised in some recent ice-sheet budgets. If the grounded ice sheet is close to a balanced state (Bentley and Giovinetto, 1991), but the sum of accumulation, calving and melting is negative Jacobs and others, 1992), then one possible explanation of the discrepancy is that the ice shelves are retreating. However, if the largest ice shelves, which drain 54% of the grounded ice-sheet area (Reference Giovinetto and BentleyGiovinetto and Bentley, 1985) are generally advancing, that explanation may not hold unless the smaller ice shelves and ice tongues have produced the reported calving. Marie Byrd Land sources may be important contributors (Ferrigno and others, 1998), but Frezzotti (1997) and Frezzotti and others (1998) have shown that Victoria Land, Oates Land and George V Land sources are not. Recent changes of some ice shelves on the Antarctic Peninsula (Vaughan and Doake, 1996), which are 1-4 orders of magnitude smaller in size than the RIS, are large in comparison to their size: advances have increased some areas by up to 40%, and retreats have caused up to 100% reduci ions. While the 1986 calving event from Larsen C was more than twice the area of B-9, the total calving from other Antarctic Peninsula ice shelves during the last decade was less than the size of B-9. Given the large error bars, determining whether the total area of Antarctic ice shelves is now larger or smaller than it was several decades ago remains an important task for those monitoring ice fronts with Radarsat and other satellite sensors.
Conclusion
The continued advance of the RIS beyond its historically observed positions near Ross Island may be due to a lack of bottom crevasses. Large calving events at long intervals of time determined by the spacing of transverse crevasses are characteristic of large ice shelves but do not significantly change the size of such shelves. Ice-front heights along the central part of the shelf suggest a “warm” Modified Circumpolar Deep Water circulation beneath the outer ice shelf has persisted over much of this century, enhancing basal melting in this area. Normal processes such as calving, basal melting, ice flow and deformation can expla in the large height differences between historical and modern heights along the western half of the ice front. We conclude that the calving front of the RIS has shown large-scale stability and small-scale changes relative to its size over the historical record, consistent with more or less steady-state conditions.
Acknowledgements
We acknowledge the support of the U.S. Coast Guard, U.S. National Science Foundation grant OPP-94-18151 and the New Zealand Department of Conservation that made this work possible. H.K. is grateful for the hospitality of the Earth and Environmental Sciences Department at the New Mexico Institute of Mining and Technology, Socorro, where preparation of this paper started. N. Young, P. Cooper, L. Clelland, K. Williams and an anonymous referee made helpful comments on the manuscript. G. Edkin prepared Figure 1 from field charts. This is contribution No. 5754 of the Lamont-Dohcrty Earth Observatory.


