


Good dietary habits are associated with better health status, especially among older adults. One essential aspect of diet quality is variety; older adults with a more varied diet have better nutritional status(Reference Bernstein, Tucker and Ryan1,Reference Tsuji, Yamamoto and Yamasaki2) . Previous gerontology studies used dietary variety as an index of diet quality and demonstrated the association between poor diet quality and health problems such as functional capacity(Reference Kumagai, Watanabe and Shibata3), cognitive decline(Reference Otsuka, Nishita and Tange4), sleep quality(Reference Yamamoto, Motokawa and Yoshizaki5), frailty(Reference Motokawa, Watanabe and Edahiro6), muscular decline(Reference Yokoyama, Nishi and Murayama7) and mortality(Reference Lv, Kraus and Gao8) among older adults. Promoting greater diet variety among older adults is crucial to their health.
To develop effective strategies for promoting dietary variety among older adults, we must identify modifiable predictors of dietary variety. The ecological model proposes that environmental factors influence the health behaviours of larger populations for a longer term than do individual factors(Reference Sallis, Cervero and Ascher9). One important environmental factor is the access to food stores, based on the assumption that adequate access should make it easier for older adults to maintain appropriate dietary behaviours. However, current evidence on this relationship remains inconclusive. While some studies have reported that older adults’ poor access to food stores is associated with lower intake of fruits and vegetables(Reference Sharkey, Johnson and Dean10,Reference Nakamura, Nakamura and Okada11) and meat and fish(Reference Nakamura, Nakamura and Okada11), others have indicated that access to food stores is not significantly associated with fruit and vegetable intake(Reference Hawkesworth, Silverwood and Armstrong12) or dietary variety(Reference Fukuda, Ishikawa and Yokoyama13). The picture is further complicated by a report stating that objectively poor access to food stores is associated with higher fruit and vegetable intake, while perceived poor access is linked to lower intake(Reference Yamaguchi, Takahashi and Hanazato14). Further examination is therefore necessary to confirm the relationship between food store accessibility and dietary behaviours among older adults.
The ecological model(Reference Sallis, Cervero and Ascher9) proposes that environmental and individual factors interactively influence health behaviours; therefore, access to food stores would influence dietary variety differentially, depending on individual differences among older adults. Individual variation as an effect modifier may explain the inconsistent relationship between access to food stores and dietary behaviours observed across studies. One probable moderator is the use of grocery delivery services, considering that 32·8 % of the Japanese population uses such services(15). We anticipate that non-users of grocery delivery would be more dependent on local markets than users; hence, the dietary variety of non-users may be more susceptible to the influence of access to food stores. If we can confirm the moderating role of grocery delivery services, we can focus on developing intervention programmes to address poor access to food stores.
The current study investigated whether the use of grocery delivery services moderated the relationship between dietary variety and distance to supermarkets among Japanese older adults. We hypothesised that the association with dietary variety will be more evident among grocery delivery non-users than among users.
Methods
Participants and procedures
Data were collected among older adults living in Nada Ward of Kobe City, Hyogo Prefecture, Japan, using a questionnaire. Kobe City is a major urban area consisting of nine wards, and Nada Ward has approximately 137 000 residents. All men aged 64, 69, and 74 years on 1 April 2017 (n 2204), along with their wives (n 1516), were selected from Nada Ward’s official resident register for participation in the study. From December 2017 to January 2018, we conducted a baseline survey of these 3720 individuals via mailed questionnaire. Among them, 1784 (48·0 %) responded.
Among the 1784 individuals, 1079 agreed to make further contact with our research group. From December 2018 to January 2019, we conducted a 1-year follow-up survey of these 1079 individuals via mailed questionnaire. Among them, 919 (85·2 %) responded.
The cross-sectional analyses included data from 1538 of the 1784 individuals. The remainder was excluded for the following reasons. First, some respondents were certified as requiring long-term care, or data concerning certification were missing (n 60); second, they lived in the mountainous area of Nada Ward (n 3) and third, baseline data on dietary variety, use of grocery delivery services or socio-demographic factors were missing (n 186).
The prospective analyses included data from 778 of the 1538 individuals. The remainder was excluded for the following reasons. First, individuals did not agree to a follow-up (n 578); second, they agreed but did not respond to the mailed follow-up survey (n 140); third, they were certified as requiring long-term care, or certification data were missing (n 10); fourth, participants had moved to a new area, or data on a potential move were missing (n 22) and five, dietary variety data were missing from the follow-up survey (n 10).
The current study was conducted according to the guidelines of the Declaration of Helsinki, and all procedures involving study participants were approved by the Ethical Committee of the Graduate School of Human Development and Environment, Kobe University. Written informed consent was obtained from all participants.
Measures
Dietary variety
This variable was measured using the dietary variety score(Reference Kumagai, Watanabe and Shibata3) commonly used in Japanese gerontology studies(Reference Yamamoto, Motokawa and Yoshizaki5–Reference Yokoyama, Nishi and Murayama7). The score represents consumption frequencies of ten components (meat, fish, eggs, milk, soya products, green and yellow vegetables, potatoes, fruit, seaweed and fats and oils) for a typical week. Consumption frequencies were assessed with four choices: almost every day, 3 or 4 d a week, 1 or 2 d a week and almost never. The final dietary variability score was the sum of all components to which a respondent answered ‘almost every day’ (range 0–10). Higher scores indicate greater variety(Reference Kumagai, Watanabe and Shibata3).
Distance to supermarket
We focused on supermarkets as food stores for grocery delivery non-users, as 90·8 % of the Japanese population buys groceries most frequently from supermarkets(15). Road network distances (in m) from each home address to the nearest supermarket were measured using geographic information systems (ArcGIS for Desktop 10·5 Network Analyst software; ESRI Japan Corporation). Supermarket data were obtained from a phone number database (i-Taun-Pegi, or Yellow Pages). Nada Ward contained twenty-five supermarkets.
Use of grocery delivery services
Respondents were asked to indicate whether they regularly used grocery delivery services. As we assumed that most respondents had adequate knowledge of these services, we did not provide a definition of the term ‘grocery delivery services’ in the questionnaire.
Socio-demographic factors
Measured variables included age, gender, educational level (junior to high school, above high school), perceived household economic status (five-point Likert scale from very poor (1) to very good (5)), current working status (no/yes), current driving status (no/yes), living arrangement (alone/with others), history of major chronic diseases such as hypertension, diabetes, hyperlipidaemia or heart disease (yes/no) and frailty, measured using the Kihon Checklist(16,Reference Arai and Satake17) . In this checklist, respondents answered each of the twenty-five items with ‘yes’ or ‘no’, and the summed scores were calculated. Individuals were dichotomised using the cut-off points for pre-frailty (3/4)(Reference Satake, Senda and Hong18). Based on previous research, the Spearman’s correlation coefficient between the Kihon Checklist score and frailty-phenotype count has a correlation of 0·66 (Spearman’s)(Reference Satake, Senda and Hong18); sensitivity and specificity of pre-frailty/frailty detection via the cut-off point are 70·3 and 78·3 %, respectively(Reference Satake, Senda and Hong18).
Analyses
Cross-sectional analyses
The characteristics of regular users of grocery delivery services were examined using χ 2 tests for categorical variables and t tests for continuous variables.
Baseline data (n 1548) were analysed using a multiple regression model with dietary variety score as the dependent variable. The independent variables (included with the forced entry method) were distance to supermarket, use of grocery delivery services, the interaction of those two variables and socio-demographic factors. Dummy variables were gender (men = 0, women = 1), educational level (junior to high school = 0, above high school = 1), current working status (no = 0, yes = 1), current driving status (no = 0, yes = 1), living arrangements (with others = 0, alone = 1), history of major chronic diseases (no = 0, yes = 1), frailty (healthy = 0, pre-frail/frail = 1) and regular use of grocery delivery services (no = 0, yes = 1). The interaction term was calculated using standardised scores.
For visual representation, distance to supermarket was categorised into three groups using mean and sd (near group, ≤ –1 sd; middle group, –1 sd to +1 sd; far group, ≥+1 sd). Figure 1 plots the dietary variety score based on these groups and regular use of grocery delivery services. A two-away ANOVA was conducted with dietary variety score as the dependent variable and distance to supermarket and regular use of grocery delivery services as the independent variables.
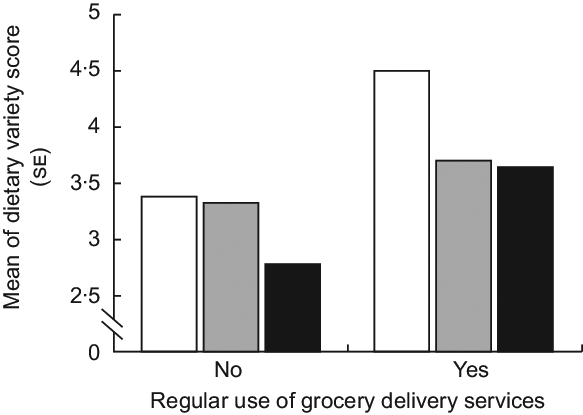
Fig. 1 Distance to supermarket, use of grocery delivery services (independent variables) and dietary variety score (dependent variable). Two-way ANOVA showed that the main effects of distance to supermarket, regular use of grocery delivery services and their interaction were F = 3·79 (P = 0·023), F = 18·30 (P < 0·001) and F = 1·98 (P = 0·139), respectively. ![]() , near (≤−sd);
, near (≤−sd); ![]() , middle (−sd to +sd);
, middle (−sd to +sd); ![]() , far (≥+sd)
, far (≥+sd)
Significance was set at P < 0·05. All analyses were performed in SPSS for Windows version 51·0.
Prospective analysis
For the prospective association, the present study analysed the data of 778 individuals. We conducted χ 2 tests for categorical variables and t tests for continuous variables to compare the baseline characteristics of those who were included in (n 778) and excluded from (n 760) the prospective analyses.
A multiple linear mixed model examined whether distance to supermarket and its interaction with regular use of grocery delivery services predicted the dietary variety score at baseline and at 1-year follow-up. We did not calculate 1-year change scores, as it can be assumed that distance to supermarket did not change and dietary variety would remain relatively stable for 1 year. Concerning dietary variety, 26·5 % of the respondents showed the same scores at baseline and at the 1-year follow-up; the Pearson’s correlation coefficients of the scores were r 0·66. A systematic review(Reference Rhodes and Quinlan19) proposed that examining change scores is likely to present null findings when the variables are relatively stable across time. Previous studies have employed mixed models with data settings similar to the current study to examine prospective associations of neighbourhood environmental factors with other health behaviours without calculating change scores. Such behaviours include physical activity(Reference Boone-Heinonen, Diez Roux and Kiefe20), out-of-home behaviour(Reference Harada, Lee and Lee21) and children’s outdoor play(Reference Remmers, Van Kann and Gubbels22). Mixed models are appropriate for prospective data because their significance is unbiased, compared with ordinal regression models(Reference Locascio and Atri23). Individual differences were treated as a random effect. A maximum likelihood estimation was used to fit the model. Fixed effects were distance to supermarket, regular use of grocery delivery services, survey time (baseline = 0, 1-year follow-up = 1), interaction of distance to supermarket and grocery delivery use, interaction of distance and survey time and interaction of grocery delivery and survey time, as well as socio-demographic factors. The forced entry method was used for entering these variables.
Significance was set at P < 0·05. The mixed command of Stata version 14 (StataCorp LLC) was used for the linear mixed model, and SPSS 21.0 was used for other analyses.
Additional analyses
To investigate whether the associations of distance to supermarket and regular use of grocery delivery services with dietary variety differed between men and women, the interaction terms of gender were examined with distance to supermarket and with regular use of grocery delivery services. These interaction terms were added as independent variables in the main multiple regression analysis and the main mixed model, respectively. If the regressions of any interaction terms were significant – which would indicate gender differences in the associations of distance to supermarket and regular use of grocery delivery services with dietary variety – further analyses stratified by gender were conducted. If the regressions of the interaction terms were NS, no gender-stratified analyses were conducted.
Results
Baseline characteristics of respondents
Table 1 shows the baseline characteristics of the respondents. We found that 20·9 % of the participants used grocery delivery services regularly (Table 1). Mean distance to the nearest supermarket was 419·0 m, while the average dietary variety score was 3·4. Regular users of grocery delivery services were more likely to be younger women, have higher educational level and higher dietary variety, drive a car and live with others far away from a supermarket (Table 1).
Table 1 Baseline characteristic of respondents and use of grocery delivery services
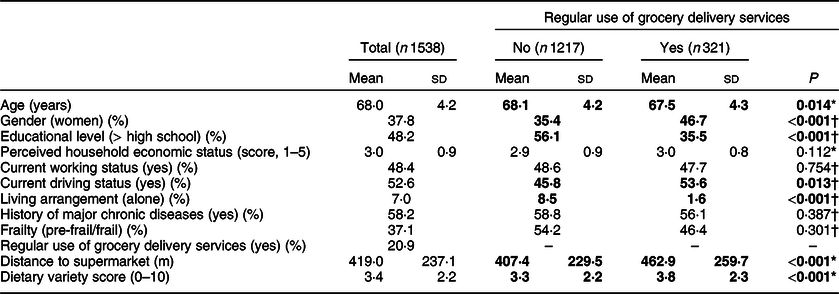
The numbers in bold are statistically significant.
* t test.
† χ 2 test.
Cross-sectional associations of distance to supermarket, use of grocery delivery services and dietary variety
Table 2 shows the results of the multiple regression analysis for cross-sectional associations of distance to supermarket, regular use of grocery delivery services and dietary variety. While the main effects of distance to supermarket (B = –0·06, P = 0·014) and regular use of grocery delivery services (B = –0·30, P = 0·031) significantly predicted dietary variety, their interaction term did not (B = 0·01, P = 0·861; Table 2).
Table 2 Multiple regression for cross-sectional associations of distance to supermarket, use of grocery delivery services and dietary variety*†
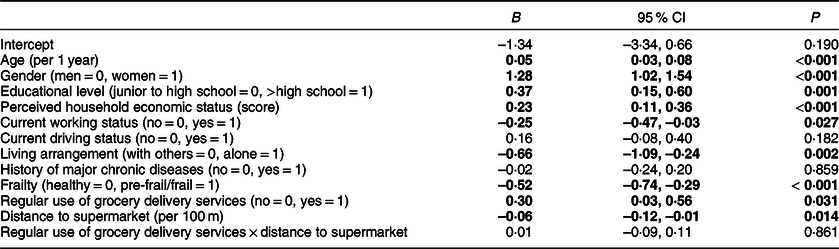
The numbers in bold are statistically significant.
* The dependent variable was dietary variety score at baseline.
† F(121 525) = 20·3; P < 0·001; adjusted R 2 = 0·13.
Figure 1 represents the cross-sectional associations between distance to supermarket and dietary variety score based on regular use of grocery delivery services. While the interactive effect of distance to supermarket and regular use of grocery delivery services was NS (F = 1·98, P = 0·139), the main effects of distance to supermarket (F = 3·79, P = 0·023) and regular use of grocery delivery services (F = 18·30, P < 0·001) were significant. Tukey’s multiple comparison test for distance to supermarket revealed that the far group (mean dietary variety score = 3·01) had a significantly lower dietary score compared with the near group (mean dietary variety score = 3·57, P = 0·023) and middle group (mean dietary variety score = 3·40, P = 0·035). There was no significant difference in the mean dietary variety scores between the near and middle groups (P = 0·596).
Prospective associations of distance to supermarket, use of grocery delivery services and dietary variety
Those included in the prospective analysis (n 778) were likely to have higher educational levels, better perceived household economic status and more dietary variety (Table 3). They also drove and were not pre-frail or frail.
Table 3 Comparison of baseline characteristics between participants included in and excluded from prospective analyses
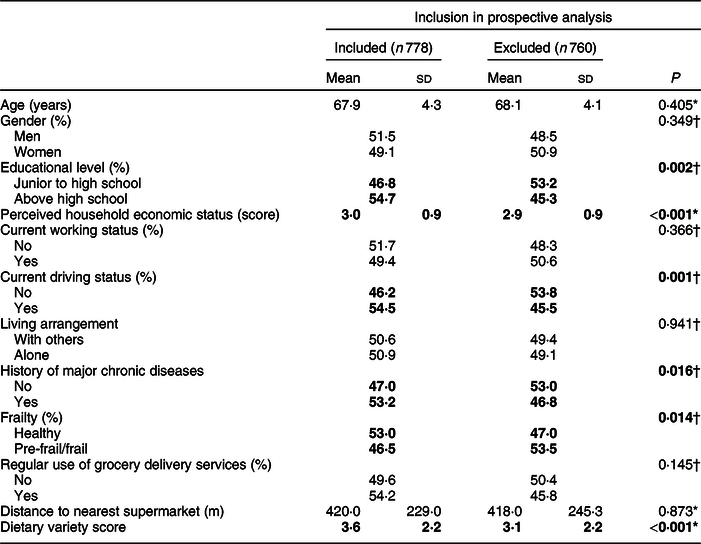
The numbers in bold are statistically significant.
* t test.
† χ 2 test.
Table 4 shows the results for the mixed model for the prospective associations of distance to supermarket, regular use of grocery delivery services and dietary variety. Similar to the cross-sectional analysis, the mixed model found that longer distance to supermarket significantly predicted lower dietary variety (B = –0·07, P = 0·048; Table 4). Regular use of grocery delivery (B = 0·28, P = 0·127) and its interaction with distance to supermarket (B = –0·04, P = 0·604) did not predict dietary variety.
Table 4 Fixed effects in the mixed model for prospective associations of distance to supermarket, use of grocery delivery services and dietary variety*
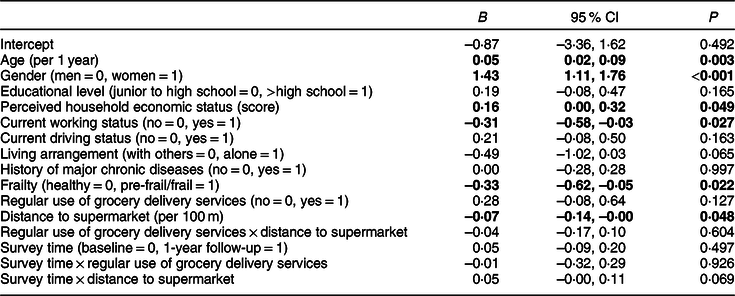
The numbers in bold are statistically significant.
* Intercept for individual differences was treated as a random effect (B = 2·58 (95 % CI 2·26, 2·96)).
Additional results regarding gender difference
The multiple regression analysis showed that the interaction terms of gender with distance to supermarket (B = 0·01, 95 % CI –0·09, 0·10, P = 0·923) and with regular use of grocery delivery services (B = 0·36, 95 % CI –0·17, 0·88, P = 0·186) did not significantly regress on dietary variety. Additionally, the mixed model did not reveal significant regressions of the interaction terms of gender with distance to supermarket (B = –0·05, 95 % CI = –0·17, 0·07, P = 0·416) or with regular use of grocery delivery services (B = 0·06, 95 % CI = –0·48, 0·70, P = 0·861) on dietary variety. Thus, we did not conduct further analyses stratified by gender.
Discussion
Our main findings were that increased distance to supermarkets was associated with lower dietary variety among Japanese older adults and that grocery delivery services did not moderate this association. Therefore, use of grocery delivery services does not appear to ameliorate any negative effects from limited access to food stores. Previous studies on dietary behaviours reported that while sense of mastery(Reference Mackenbach, Lakerveld and Generaal24) and stress(Reference Zenk, Schulz and Izumi25) are not moderators of the relationship between food environments and dietary behaviours, dietary knowledge(Reference Mercille, Richard and Gauvin26) and time spent at home(Reference Chum, Farrell and Vaivada27) are. An existing systematic review(Reference Mackenbach, Nelissen and Dijkstra28) argued that limited evidence exists of a moderating effect of socio-economic factors on the relationship between food environments and dietary behaviour. Despite the rejection of our hypothesis that use of grocery delivery services moderates the relationship between food access and dietary behaviour, our results still contribute to a better understanding of how environments influence dietary behaviours.
One potential explanation for the lack of moderating effect is that grocery delivery services may be insufficient in fulfilling all grocery demands of most Japanese older adults. Within the Japanese population, 18·7 % go shopping almost every day, 23·6 % go every other day and 45·5 % go once every 3 to 4 d(29). However, Japanese grocery delivery systems (e.g., Consumers’ Cooperative Society, Japan’s largest service) typically offer their services once a week. Thus, even regular users of the service would need to go shopping, meaning that food store accessibility remains relevant to their dietary variety. Moreover, while the cross-sectional analysis revealed a significant main effect of grocery delivery service use on dietary variety, the prospective analysis did not. Considering both these results, we propose that grocery delivery services could only be supplementary in improving the diets of older adults.
Our cross-sectional and prospective analyses consistently showed that a shorter distance to supermarkets was associated with higher dietary variety among Japanese older adults. Further, our additional analyses indicated no notable gender differences for this association. Previous studies reported inconsistent results regarding possible associations between access to food stores and dietary behaviours among older adults; however, all of these analyses were cross-sectional(Reference Sharkey, Johnson and Dean10–Reference Fukuda, Ishikawa and Yokoyama13). Our study, therefore, contributes new insights by using a prospective study design. Considering the potential mechanisms underlying the relationship between distance to supermarket and dietary variety, older adults living near a supermarket might shop more frequently and can therefore buy and consume a wider range of foods, compared with those living far from a supermarket.
Our research has strengths in its objective assessment of supermarket access and prospective study design. Concordances in the cross-sectional and prospective analyses support the robustness of the findings. However, we also note several limitations. First, some sampling bias was unavoidable, as the baseline response rate (48·0 %) was lower than that in our previous survey(Reference Harada, Masumoto and Katagiri30) conducted in the same area (Nada ward of Kobe city) (61·7 %). Moreover, the baseline characteristics of the participants in the prospective analyses differed from those who were excluded. Second, we did not consider the frequency of using grocery delivery services. As discussed above, its non-significant moderating role might be because the frequency of typical services – once a week – might be insufficient to fulfil demand. If older adults use these services more frequently, they would not need to go shopping, meaning that the negative effects of longer distances to supermarkets might be diminished. We also did not collect detailed data on shopping behaviour, such as the specific supermarket most frequently visited and the typical cost of one shopping trip. Measuring the distance to a specific supermarket could provide definitive results about the influence of food store accessibility. Those who typically spend more cost on food may buy various types of groceries and therefore have higher dietary variety. Third, we did not consider other potential confounders, such as cooking skills and chewing ability. Older adults with inadequate cooking skills and chewing abilities may have lower dietary variety than those with adequate skills and abilities. Fourth, the questionnaire survey did not provide a definition or explanation of the term ‘grocery delivery services’. Finally, we investigated only one Japanese city where the absolute availability of supermarkets was good (mean distance to supermarket = 418·2 m). Thus, our findings cannot be generalised to rural areas. Future investigations should address all of these limitations to generate a more definitive conclusion. Despite these limitations, the current study advances current knowledge of the relationship between food environment and dietary behaviours among older adults.
In conclusion, our main finding was that a longer distance to a supermarket is associated with lower dietary variety among Japanese older adults and that the use of grocery delivery services did not moderate this association. The findings imply that the use of grocery delivery services is insufficient in reducing the negative influence of inconvenient food access on dietary variety. A practical implication of our results is that encouraging the use of grocery delivery services in areas suffering from inconvenient food access will probably be ineffective for promoting dietary variety among older adults. Instead, improving food store accessibility directly may be required.
Acknowledgements
Acknowledgement: The authors would like to thank Editage (www.editage.com) for English language editing. Financial support: This work was supported by the Grant-in-Aid for Scientific Research (15KT0006, 17H04757), Japan Society for the Promotion of Science; the Promotion Project of Creating Industry Extending Healthy Life Expectancy (FY2016), Ministry of Economy, Trade and Industry and the Lotte Research Promotion Grant (FY2018), Lotte Foundation. All funders had no role in the design, analysis or writing of this article. Conflict of interest: There are no conflicts of interest. Authorship: K.M. and S.O. contributed to conception and design, data acquisition and manuscript revision. K.H. contributed to conception and design, data acquisition, analysis, interpretation and drafting of the article. All authors approved the final version and agreed to be accountable for all aspects of the work. Ethics of human subject participation: The current study was conducted according to the guidelines laid down in the Declaration of Helsinki, and all procedures involving research study participants were approved by the Ethical Committee of the Graduate School of Human Development and Environment, Kobe University. Written informed consent was obtained from all subjects.


