


Introduction
Textile waste produced by the dyeing industry has the potential to pollute the environment. The existence of textile waste in water can interfere with the penetration of sunlight. As a result, the life of organisms in the waters is disrupted, and at the same time, it can threaten the sustainability of aquatic ecosystems (Khan et al., Reference Khan, Singh, Khan, Tabraiz and Sheikh2023). On the other hand, dye waste produced from the textile industry is generally a non-biodegradable organic compound, which is a cause of environmental pollution, especially in the aquatic environment. One dye often used in the textile industry is Rhodamine B (RhB) (Van Hoang et al., Reference Van Hoang, Nguyen-Thi, Kim, Dang, Ngoc Toan and La2022). RhB is a basic dye that is important in the coloring process in the textile and paper industries. However, RhB is of particular concern because its aromatic structure of RhB is difficult to degrade. The impacts include skin and eye irritation, digestive tract disorders, and shortness of breath.
Several types of materials are used in an effort to remove RhB, one of which is clay. Characteristics of the clay surface, such as structure, ion exchange capacity, specific surface area, mechanochemical stability, water-holding capacity, and surface reactivity means that clays have significant potential in terms of RhB removal (Eren, Reference Eren2010). Although the adsorption process is considered simple, it has limitations: the limited adsorption capacity of the adsorbent and the possibility of desorption mean that improvement and modification of clay is required (Tretiak et al., Reference Tretiak and Abdallah2009).
Efforts have been made to improve the ability to remove RhB from clay using clay pillarization with TiO2 through a photodegradation process (Yamanaka et al., Reference Yamanaka, Nishihara, Hattori and Suzuki1987). TiO2 is a photocatalyst material capable of degrading RhB with the help of ultraviolet radiation (Dao et al., Reference Dao, Ha, Nguyen, Le, Ha-Thuc, Nguyen, Perre and Nguyen2021). TiO2 is studied and used in many applications because of its strong oxidizing ability to decompose organic pollutants, high hydrophilicity, high chemical stability, long shelf life, non-toxicity, low cost, and transparency to visible light (Nakata et al., Reference Nakata and Fujishima2012). TiO2 splinting of clay also has other advantages. Unstable interlayer structures in clay and loss of porosity due to heating at high temperatures can be overcome by inserting ions or molecules into the interlayer, known as intercalation. Heating the intercalation substance produces pillars, better known as pillarization (Pinnavaia, Reference Pinnavaia1983). By making pillared clay, the area between layers becomes more stable due to metal oxides forming pillars in the area between layers (Najafi et al., Reference Najafi, Farajfaed, Zolgharnian, Mirak, Asasian-Kolur and Sharifian2021).
Using TiO2 as a photocatalyst presents a weakness – its wide bandgap energy of 3.23 eV. To address this, innovative approaches have been explored, including narrowing the bandgap energy (E g) (Abdo Segne et al., Reference Abdo Segne, Rao Tirukkovalluri and Challapalli2011) through the insertion (doping) of metals and non-metals. Numerous studies have demonstrated that doping TiO2 with transition metals like Fe (Sukhadeve et al., Reference Sukhadeve, Janbandhu, Kumar, Lataye, Ramteke and Gedam2022), Co (Basumatary et al., Reference Basumatary, Basumatary, Konwar and Ramchiary2023), Ni (Santos et al., Reference Santos, Lopes, Mascarenhas and Silva2023), Au, and Ag (Zhang et al., Reference Zhang, Li and Xia2023) can decrease E g values, enhancing photocatalytic activity. These transition metal dopants in TiO2 act as electron trappers, augmenting the separation of electron-hole pairs and, consequently, increasing the photocatalytic efficiency of TiO2 (Zhou et al., Reference Zhou, Qian, Zhang, Li, Wei, Wang, Ye, Liu, Ye and Huang2020). Nickel and cobalt, among the transition metals, are particularly effective dopants for TiO2. Ni doping reduces the bandwidth from 3.28 to 2.7 eV (Opra et al., Reference Opra, Gnedenkov, Sinebryukhov, Gerasimenko, Ziatdinov, Sokolov, Podgorbunsky, Ustinov, Kuryavyi and Mayorov2021), while Co doping reduces the bandgap from 3.11 to 2.94 eV (El Mragui et al., Reference El Mragui, Zegaoui and da Silva2021). The presence of nickel and cobalt metal ion doping is anticipated to extend the photoresponse of TiO2 into the visible spectrum, enabling its application in the degradation of colored organic contaminants and other pollutants (Sun et al., Reference Sun, Zhai, Li, Zhao, Yang and Yu2014). The research hypothesis posits that modifying clay with TiO2, coupled with nickel or cobalt doping, enhances adsorption capacity for RhB removal. The insertion of nickel or cobalt metal ions is expected to narrow the energy band gap of TiO2, thereby boosting its photocatalytic efficiency. This study aims to extend the photolysis response of TiO2 to the visible range, providing an effective and environmentally friendly method for removing RhB from waste water.
This investigation builds upon prior research conducted by Cardona et al. (Reference Cardona, Węgrzyn, Miśkowiec, Korili and Gil2022) concerning the synthesis of TiO2-pillared clay for the degradation of organic compounds. The incorporation of nickel or cobalt doping represents a distinctive aspect of the research, with particular emphasis on their application for the removal of RhB dyes. Comprehensive analysis and characterization of the samples were conducted using FTIR, TGA-DSC, XRD, and GSA. The investigation also encompassed an examination of the adsorption and photodegradation activities of RhB by the samples, including an exploration of their kinetics and thermodynamics.
Materials and methods
Materials
The raw clay used was taken directly from the Wonosegoro District, Boyolali Regency, Central Java Province, Indonesia. Ni(NO3)2·6H2O (AR, 99%), Co(NO3)2·6H2O (AR, 99%), ethanol (AR, 98%), and Rhodamine B (AR, 99%) were purchased from Merck Co., Germany, while TiCl4 (AR, 98%) was purchased from Sigma-Aldrich Co., USA.
Clay preparation
The Natural Boyolali Region (NBR) clay was washed with water to remove impurities and then dried. The clay was crushed and sieved with a 170-mesh sieve to obtain a smaller clay size and used as the first sample. 10 g of NBR clay was added to 44 mL of ethanol (Clay+EtOH).
Pillarization of titania on NBR clay
10 mL of TiCl4 solution was added to 44 mL of ethanol and stirred using a magnetic stirrer until homogeneous. 10 g of NBR clay was poured into the titania pillar solution slowly while stirring with a magnetic stirrer at room temperature for 24 h until homogeneous. The NBR clay was washed using ethanol, then dried, crushed, and sieved with a 170-mesh sieve, and calcined at 300°C for 2 h. This sample was referred to as Ti/NBR Clay.
Titania-pillared NBR Clay doped with Ni2+ and Co2+
10 mL of TiCl4 solution was added to 44 mL of ethanol and stirred using a magnetic stirrer; 2.9 g of Ni(NO3)2·6H2O or Co(NO3)2·6H2O powder was then added to the pillar solution and stirred using a magnetic stirrer for 24 h. 10 g of NBR clay was poured into the titania pillar solution doped with Ni2+ or Co2+ while stirring with a magnetic stirrer at room temperature for 24 h and then washed using ethanol. It was then dried, crushed, and sieved with a 170-mesh sieve, and calcined at 300°C for 2 h. These pillared clays are referred to as Ni-Ti/NBR Clay and Co-Ti/NBR Clay.
Characterization
Several techniques and instruments were used to characterize the five samples (Clay, Clay+EtOH, Ti/NBR Clay, Ni-Ti/NBR Clay, and Co-Ti/NBR Clay). The FTIR analysis was performed over the wavenumber range 600–1600 cm–1 using a Perkin Elmer Spectrum IR instrument version 10.6.1. The TG/DTA was conducted in a nitrogen atmosphere (100 mL min–1) at a heating rate of 5°C min–1 using an STD-Q600 thermal analyzer. The XRD patterns were obtained using an XRD-7000 instrument (Shimadzu) with CuKα source radiation at a scanning speed of 3°2θ min–1 over the range 3 to 90°2θ with a source voltage of 30 kV and a current of 30 mA. For GSA analysis, the samples were degassed using a vacuum for a minimum of 6 h at 150°C. GSA analysis was carried out at a temperature of 77K and a pressure of 1 bar. The Brunauer, Emmett and Teller (BET) method was used to determine the specific surface area, while the total pore volume was taken from the last point of the isotherm. The average pore diameter was determined by the 4V/A method according to BET.
RhB removal
RhB adsorption was carried out in the dark (without UV light), while the photocatalytic degradation study was done using UV light. A 0.1 g sample was dispersed into 50 mL of 40 ppm RhB solution with contact times of 2.5, 5, 7.5, 10, 15, 20, 40, and 80 min in the dark room. In addition, it was also applied with variations in RhB concentrations of 5, 10, 20, 40, and 80 ppm. The photocatalytic degradation study was conducted by dispersing 0.1 g of sample into 50 mL of 40 ppm RhB solution for 10 min in a dark room. Then the mixture was removed and irradiated with a UV lamp (15 Watts) with variations of time: 2.5, 5, 7.5, 10, 15, 20, 40, and 80 min. In addition, it was also applied with variations in RhB concentrations of 5, 10, 20, 40, and 80 ppm. After the process, the mixture was centrifuged to separate the product using a clay catalyst. The product formed was then analyzed using a UV-Vis spectrometer, and the absorbance value was measured.
Results and Discussion
Characterization
Functional group
The functional groups of NBR Clay, NBR Clay+EtOH, Ti/NBR Clay, Ni-Ti/NBR Clay, and Co-Ti/NBR Clay were analyzed by FTIR. The spectra (Fig. 1) describe the absorbance over the range 600–1600 cm–1, a distinct region for clay structures (Borno and Ashraf, Reference Borno and Ashraf2023). All spectra show high and wide peaks at wavenumbers 1039–1050 cm–1, indicating Si–O or Al–O (stretching) groups in Si–O–Si or Al–O–Si (Zhirong et al., Reference Zhirong, Azhar Uddin and Zhanxue2011). All spectra showed a similar shape, indicating that the addition of Ti4+ or doping of Ni2+ and Co2+ did not significantly change the chemical environment.
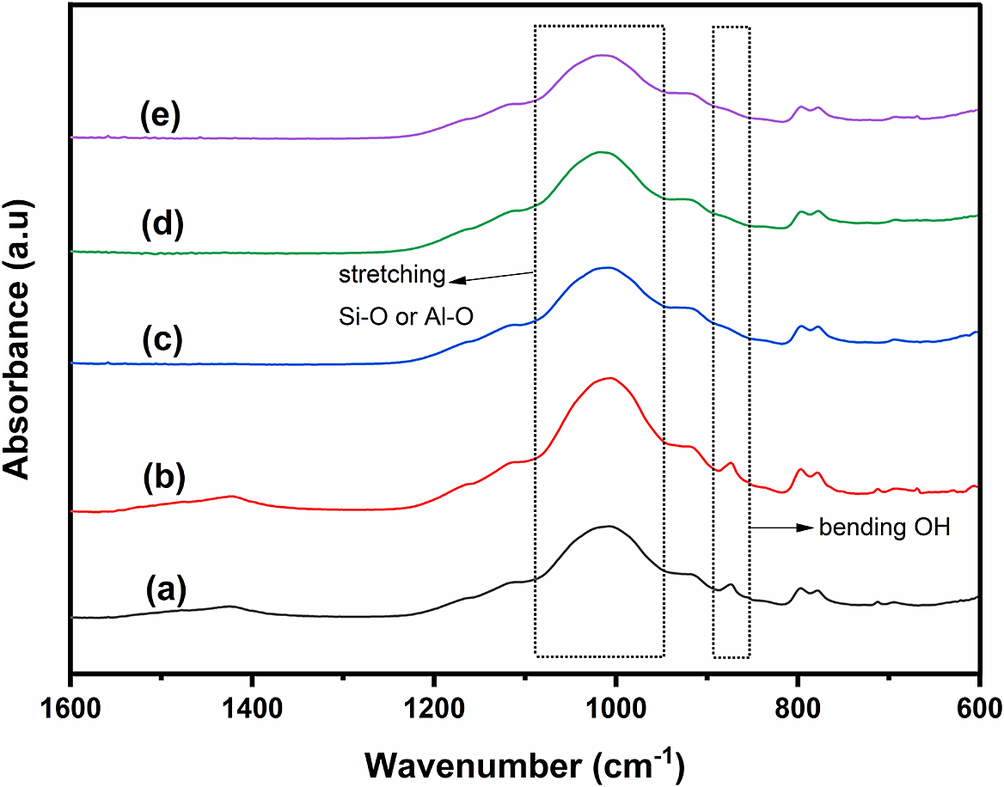
Figure 1. FTIR spectra for (a) Clay, (b) Clay+EtOH, (c) Ti/NBR Clay, (d) Ni-Ti/NBR Clay, and (e) Co-Ti/NBR Clay.
In NBR Clay there is a small peak at wavenumber 880 cm–1, which is lost after the addition of Ti4+ pillar solution. This peak shows the vibration of the OH group bending the Si–OH or Al–OH bonds (Sarier et al., Reference Sarier, Onder and Ersoy2010). The loss of the 880 cm–1 peak indicates a reduction or loss of the OH group in the Si–OH or Al–OH bonds (Yusuf, Reference Yusuf2023). This result might happen because Ti4+ interacts with the OH group, so the Si–OH or Al–OH bonds weaken and form Ti(OH)4 (Yan et al., Reference Yan, Sun, Han, Li and Cui2010).
A broad peak at wavenumber ~1420 cm–1 in clay is the bending vibration of hydroxyl and water molecules in the interlayer region. The peak disappears after the addition of Ti4+. The loss of this peak is caused by dehydration as water molecules are replaced by Ti4+ (Zhang et al., Reference Zhang, Zhang, Li and Zhu2013). Figure 1 shows that with the addition of ethanol and Ti4+, the 980–1050 cm–1 peaks experienced band separation, as indicated by the appearance of a shoulder at ~1030 cm–1. It is suspected that Ti4+ strengthens the stretching vibrations on Si–O, where the O atoms are simultaneously tetrahedral and octahedral layers perpendicular to the layer formation (Karakassides et al., Reference Karakassides, Gournis and Petridis1999). The presence of a small shoulder and peak at ~1110 cm–1 indicates the formation of an asymmetric vibration on Si–O, which is tetrahedral in shape (Ouidri and Khalaf, Reference Ouidri and Khalaf2009).
Assuming that the FTIR absorption band results from the resonance of the absorption bands of each wavenumber, deconvolution of the FTIR spectra was performed using Fityk software to determine band changes. The deconvolution results are presented in Fig. S1 (Supplementary material). There was a change in the shape of the derivation peak from the NBR Clay to NBR Clay+EtOH. Derivative curves 3 (900–930 cm–1) and 4 (1000–1030 cm–1) show the functional groups Si–OH or Al–OH and Si–O–Si or Al–O–Si, respectively. In NBR Clay+EtOH, there is a reduction in the area of the derivation curve 3, and the area ratio between the derivation curves 3 and 4 decreases. This result indicates that adding ethanol reduces the presence of Si–OH or Al–OH. In particular, the ratio of the relationship between the areas of the derivation curves 3 to 4 is presented in Fig. 2. The area ratio of Ti/NBR Clay is greater than that of Ni-Ti/NBR Clay and Co-Ti/NBR Clay, indicating that adding doped Ni2+ and Co2+ reduces the Si–OH functional groups or Al–OH in an alumina silicate framework.
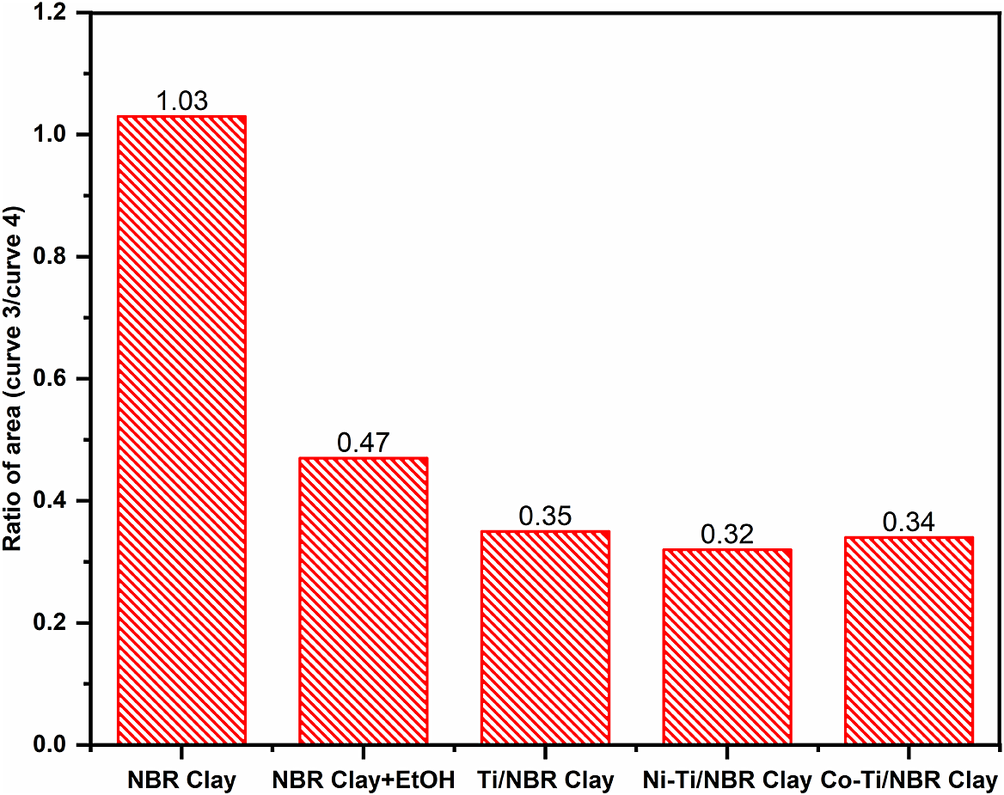
Figure 2. The ratio of the area of curve 3 to the area of curve 4.
Thermal analysis
Thermal stability analysis was carried out using TGA-DSC. The results of the analysis (Fig. 3) show that the decomposition reaction occurring in the sample can be explained in three stages: (a) 50–150°C, (b) 150–650°C, and (c) 650–1000°C.
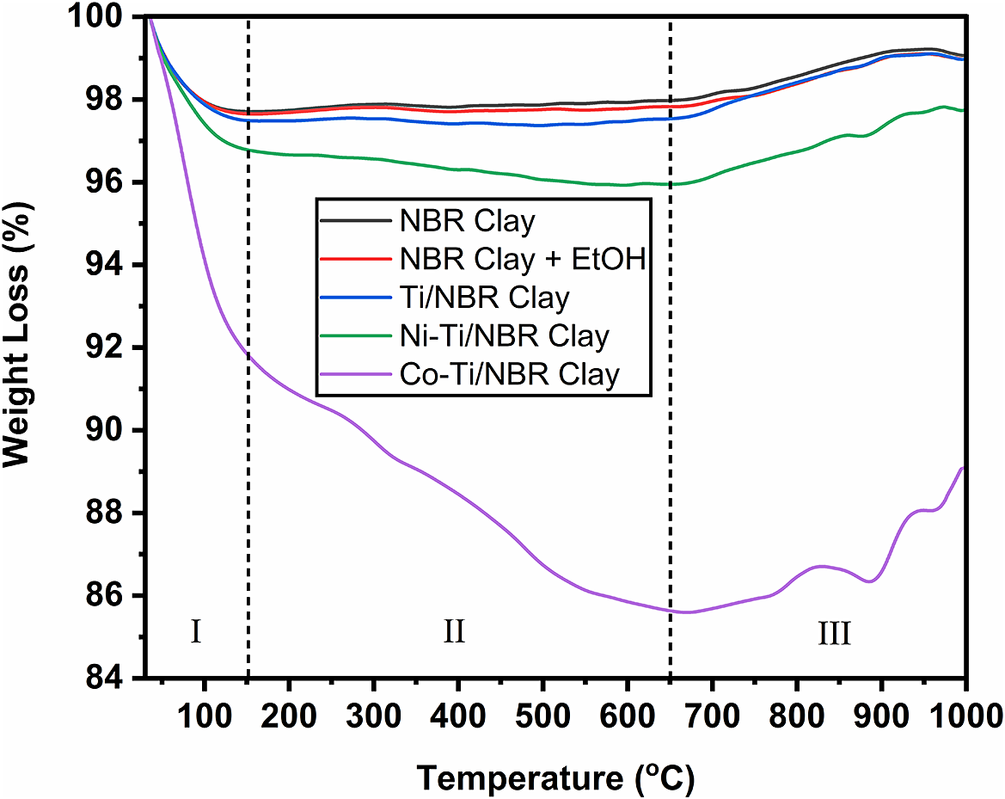
Figure 3. TGA thermograms for Clay, Clay+EtOH, Ti/NBR Clay, Ni-Ti/NBR Clay, and Co-Ti/NBR Clay.
In the first range (I) at a temperature of 50–150°C, there is a reduction in mass for all of NBR Clay, NBR Clay+EtOH, Ti/NBR Clay, Ni-Ti/NBR Clay, and Co-Ti/NBR Clay. The NBR Clay+EtOH has a more significant weight loss than the clay. This is because, in the NBR Clay+EtOH, the compound that evaporates is water and ethanol, while in the clay, the only compound that evaporates is water. Ti/NBR Clay has a more significant mass loss than NBR Clay+EtOH and NBR Clay. This is because the compounds that evaporate in the Ti/NBR Clay are water, ethanol, and Cl– ions, where the Cl– ions come from the TiCl4 compound. The Co-Ti/NBR Clay has the most significant mass loss. This is because, in addition to the evaporation of water, ethanol, and Cl– ions, water decomposition occurs from Co(NO3)2·6H2O to Co(NO3)2·3H2O. However, the decrease for the Ni-Ti/NBR Clay was not as great as that for Co-Ti/NBR Clay because Ni(NO3)2·6H2O did not experience decomposition. The mass loss in Co-Ti/NBR Clay is the largest, ~7.01%, then 2.28% for Ni-Ti/NBR Clay, 1.67% for Ti/NBR Clay, 1.51% for NBR Clay+EtOH, and 1.43% for NBR clay.
The second range (II) covers 150–650°C; the four samples did not experience a sharp decrease in mass because only dehydration or water loss occurred. This water-loss process requires temperatures of >100°C as water is in the area between the clay layers (Ahmad et al., Reference Ahmad, Hussain, Muhammad, Ali, Abbas and Ali2013). The mass loss in Co-Ti/NBR Clay was 6.21%, for Ni-Ti/NBR Clay it was 0.84%, for Ti/NBR Clay it was 0.04%, for NBR Clay+EtOH it was 0.17%, and for Clay it was 0.26%. The sharp decrease in Co-Ti/NBR Clay was due to nitrate decomposition. This nitrate comes from Co(NO3)2, where the nitrate group does not participate in the reaction in the doping process, so it is decomposed during the calcination process (Kumar et al., Reference Kumar, Mariappan, Kumar, Murugavel and Prakash2016). However, nitrate decomposition in Ni(NO3)2 is less extensive than in Co(NO3)2. This is because the nitrate bond with nickel is stronger than with cobalt.
The third range (III) is at temperatures of >650°C. At this stage, weight was increased in all samples, marked by an increase in relative mass. This increase may be due to a reaction between the sample and the oxygen gas in the sweeping gas during the TGA analysis. Samples that react with oxygen produce oxides that stoichiometrically give heavier yields (Starink, Reference Starink2003). This reaction with oxygen occurs due to use of air as a sweeping gas (Laboureur et al., Reference Laboureur, Glabeke and Gouriet2019).
This TGA analysis is supported by the DSC data shown in Fig. 4, and shows the relationship between temperature and heat flow. As with TGA, DSC also explains the occurrence of reaction changes which are described in four stages: (a) 30–150°C, (b) 150–500°C, (c) 500–700°C, and (d) 700–800°C. In the first stage, the temperature is 30–150°C, and an endothermic reaction or heat absorption process occurs in all samples. This can be seen from the downward curve. This endothermic reaction occurs when water and ethanol evaporate in the clay (Bahranowski et al., Reference Bahranowski, Włodarczyk, Wisła-Walsh, Gaweł, Matusik, Klimek, Gil, Michalik-Zym, Dula, Socha and Serwicka2015). The heat absorption is 164.72, 200.13, 158.44, 112.27, and 118.19 J g–1, respectively, for the NBR Clay, NBR Clay+EtOH, Ti/NBR Clay, Ni-Ti/NBR Clay, and Co-Ti/NBR Clay.
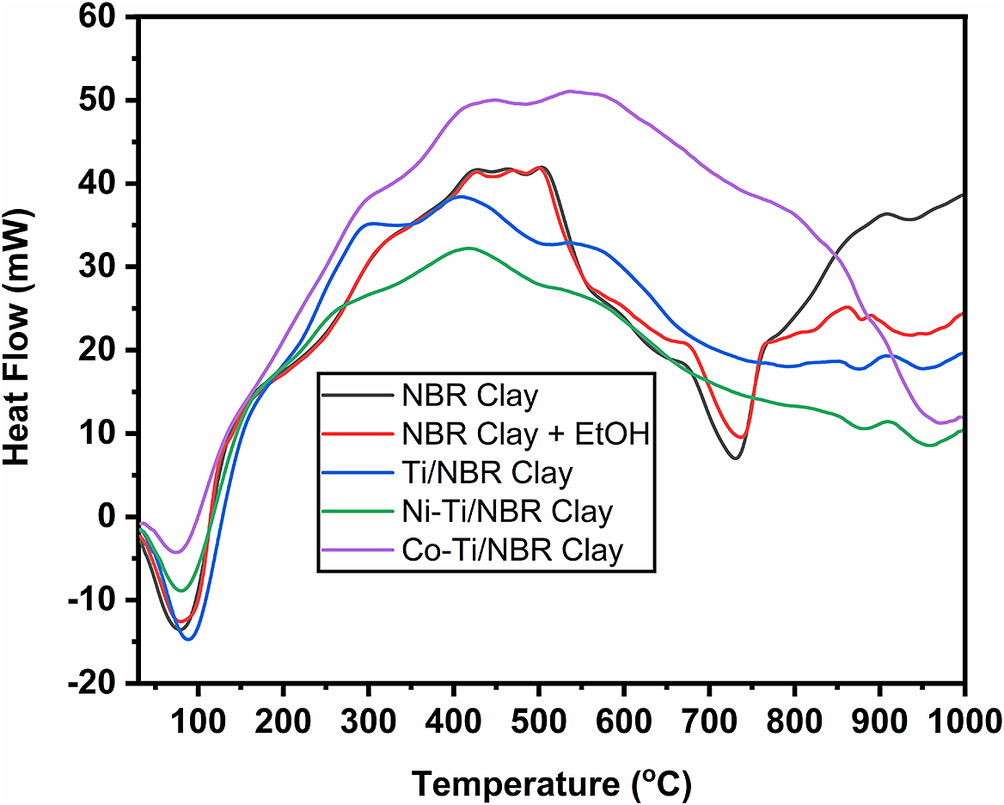
Figure 4. DSC thermogram of titania-pillared clay doped with nickel and cobalt.
In the second stage, the temperature is 150–500°C, and an exothermic reaction or heat release occurs in all samples, which is marked by an increasing curve. This exothermic reaction occurs because the clay has experienced shrinkage. The heat release is 1339.95, 259.12, 93.28, 122.77, and 60.09 J g–1, respectively, for NBR Clay, NBR Clay+EtOH, Ti/NBR Clay, Ni-Ti/NBR Clay, and Co-Ti/NBR Clay.
In the third stage, at 500–700°C, an endothermic reaction occurs in NBR Clay, NBR Clay+EtOH, Ti/NBR Clay, Ni-Ti/NBR Clay, and Co-Ti/NBR Clay. This reaction occurs as there is further shrinkage caused by burning at high temperatures (Zhang et al., Reference Zhang, Li, Wang and Sun2022). For NBR clay, heat absorption is 189.07 J g–1; for NBR Clay+EtOH, it is 153.22 J g–1; for Ti/NBR Clay, it is 245.05 J g–1; for Ni-Ti/NBR Clay, it is 127.11 J g–1, and for Co-Ti/NBR Clay it is 80.57 J g–1.
At temperatures between 700 and 800°C, there is a clear difference between the clay before and after being pillared with TiO2. In the Clay and NBR Clay+EtOH, there are depressions. However, after pillaring with TiO2, the concavity disappeared. The DSC appears to peak at 800°C, indicating Ti metal presence (Bahranowski et al., Reference Bahranowski, Włodarczyk, Wisła-Walsh, Gaweł, Matusik, Klimek, Gil, Michalik-Zym, Dula, Socha and Serwicka2015), so it can be assumed that the loss of the depression is due to the presence of Ti metal. From the TGA-DSC, titania-pillared clay is stable at 650°C, because the calcination temperature above 650°C causes the clay to collapse. However, the calcination temperature is <650°C, leaving organic impurities.
Crystal structure
All samples obtained were characterized using XRD. Figure 5 presents the XRD patterns of clay and pillared clay. There is a low-intensity peak at <10°2θ which indicates that NBR Clay is a smectite-type clay. Additionally, peaks appear at 19.35 and 62°2θ which are characteristic of the mineral montmorillonite. However, the presence of sharp peaks at 26.6 and 21°2θ, characteristic of quartz, indicates that NBR clay is not pure but mixed with quartz. Although separation was carried out initially, this process cannot wholly separate montmorillonite from quartz. In addition, a broad peak in the range 5–10°2θ indicates the d 001 plane (Costache et al., Reference Costache, Heidecker, Manias and Wilkie2006). Peaks were observed at 5.66, 8.76, 9, and 8.82°2θ=5.66 with d 001 values of 15.72 Å, 10.095 Å, 9.875 Å, and 10.029 Å, respectively for each of NBR Clay, Ti/NBR Clay, Ni-Ti/NBR Clay, and Co-Ti/NBR Clay. For NBR Clay+EtOH, there is no visible peak in the <10°2θ region. A peak at 5.66°2θ in clay is due to interlayer cations (Na+ or Ca2+), which are hydrated by water so that they can enlarge the galleries between layers. Meanwhile, ethanol is an organic solvent that does not cover interlayer ions well. As a result, the interlayers are not open enough. In addition, ethanol is more volatile and is not bound too tightly to clay. As a result, there is no liquid in the spaces between layers, resulting in reduced interlayer sizes. The XRD pattern also shows that the d 001 peak is always broad unlike that at 26.6°2θ. This indicates that the clay layer is amorphous and not crystalline. The sharp peak, at 26.6°2θ, is not from clay but from quartz mixed in the clay. These results indicate that quartz mixes evenly in the clay.
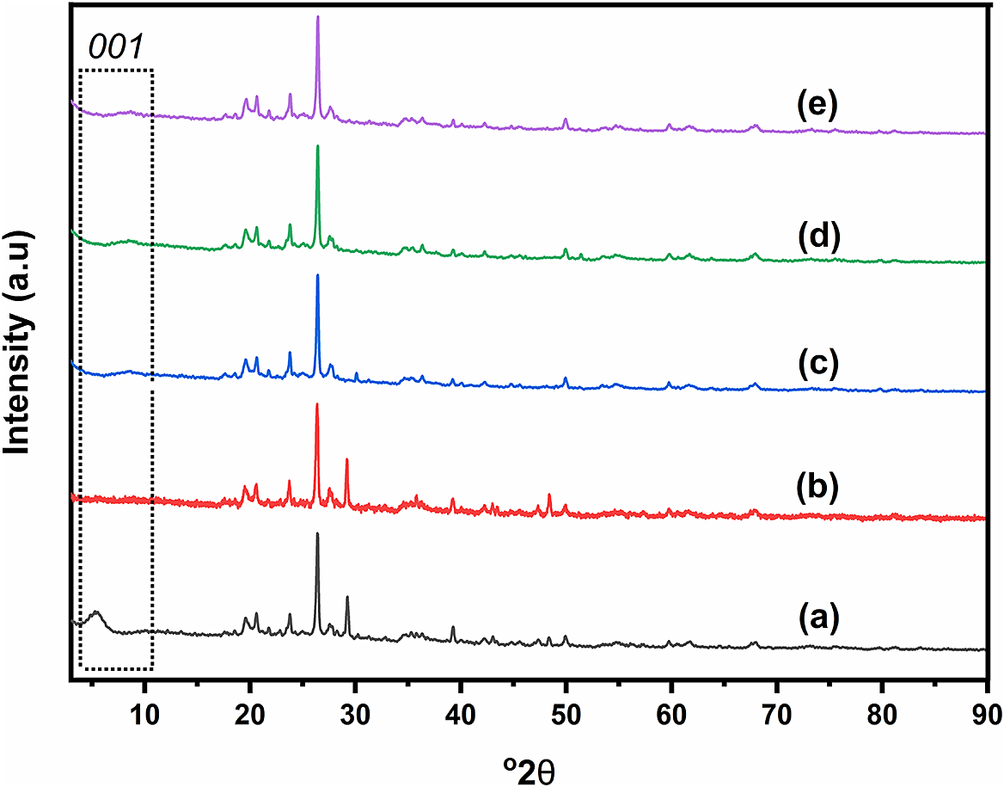
Figure 5. XRD patterns of (a) Clay, (b) NBR Clay+EtOH, (c) Ti/NBR Clay, (d) Co-Ti/NBR Clay, and (e) Ni-Ti/NBR Clay.
Figure 5 also shows that there is a shift in the d 001 peak from 5.66°2θ on clay to 8.76, 9 and 8.82°2θ for Ti/NBR Clay, Co-Ti/NBR Clay and Ni-Ti/NBR Clay, respectively, with d 001 values of 10.095 Å, 9.875 Å, and 10.029 Å. The clay peak shift to larger 2θ values (smaller d 001 values) indicates that the pillarization process was successful. NBR Clay heated at >200°C loses water, and the area between the clay layers shrinks, so there is no d 001 peak at <10°2θ (Johnson and Post, Reference Johnson and Post2006). However, the existence of pillars can maintain the existence of interlayer areas. The presence of the d 001 peak after the addition and calcination of Ti4+ indicates that cation exchange occurs where the interlayer clay cations are replaced by Ti4+ to further turn into TiO2 oxide during the calcination (Li et al., Reference Li, Cai, Guo, Zhou and Na2015). TiO2 is what becomes a pillar in the area between layers. However, the d 001 produced by TiO2 pillars is not as big as d 001 in natural clay.
The 2θ values for Ni-Ti/NBR Clay and Co-Ti/NBR Clay are similar to those for Ti/NBR Clay. These results indicate that adding Co2+ and Ni2+ does not affect the size of d 001. It can be said that the size of the pillars is the same so the pillars forming only come from Ti4+. Ni2+ and Co2+ only stick or are in the interlayer cavities of NiO and CoO (and so do not bind with Si–O–Si).
Surface character
Isothermic analysis determines pore volume, surface area, and pore distribution on a micro- or meso-scale. The results of the analysis (Fig. 6) show that the adsorption–desorption curves of all samples are close to type IV, which characterizes mesoporous materials, and the presence of hysteresis of all samples indicates type H4, which implies that the sample has pores with narrow gaps with unusual properties, weak interaction state with adsorbate and has a porous adsorbent (ALOthman, Reference ALOthman2012). The H4 type implies the formation of capillary condensation in the clay pores, and the H4 type is characteristic of montmorillonite minerals (Zhu et al., Reference Zhu, Zhu, Zhu, Tian and Li2009).
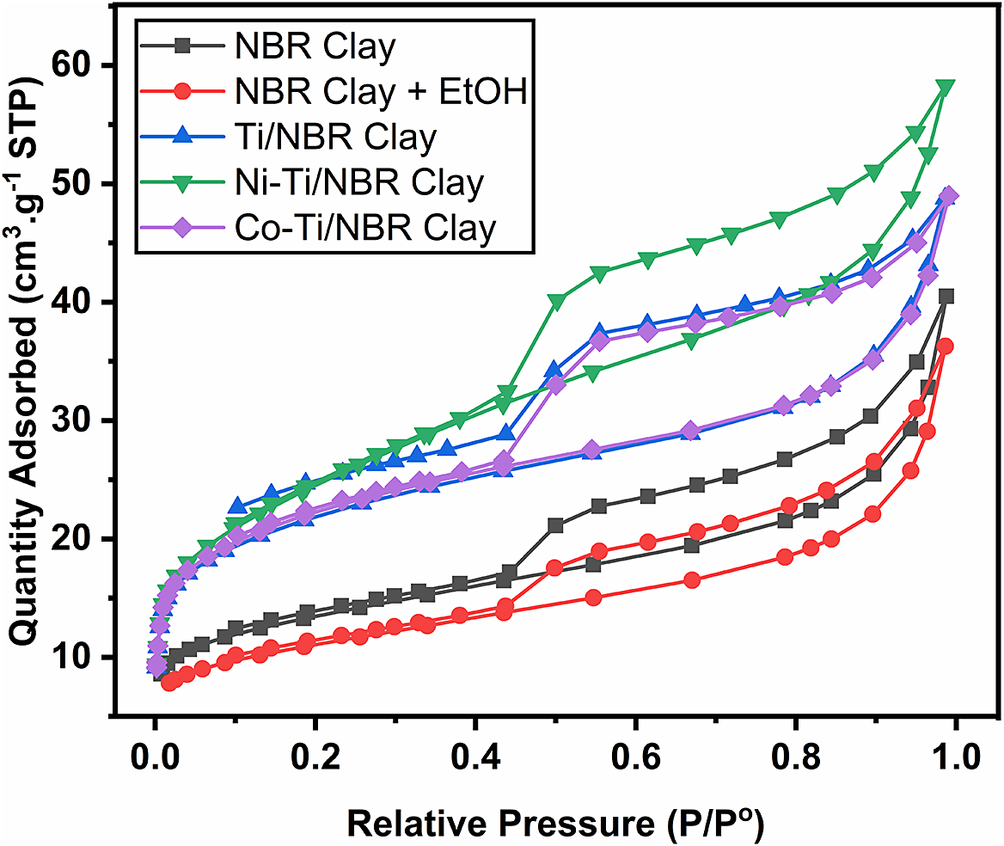
Figure 6. Adsorption–desorption curves of Clay, Clay+EtOH, Ti/NBR Clay, Ni-Ti/NBR Clay, and Co-Ti/NBR Clay.
Figure 6 also shows that the amount of adsorbed nitrogen increases with pillarization with Ti4+ and doping with Co2+ and Ni2+. This shows that the pillarization process increases the adsorption capacity of the clay due to the expansion of the galleries in the interlayer area due to the formation of pillars. The increase in adsorption may also be caused by the strong interaction between TiO2 and nitrogen gas, so the amount of adsorbed nitrogen increases.
Table 1 shows that the pore diameter does not show significant variation. The average pore diameter ranges from 40 to 59 Å, while the surface area and pore volume tend to show the same pattern. This means that the pillarization process does not cause changes in pore size. This also indicates that the height of the TiO2 pillars is fixed and uniform in all layers of the interlayer space. The increase in pore diameter for Clay of 54 Å to NBR Clay+EtOH of 58.5 Å was caused more by the expansion of the pores because the pore impurities were cleaned by ethanol.
Table 1. Specific surface area (S BET), pore volume (V T), and pore diameter (d) of the samples

The pore size decreased after pillaring with pore diameters for Ti/NBR Clay, Ni-Ti/NBR Clay, and Co-Ti/NBR Clay, which are 40.4 Å, 41.3 Å, and 39.9 Å, respectively, indicating that Ti pillars produced larger pore sizes. Adding Ni and Co doping does not significantly change the pores of the pillared clay. The decrease in the pore diameter of Ti-pillared clay compared with Clay and NBR Clay+EtOH signifies that the swelling process in the clay layer does not occur in the pillared clay any more. Pillarization of clay by Ti4+ causes the swelling ability of the clay to decrease because Ti4+ binds between layers of clay and reduces the distance between layers of clay. This phenomenon is proven by the shift of peak d 001 at <10°2θ toward a smaller 2θ value, indicating a narrowing of the interlayer distance and swelling of the clay. On the other hand, adding ethanol to clay causes the surface area and pore volume to decrease. This is due to the non-opening of the interlayer region, as shown by the lack of a d 001 peak at <10°2θ.
The surface area and pore volume of Ti/NBR Clay are almost the same as Co-Ti/NBR Clay, but what is interesting is that for Ni-doped on Ti-pillared clay, the surface area and pore volume increase and are greater than Ti/NBR Clay and Co-Ti/NBR Clay. The large surface area and pore volume may be because NiO is more evenly distributed in the pillared clay.
RhB adsorption
In general, porous materials have the potential to adsorb, especially macromolecules. This adsorption study was necessary because it contributes to our knowledge about the removal of RhB. Adsorption is influenced by several factors, such as the adsorbent’s pore size, the adsorbate’s size, and the adsorbate’s or adsorbent’s charge (Liu et al., Reference Liu, Xie, Wang, Chen and Hu2019; Huang and Yang, Reference Huang and Yang2020). The adsorption of the RhB solution is shown in Fig. 7.

Figure 7. The adsorption (%) of RhB in Clay, Clay+EtOH, Ti/NBR Clay, Ni-Ti/NBR Clay, and Co-Ti/NBR Clay. Adsorption was carried out at room temperature with an RhB concentration of 40 mg L–1. The inset explains the adsorption process over shorter times for clarity.
The adsorption percentages by the NBR Clay and NBR Clay+EtOH show significant increases from 0 to 2.5 min with adsorptions of 91.27 and 92.15%, respectively. NBR Clay and NBR Clay+EtOH show the greatest adsorption at 80 min at 96.32 and 98.02%, respectively, while Ti/NBR Clay, Ni-Ti/NBR Clay, and Co-Ti/NBR Clay are optimum at 15 min with adsorption levels of 97.45, 98.56, and 97.74%, respectively; the greatest degrees of adsorption achieved were 99.83, 99.91, and 99.93%, respectively. At 2.5 min, the NBR Clay and NBR Clay+EtOH showed much greater adsorption than the Ti/NBR Clay, Ni-Ti/NBR Clay, and Co-Ti/NBR Clay. This could be due to the larger pore sizes of the NBR Clay and NBR Clay+EtOH than the Ti/NBR Clay, Ni-Ti/NBR Clay, and Co-Ti/NBR Clay so that the RhB molecule enters the pores quickly and shows significant adsorption within the first minute. This contrasts with Ti/NBR Clay, Ni-Ti/NBR Clay, and Co-Ti/NBR Clay, which have tiny pores despite their large pore volume and large surface area, resulting in significant adsorption even though the adsorption rate is slower.
Adsorption isotherms and thermodynamic
The adsorption model of RhB on clay was examined with several models, such as Langmuir, Freundlich, and Temkin (Table S1 in the Supplementary material) (Pareek et al., Reference Pareek, Jain, Hussain, Biswas, Shrivastava, Parida, Kisan, Lgaz, Chung and Behera2019). The Langmuir isotherm graph of RhB in the sample is shown in Fig. 8. The Langmuir isotherm adsorption model has a correlation coefficient (r) >0.99, which indicates that the Langmuir isotherm model is the most suitable at representing the adsorption. The Langmuir model is used for adsorption processes in which the adsorbate–adsorbent interaction is specific, and all the active sites are energetically equivalent; therefore, the process is considered to be homogeneous (Bernal et al., Reference Bernal, Giraldo and Moreno-Piraján2018). The Langmuir isotherm adsorption equation is as follows:
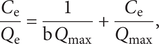 $$ \frac{C_{\mathrm{e}}}{Q_{\mathrm{e}}}=\frac{1}{\mathrm{b}\;{Q}_{\mathrm{max}}}+\frac{C_{\mathrm{e}}}{Q_{\mathrm{max}}}, $$
where C
e is the equilibrium concentration (mg L–1), Q is the adsorbed capacity, Q
max is the monolayer coverage of adsorbed RhB (mg g–1), and b is the Langmuir constant (L mg–1). The $ \frac{C_{\mathrm{e}}}{Q\mathrm{e}} $
vs C
e plot produces a straight line, and the Q
max is obtained from the gradient plot, while b is obtained from the intercept plot.
$ \frac{C_{\mathrm{e}}}{Q\mathrm{e}} $
vs C
e plot produces a straight line, and the Q
max is obtained from the gradient plot, while b is obtained from the intercept plot.
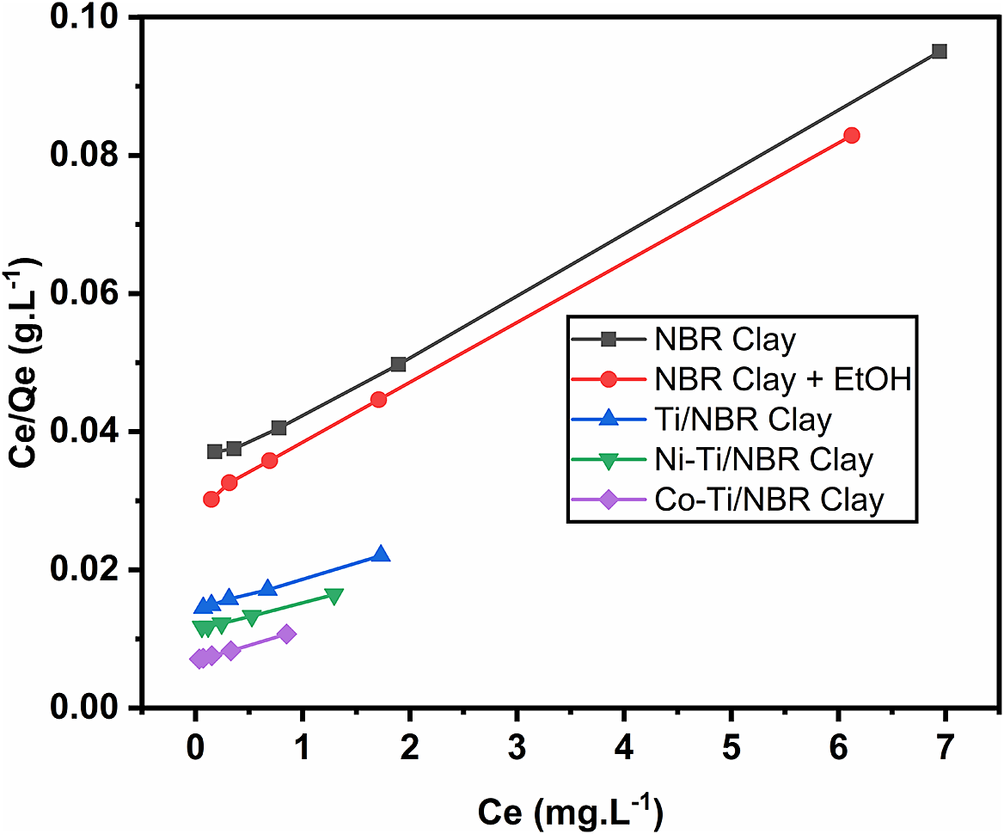
Figure 8. Langmuir isotherm curve of RhB on the surface of the adsorbent.
The thermodynamics study of the adsorption of RhB on clay is viewed from the point of view of the Gibbs free energy (ΔG°ads). The Gibbs free energy of adsorption can be determined from the K0 using the following equation:
 $$ {\mathrm{K}}_0=\frac{Q_{\mathrm{e}}}{C_{\mathrm{e}}} $$
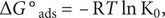 $$ \Delta G{{}^{\circ}}_{\mathrm{ads}}=\hbox{--} \mathrm{R} T\;\ln\;{\mathrm{K}}_0, $$
where Q e is the surface concentration of RhB, K0 is the thermodynamic equilibrium constant, R is the gas constant (R=8.314 J mol–1 K–1), and T is the thermodynamic temperature (T=298K) (Khalaf et al., Reference Khalaf, Tantawy, Soliman and Abd El-Lateef2020). The values of b, Q max, K0, and ΔG°ads of RhB adsorption on the adsorbent are shown in Table 2. The b, K0, and ΔG°ads showed the largest results for Co-Ti/NBR Clay and the lowest on clay. The b and K0 is a manifestation of the adsorption activity of the adsorbent, where the greater the value of b and K0, the greater the adsorption. The ΔG°ads also indicates the adsorption energy where the more negative the ΔG°ads, the greater the adsorption. Note that values of ΔG°ads that are close to 20 kJ mol–1 or less are compatible with physisorption, while values of ~40 kJ mol–1 or more are compatible with chemisorption (Mourya et al., Reference Mourya, Singh, Tewari, Rastogi and Singh2015). In this study, the ΔG°ads for all samples were <20 kJ mol–1, indicating that the adsorption mechanism of RhB on the sample surface is classified as a physisorption mechanism.
Table 2. Langmuir parameters Q max, K0, and ΔG°ads from the adsorption of RhB on the adsorbent prepared at 298K

The results of surface analysis (Table 1) indicate that the pore diameter values for NBR Clay+EtOH and NBR Clay significantly exceed those of Ti/NBR Clay, Ni-Ti/NBR Clay, and Co-Ti/NBR Clay, thereby accounting for their increased adsorption activity. Despite the opposing outcomes observed in S BET and V T values, the adsorption values consistently align with the trends in pore diameter (d). A larger d value facilitates the easy ingress of RhB molecules into the clay pores, consequently resulting in increased adsorption values. These findings further substantiate the rationale behind the greater adsorption values observed in Ni-Ti/NBR Clay compared with Ti/NBR Clay and Co-Ti/NBR Clay.
Adsorption kinetics
The adsorption kinetics of RhB by NBR Clay, NBR Clay+EtOH, Ti/NBR Clay, Co-Ti/NBR Clay, and Ni-Ti/NBR Clay can be represented by pseudo-first order and pseudo-second order. The pseudo-first order and pseudo-second order kinetic models are expressed in the following equations:
Pseudo-first order:
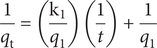 $$ \frac{1}{q_{\mathrm{t}}}=\left(\frac{{\mathrm{k}}_1}{q_1}\right)\left(\frac{1}{t}\right)+\frac{1}{q_1} $$
Pseudo-second order:
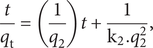 $$ \frac{t}{q_{\mathrm{t}}}=\left(\frac{1}{q_2}\right)t+\frac{1}{{\mathrm{k}}_2.{q}_2^2}, $$
where q
t is the adsorption capacity of RhB at a certain time (mol g–1) at various times, t (min); q
1 is the maximum adsorption capacity (mol g–1) for pseudo-first order adsorption, k1 is the pseudo-first order rate constant for adsorption process (min–1), q
2 is the maximum adsorption capacity (mol g–1) for pseudo-second order adsorption, and k2 is the rate constant pseudo-second order for adsorption (g mol–1 min–1). The $ \frac{1}{q_{\mathrm{t}}} $
vs
$ \frac{1}{q_{\mathrm{t}}} $
vs $ \frac{1}{t} $
plot is used for pseudo-first order equations, while the
$ \frac{1}{t} $
plot is used for pseudo-first order equations, while the $ \frac{t}{q_{\mathrm{t}}} $
vs t plot is for pseudo-second order equations (Fig. S2 in the Supplementary material). Based on the applied adsorption kinetics model, the pseudo-second order adsorption kinetics model has a correlation coefficient (R) closest to 1 (Table S2 in the Supplementary material). These values indicate that the kinetic route of RhB adsorption on the sample surface follows a pseudo-second order kinetic model. The values of k2 and q
2 calculated from these equations are shown in Table 3.
$ \frac{t}{q_{\mathrm{t}}} $
vs t plot is for pseudo-second order equations (Fig. S2 in the Supplementary material). Based on the applied adsorption kinetics model, the pseudo-second order adsorption kinetics model has a correlation coefficient (R) closest to 1 (Table S2 in the Supplementary material). These values indicate that the kinetic route of RhB adsorption on the sample surface follows a pseudo-second order kinetic model. The values of k2 and q
2 calculated from these equations are shown in Table 3.
Table 3. Pseudo-second order reaction kinetic parameters of RhB on the adsorbent
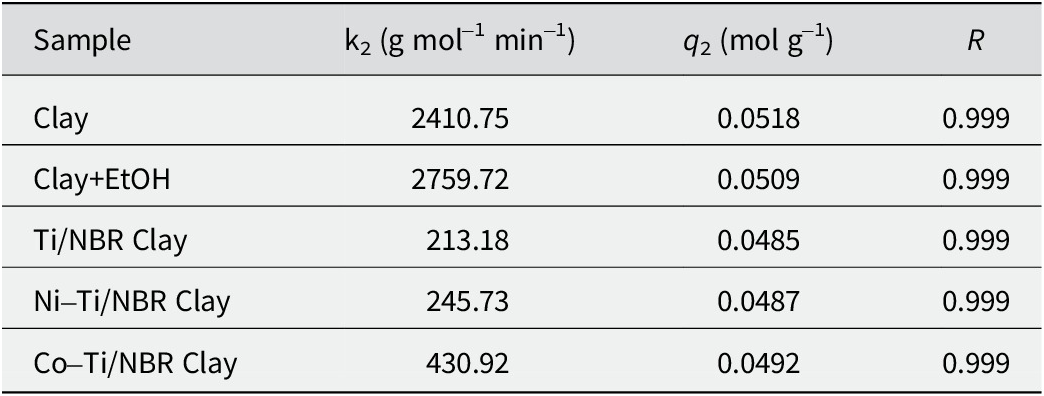
The value of the rate constant (k2) and maximum adsorption capacity (q 2) of Co-Ti/NBR Clay > Ni-Ti/NBR Clay > Ti/NBR Clay, where these results are linear with the adsorption energy. The k2 and q 2 of Clay and NBR Clay+EtOH are greater than those of Ti/NBR Clay, Ni-Ti/NBR Clay, and Co-Ti/NBR Clay, even though the adsorption energy values are smaller. This phenomenon can occur because the pore size of NBR Clay and NBR Clay+EtOH is larger than those of Ti/NBR Clay, Ni-Ti/NBR Clay, and Co-Ti/NBR Clay, so RhB molecules are absorbed much more quickly. The molecular size of RhB is 1.44 nm, and the pore size of Clay and NBR Clay+EtOH is four times as large, while Ti/NBR Clay, Ni-Ti/NBR Clay, and Co-Ti/NBR Clay are only three times as large as RhB (Huang et al., Reference Huang, Huang, Liu, Wang and Yan2008).
RhB photodegradation
The photocatalytic degradation process was carried out by dispersing titania-pillared clay doped with nickel and cobalt into the RhB solution, incubated in the dark, and then irradiated with a UV lamp (Fig. 9). The treatment without UV radiation (dark) was carried out for 10 min, which is the adsorption saturation point, so it is considered that adsorption has no effect on RhB removal and only photocatalytic degradation activity has an effect (Helali et al., Reference Helali, Puzenat, Perol, Safi and Guillard2011). Based on Fig. 9, the optimum point of RhB degradation occurred at 40 min, where the RhB degradation of all samples exhibits almost the same value at 40 min. The percentage of degradation shows an increase in the removal of RhB compared with the percentage of adsorption, which proves the occurrence of photocatalytic degradation.
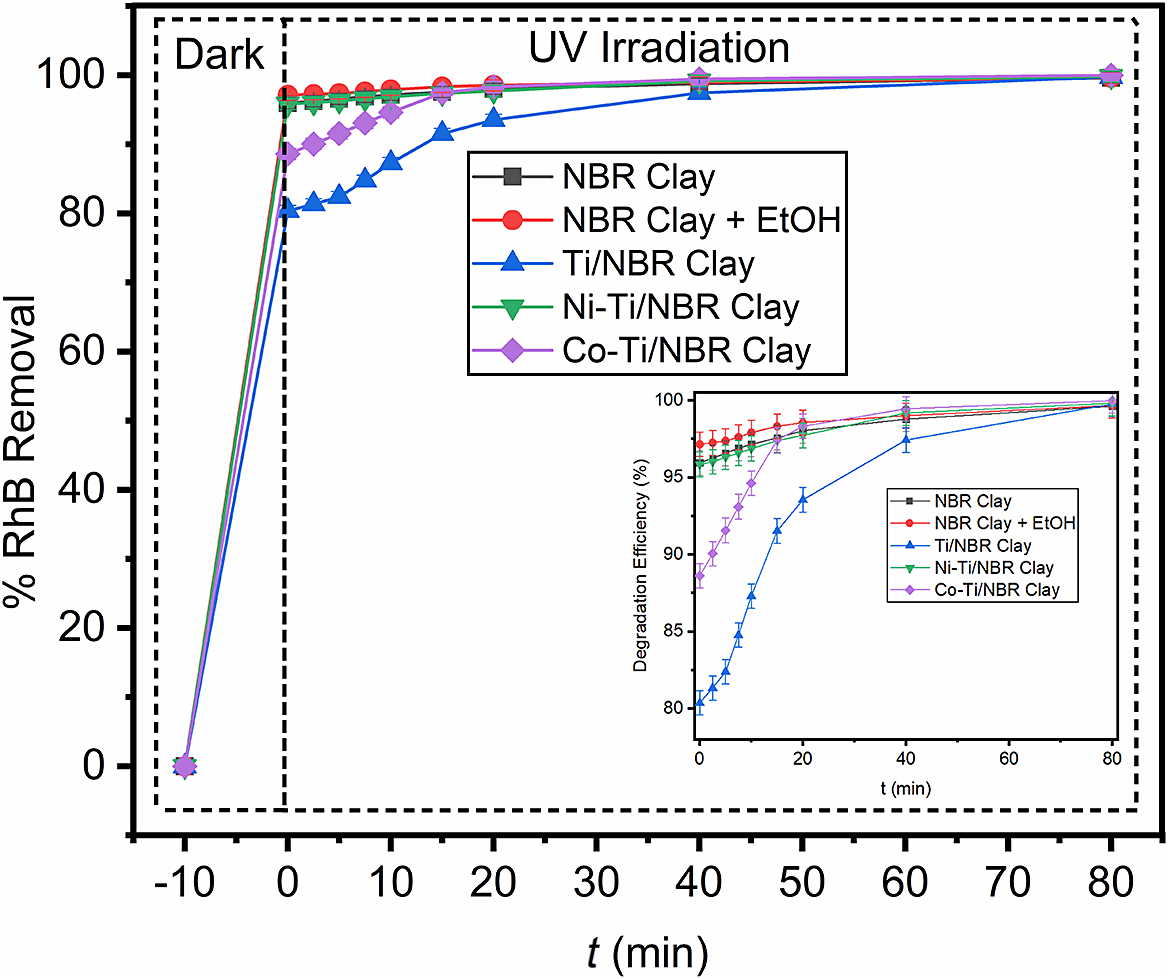
Figure 9. Degradation (%) of RhB solution with Clay, Clay+EtOH, Ti/NBR Clay, Ni-Ti/NBR Clay, and Co-Ti/NBR Clay in UV radiation. The application test was carried out using a 40 ppm RhB solution.
Kinetics of RhB photodegradation
Kinetic models of degradation of RhB solutions with nickel- and cobalt-doped titania-pillared clay samples in aqueous solutions were investigated. The reaction rate (R, mg L–1 min–1) of degradation is expressed as follows:
 $$ R=\frac{\mathrm{k} K{C}_{\mathrm{e}}}{1+K{C}_{\mathrm{e}}}, $$
where C e is the concentration of RhB (mg L–1), k is the reaction rate constant, and K is the adsorption coefficient of RhB (L mg–1). For lower initial concentrations of RhB, such as in ppm, the equation can be simplified by means of a first-order equation (El-Sharkawy et al., Reference El-Sharkawy, Soliman and Al-Amer2007). The first-order Langmuir-Hinshelwood equation is expressed as follows:
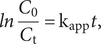 $$ \mathit{\ln}\frac{C_0}{C_{\mathrm{t}}}={\mathrm{k}}_{\mathrm{app}}t, $$
where C
0 and C
t are RhB concentrations before and after irradiation (mg L–1), t is the irradiation time (min), and kapp is the degradation rate constant (min–1) (Alakhras et al., Reference Alakhras, Alhajri, Haounati, Ouachtak, Addi and Saleh2020). The $ \mathit{\ln}\frac{C_0}{C_{\mathrm{t}}} $
vs t plot (Fig. 10) gives a straight line with R>0.9, indicating that the photocatalytic degradation of RhB follows first-order kinetics. The resulting line gradient shows the value of the degradation rate constant (kapp) of RhB.
$ \mathit{\ln}\frac{C_0}{C_{\mathrm{t}}} $
vs t plot (Fig. 10) gives a straight line with R>0.9, indicating that the photocatalytic degradation of RhB follows first-order kinetics. The resulting line gradient shows the value of the degradation rate constant (kapp) of RhB.

Figure 10. Plotted curve $ \mathit{\ln}\frac{C_0}{C_t} $
vs t of Clay, Clay+EtOH, Ti/NBR Clay, Ni-Ti/NBR Clay, and Co-Ti/NBR Clay.
$ \mathit{\ln}\frac{C_0}{C_t} $
vs t of Clay, Clay+EtOH, Ti/NBR Clay, Ni-Ti/NBR Clay, and Co-Ti/NBR Clay.
The degradation rate constant (kapp) of RhB solution from Co-Ti/NBR Clay (0.0779 min–1) > Ti/NBR Clay (0.0556 min–1) > Ni-Ti/NBR Clay (0.0395 min–1) > NBR Clay (0.0291 min–1) > NBR Clay+EtOH (0.0265 min–1). The Ti/NBR Clay, Ni-Ti/NBR Clay, and Co-Ti/NBR Clay showed more significant photocatalytic activity for degrading RhB solutions than NBR Clay and NBR Clay+EtOH. It also shows that the Co-Ti/NBR Clay has the best photocatalytic activity compared with other samples. The rate constants of degradation of Ti/NBR Clay, Ni-Ti/NBR Clay, and Co-Ti/NBR Clay are greater than those of NBR Clay and NBR Clay+EtOH, which indicates that Ti-pillared clay can enhance photocatalytic activity. Such structures can capture photo-induced electrons and inhibit further recombination of electrons and holes. Thus, it can enhance the photocatalytic activity of photocatalysts to a large extent (Yang et al., Reference Yang, Li, Chen and Wang2004). In addition, with Co doping, the kapp increases. Metal doping can reduce the bandgap so that electrons from the valence band move easily to the conduction band, and RhB is more easily degraded. However, Ni-Ti/NBR Clay has a smaller kapp than Ti/NBR Clay. This phenomenon could be due to the predominance of Ni-Ti/NBR Clay adsorption activity, so the photocatalytic degradation activity was not monitored clearly.
Photodegradation at various concentrations of RhB
Application tests were carried out by photocatalytic degradation of Rhodamine solution at various concentrations (5, 10, 20, 40, and 80 ppm). The results of the photocatalytic degradation of the RhB solution are presented in Fig. 11. In general, all samples showed decreased degradation ability with increasing RhB concentration. The greater the concentration, the more RhB molecules that must be degraded. With the same amount of catalyst, an increase in RhB concentration decreases the degradation percentage. In the NBR Clay and NBR Clay+EtOH, there was an increase in degradation from the RhB concentration of 5 to 10 mg L–1. The Clay and NBR Clay+EtOH had little or no photocatalytic activity, as evidenced by the RhB removal value, i.e. there was little difference between photocatalytic adsorption and degradation. Most of the RhB removal results can be considered contributions from the adsorption activity of NBR Clay and NBR Clay+EtOH, and the RhB concentration of 10 mg L–1 is the adsorption saturation point. NBR Clay and NBR Clay+EtOH experienced a significant decrease in the percentage of degradation at RhB concentrations above 40 mg L–1. Meanwhile, the degradation percentage for Ni-Ti/NBR Clay and Co-Ti/NBR Clay at RhB concentrations above 40 mg L–1 tended to be constant. These results indicate the contribution of photocatalytic activity due to the presence of Ni and Co metals as doping.
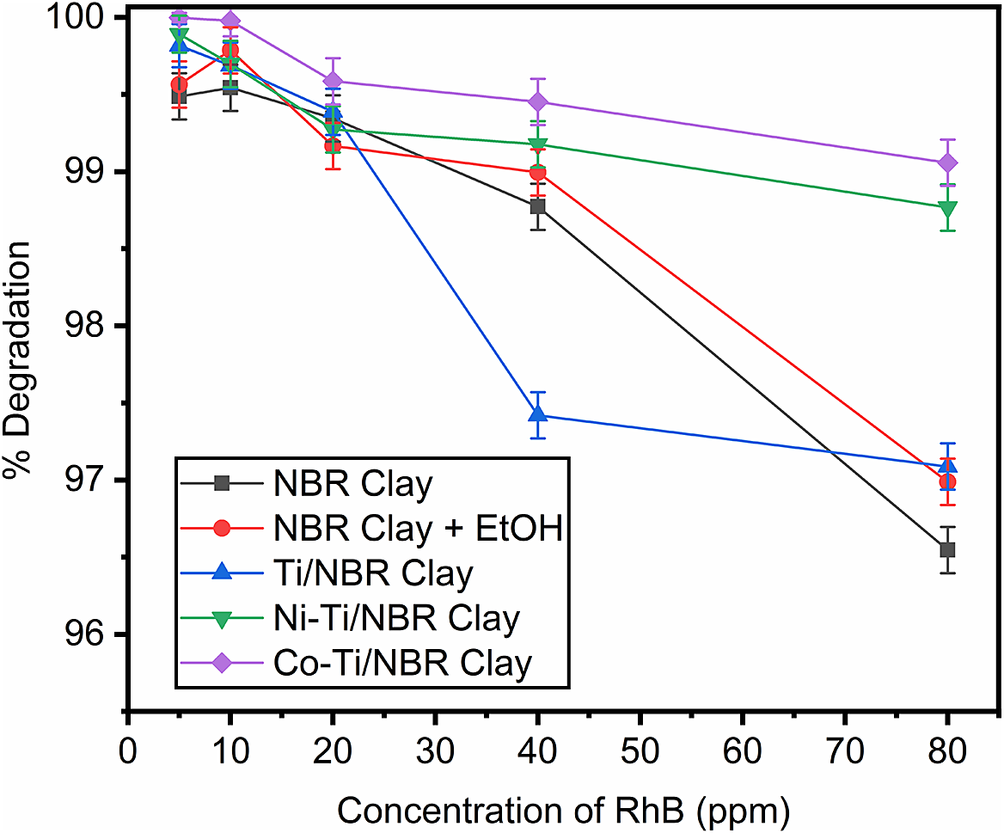
Figure 11. Photodegradation of RhB by UV light-irradiated samples. Photodegradation was carried out at room temperature for 40 min.
In addition, the difference in degradation percentage between NBR Clay and NBR Clay+EtOH and the Ni-Ti/NBR Clay and Co-Ti/NBR Clay at an RhB concentration of 80 mg L–1 was ~2.14%. These phenomena indicate that at high RhB concentrations (C RhB >40 mg L–1), photocatalytic activity is more visible and predominates. The percentage degradation of the Ti/NBR Clay also decreased with increasing RhB concentration and decreased drastically when the RhB concentration was 20 mg L–1 to 40 mg L–1 of 1.97%. The Ti/NBR Clay has a much smaller pore size than the other samples, so the adsorption ability is small, and the RhB removal is also small. Like the Ni-Ti/NBR Clay and Co-Ti/NBR Clay, the Ti/NBR Clay also showed a constant degradation percentage at RhB concentrations from 40 to 80 mg L–1. At an RhB concentration of 80 mg L–1, the degradation percentage was 97.09%, greater than NBR Clay and NBR Clay+EtOH. This phenomenon indicates the contribution of the photocatalytic activity of the Ti/NBR Clay.
Mechanism of photocatalytic degradation
The photocatalytic degradation mechanism of RhB solution on titania-pillared clay samples and doped with Ni and Co metals was studied. Titania, a semiconductor metal, has photocatalytic activity when irradiated by UV (Wold, Reference Wold1993). Adding Ni and Co metals as doping agents also increases the photocatalytic activity. The presence of doping can reduce the bandgap of titanium so that electrons from the valence band move easily to the conduction band (Guan et al., Reference Guan, Yu, Guo, Yu and Han2020).
The degradation of colored solutions by light can be divided into three mechanisms: (1) a photolysis process induced by light energy from a light source; (2) the photosensitization process, in which light irradiation excites electrons to the conduction band along with the oxidation of the dye; and (3) a proper heterogeneous photocatalytic process in which the promotion of electrons from the valence band to the conduction band produces holes for the oxidation of the dye (Martínez-de la Cruz et al., Reference Martínez-de la Cruz and Pérez2010). RhB solution is stable for a long time so that the photolysis process can be ignored. The mechanism of RhB degradation in Ti/NBR Clay, Ni-Ti/NBR Clay, and Co-Ti/NBR Clay is dominated by photosensitization and photocatalytic processes:
Photosensitization process (Zhao et al., Reference Zhao, Li, Liu, Gu, Du and Shi2008):
RhBads+hυ → RhBads*
RhBads*+Ti/NBR Clay → RhBads ●+ +Ti/NBR Clay (ecb–)
Ti/NBR Clay (ecb–)+O2 → O2 ●– and Ti/NBR Clay (ecb–)+H2O → OH ●
Photocatalytic process (Wilhelm et al., Reference Wilhelm and Stephan2007):
Ti/NBR Clay+hυ → Ti/NBR Clay (e−)+Ti/NBR Clay (h+)
RhBads+Ti/NBR Clay (h+) → RhBads ●+ +Ti/NBR Clay
H2O+Ti/NBR Clay (h+) → OH ● +H++Ti/NBR Clay
Then, species such as O2●– and OH● react with RhB species, and degradation occurs: RhBads●++(O2●– or OH●) → degradation → CO2+H2O.
Conclusions
Titania-pillared clays embedded with nickel and cobalt have been synthesized successfully. The synthesis of titania-pillared clay doped with nickel and cobalt from clay does not change the functional groups of the clay, such as Si–OH and Al–OH. XRD results show that TiO2 can become a pillar and cause the distance between layers to be larger. There was an increase in surface area and pore volume with TiO2 pillaring doped with Ni2+ and Co2+, while the pore size tended to be more constant. TGA results show that all samples are stable up to 650°C, except for Co-Ti/NBR Clay. The adsorption of NBR Clay and NBR Clay+EtOH showed a greater adsorption rate constant than Ti/NBR Clay, Ni-Ti/NBR Clay, and Co-Ti/NBR Clay. Nonetheless, the adsorption energy of Ti/NBR Clay, Ni-Ti/NBR Clay, and Co-Ti/NBR Clay is more prominent than that of NBR Clay and NBR Clay+EtOH. All samples followed the Langmuir isotherm model with a physisorption mechanism. TiO2 splinting in clay can increase photocatalytic degradation activity, while nickel and cobalt doping further increase photocatalytic degradation activity. With increasing RhB concentration, the photodegradation performance was slightly reduced. This research serves as a valuable reference for the development of clay composites with effective dye-removal capabilities. The study yields notable results, showcasing a high RhB removal activity driven primarily by adsorption. However, the excessive adsorption of clay hindered a thorough observation of the photodegradation activity of the composite. Future research endeavors could prioritize investigations into photodegradation activity, employing suitable experimental methods and standardization techniques to facilitate accurate observations. Moreover, there is potential to explore a co-doping mechanism with two metals, aiming to enhance the photodegradation activity of the composite.
Supplementary material
The supplementary material for this article can be found at http://doi.org/10.1017/cmn.2024.12.
Author contributions
Adi Darmawan: Conceptualization; Methodology; Validation; Formal Analysis; Resources; Writing-review & editing; Supervision; Funding acquisition. Setyo Sulaksono: Methodology; Investigation; Formal analysis. Muhamad Samsul Arifin: Methodology; Investigation; Formal analysis. Hasan Muhtar: Formal analysis; Investigation; Data curation; Writing-original draft; Visualization. Sriyanti Sriyanti: Validation; Writing-review & editing; Supervision.
Acknowledgments
Adi Darmawan is very grateful to FIM2lab at the University of Queensland, which facilitated all FTIR, TGA, and GSA analyses.
Financial support
Adi Darmawan gratefully acknowledges the financial support provided by Diponegoro University via Indonesian Collaborative Research (RKI) Based on Decree Number 1618/IT1.B07.1/TA.00/2022 and Agreement/Contract Number 434-01/UN7.D2/PP/VI/2022 dated 14 June 2022.
Competing interest
The authors declare that they have no competing interests.
Data availability statement
Data is available within the article, and no additional information is provided.


