


Introduction
A hallmark symptom of eating disorders (EDs) is restriction of food intake. Individuals with EDs may restrict their food intake for a variety of reasons. Some individuals restrict food intake primarily in an attempt to alter body shape or weight (i.e. ‘restraint’ motivation), whereas individuals with avoidant/restrictive food intake disorder (ARFID) restrict food intake primarily due to one or more of three prototypic motivations: sensory-based avoidance, lack of interest in food or low appetite, and/or fear of aversive consequences (American Psychiatric Association, 2022) The Diagnostic and Statistical Manual of Mental Disorders, Fifth Edition-Text Revision (DSM-5-TR) does not allow the diagnosis of ARFID to be made when body image disturbance is present (American Psychiatric Association, 2022). While individuals with non-ARFID EDs could theoretically also endorse ARFID motivations for restriction, ARFID motivations are not typically considered in the diagnosis of non-ARFID EDs.
While research supports the distinctiveness of ARFID from non-ARFID EDs (Pinhas et al., Reference Pinhas, Nicholls, Crosby, Morris, Lynn and Madden2017), clinical observations and research data demonstrate that ARFID and restraint motivations can co-occur. Pinhas et al. (Reference Pinhas, Nicholls, Crosby, Morris, Lynn and Madden2017) found that childhood restrictive EDs could be split into two classes using latent class analysis, one with body image distortion consistent with anorexia nervosa (AN) and one without, consistent with ARFID. However, case reports of individuals diagnosed with ARFID support the co-occurrence of body shape/weight concerns, including a 12-year-old with ARFID and binge eating (Becker, Breithaupt, Lawson, Eddy, & Thomas, Reference Becker, Breithaupt, Lawson, Eddy and Thomas2020) and a nine-year-old with low body weight who endorsed shape/weight concerns, but with restriction motivated by picky eating and lack of interest in food (Barney, Bruett, Forsberg, & Nagata, Reference Barney, Bruett, Forsberg and Nagata2022). Similarly, evidence suggests that individuals with non-ARFID EDs such as AN also may restrict food intake due to ARFID motivations, including: 1) prior work demonstrating that a subset of individuals with non-ARFID EDs (n = 126) in the present study scored high on measures of ARFID psychopathology (Burton-Murray et al., Reference Burton-Murray, Dreier, Zickgraf, Becker, Breithaupt, Eddy and Thomas2021) and 2) other work reporting symptoms in non-ARFID EDs such as early satiation (Santonicola et al., Reference Santonicola, Siniscalchi, Capone, Gallotta, Ciacci and Iovino2012) and fears around gastrointestinal pain (Zucker & Bulik, Reference Zucker and Bulik2020), overlapping with ARFID-lack of interest/low appetite and ARFID-fear of aversive consequences, respectively.
While there are some clinical case reports and theoretical support for the co-occurrence of ARFID and restraint motivations for restriction, the extent to which these motivations overlap is unknown. Further, to the best of our knowledge, no study has assessed which ARFID motivations most commonly co-occur with restraint motivations. To inform future efforts on classification of EDs, our primary aim was to empirically derive profiles of motivations for restriction using latent profile analysis (LPA), expecting to find multiple profiles of motivation for dietary restriction. Consistent with current DSM-5 schemes, we expected that profiles would significantly differ on all indicator variables (i.e. those used to derive profiles) with some profiles endorsing either primarily ARFID motivations (i.e. sensory-based avoidance, lack of interest/low appetite, fear of aversive consequences) or primarily restraint (i.e. attempts to restrict eating due to body shape/weight concerns) motivations. Further, given clinical observations and theory (Thomas et al., Reference Thomas, Lawson, Micali, Misra, Deckersbach and Eddy2017), we expected that profiles with primarily ARFID motivations would endorse multiple ARFID motivations. We expected that profiles with solely ARFID or restraint motivations would also differ on validator variables (i.e. variables not included in the model intended to further assess the external validity of these profiles). Finally, to further explore if the derived profiles align with current DSM-5 schemes, we reported the diagnostic characteristics of individuals in each profile and compared ARFID and non-ARFID ED clinical diagnoses on characteristics.
Method
Participants
The sample included 212 consecutively-referred patients from 2018 to 2022. Patients with a primary diagnosis of rumination disorder (n = 6) or who were determined to not have an ED after evaluation (n = 1) were excluded, and three patients did not fill out the assessment battery. Thus, the present study includes 202 individuals (ages 10–79 [Mage = 25.9, s.d.age = 14.3], 76% female, 94% white, and 7% Hispanic) seeking treatment in a hospital-based outpatient eating disorder clinic from 2018 to 2022. All included participants had a primary diagnosis of ARFID (n = 80, 40%), AN (n = 48, 24%), bulimia nervosa (BN; n = 15, 7%), binge-eating disorder (BED; n = 19, 9%), or other specified feeding or eating disorder (OSFED; n = 40, 20%). The present study did not include a measure of socioeconomic status. However, we were able to estimate annual income based on US Census-reported median income data for each participant's zip code of residence (Charpignon et al., Reference Charpignon, Vakulenko-Lagun, Zheng, Magdamo, Su, Evans and Sheu2022).
Procedure
Questionnaires were sent to participants via email prior to their initial clinic intake appointment and completed via REDCap (Harris et al., Reference Harris, Taylor, Minor, Elliott, Fernandez, O'Neal and Kirby2019), and participants under age 18 had the option to complete questionnaires with parental assistance. DSM-5 diagnoses were assigned via clinical interview by assessors who were either licensed clinicians themselves (clinical psychologists or psychiatrists) or were supervised by a licensed clinician (e.g. post-doctoral fellows, psychiatry residents, clinical psychology doctoral students). Clinicians diagnosed ARFID and non-ARFID EDs using a template created using DSM-5 criteria (Becker et al., Reference Becker, Keshishian, Liebman, Coniglio, Wang, Franko and Thomas2019). The primary set of interview questions was the same for all participants, and covered typical daily food intake, dietary rules, body image disturbance, weight history, binge eating, compensatory behaviors, and treatment history. Participants were always weighed during their appointment. Once diagnostic criteria for a specific ED were endorsed, clinicians asked additional follow-up questions. For ARFID, additional follow-up questions included: the number of foods eaten regularly from each of the five major food groups (fruits, vegetables, proteins, grains, and dairy); self-reported sensitivity to the appearance, taste, texture, and smell of foods; appetite and enjoyment of food; experience of food-related trauma; presence/absence of nutritional deficiencies; reliance on nutritional supplements; and psychosocial impairment including, but not limited to, avoidance of social events/holidays for fear of being around new foods, frequency of skipped or forgotten meals, and arguments around meal times or accommodations to food/eating preferences and fears. When possible, self-reported nutritional deficiencies and growth trajectories were checked against recent medical records to ensure diagnostic accuracy.
All participants provided informed consent (if age 18 or older) or assent plus parental consent (if under age 18). This study was approved by the Massachusetts General Hospital Human Research Committee.
Measures
Demographics
Participants self-reported age, sex, race, and ethnicity.
Indicator variables
Nine-item ARFID Screen (NIAS). The NIAS (Zickgraf & Ellis, Reference Zickgraf and Ellis2018) comprises nine items assessing ARFID symptoms on a response scale of 0–5 with higher scores indicating greater ARFID symptoms. The NIAS includes three subscales (Picky, Appetite, Fear) which are intended to align with the three ARFID prototypes. Example items include: ‘I am a picky eater’ (Picky subscale); ‘Even when I am eating a food I really like, it is hard for me to eat a large enough volume at meals’ (Appetite subscale); and ‘I avoid or put off eating because I am afraid of discomfort, choking, or vomiting’ (Fear subscale). Internal consistency in our sample was high for all subscales (α = 0.87–0.89).
Eating Disorders Examination-Questionnaire (EDE-Q) Restraint Subscale. The EDE-Q (Fairburn & Beglin, Reference Fairburn and Beglin1994) Restraint subscale (e.g. ‘Have you tried to exclude from your diet any foods that you like in order to influence your shape or weight [whether or not you have succeeded]?’) measures attempts at dietary restriction due to concerns about body shape or weight. Scores range from 0 to 6. Internal consistency in our sample was excellent for the Restraint subscale (α = 0.91).
Validator variables
EDE-Q Global Score and other Subscales. The EDE-Q (Fairburn & Beglin, Reference Fairburn and Beglin1994) comprises 28 items assessing shape/weight-motivated ED symptoms, with many items rated on a 0–6 Likert scale and higher scores indicating greater ED symptoms. The EDE-Q provides Restraint (described above), Eating Concern, Shape Concern, and Weight Concern subscales, and a Global score (range for each: 0–6). Internal consistency in our sample was at least adequate for all subscales (α = 0.79–0.95).
Eating Pathology Symptoms Inventory (EPSI). The EPSI (Forbush et al., Reference Forbush, Wildes, Pollack, Dunbar, Luo, Patterson and Watson2013) comprises 45 items assessing non-ARFID ED symptoms on a 0–4 point Likert scale. The EPSI provides Body Dissatisfaction (possible score range: 0–28), Binge Eating (possible score range: 0–32), Cognitive Restraint (possible score range: 0–12), Purging (possible score range: 0–24), Restricting (possible score range: 0–24), Excessive Exercise (possible score range: 0–20), Negative Attitudes toward Obesity (possible score range: 0–20), and Muscle Building (possible score range: 0–20) subscales. Internal consistency in our sample was acceptable for all subscales (α = 0.80–0.93) except for the muscle building subscale (α = 0.65), which was not used in the present analyses.
Food Neophobia Scale (FNS). The FNS (Pliner & Hobden, Reference Pliner and Hobden1992) comprises 10 items assessing tendency to avoid novel foods. An example item is ‘I don't trust new foods.’ Items are rated on a 1–7 point Likert scale and summed together for a total score (range: 10–70), with higher scores indicating greater food neophobia. Internal consistency in our sample was excellent (α = 0.95).
Clinical Diagnosis and Cutoffs. Clinical ED diagnosis from the evaluation (described in Procedure) and clinical cutoffs on the EDE-Q Global scale (⩾2.3; Mond, Hay, Rodgers, Owen, and Beumont, Reference Mond, Hay, Rodgers, Owen and Beumont2004) and each NIAS subscale (NIAS-Picky ⩾ 10; NIAS-Appetite ⩾ 9; NIAS-Fear ⩾ 10; Burton-Murray et al., Reference Burton-Murray, Dreier, Zickgraf, Becker, Breithaupt, Eddy and Thomas2021) were used as additional validators.
Statistical analysis
We conducted LPA in R version 4.1.1 using mclust (Scrucca, Fop, Murphy, & Raftery, Reference Scrucca, Fop, Murphy and Raftery2016) and tidyLPA (Rosenberg, Beymer, Anderson, Van Lissa, & Schmidt, Reference Rosenberg, Beymer, Anderson, Van Lissa and Schmidt2019). All other analyses were conducted in SPSS version 28.0 (IBM Corp, Armonk, NY). We used the three NIAS subscales and the Restraint subscale of the EDE-Q as indicators (i.e. variables used to derive profiles) for the LPA (Primary Aim). Variance was set to equal and covariances were fixed at zero. Consistent with prior work using LPA, we compared 1–10 profile solutions (Christian et al., Reference Christian, Bridges-Curry, Hunt, Ortiz, Drake and Levinson2021; Haynos et al., Reference Haynos, Wang, LeMay-Russell, Lavender, Pearson, Mathis and Crow2021). We selected the best-fit solution using the Bayesian Information Criterion (BIC) (Schwarz, Reference Schwarz1978), Akaike Information Criterion (AIC) (Akaike, Reference Akaike1973), and Consistent Akaike Information Criterion (cAIC) (Bozdogan, Reference Bozdogan1987). Additionally, we compared solutions on entropy, probabilities of assignment to a given class, and p values for the bootstrapped likelihood ratio test. Prior work suggests 200 participants is an adequate sample when using ⩽8 indicator variables in LPA (Nylund, Asparouhov, & Muthén, Reference Nylund, Asparouhov and Muthén2007), and other work using LPA has been published with similar sample sizes (Bazelmans et al., Reference Bazelmans, Jones, Ghods, Corrigan, Toth, Charman and Webb2023; Crum et al., Reference Crum, Aloi, Blair, Bashford-Largo, Bajaj, Zhang and Filbey2023; Lambek et al., Reference Lambek, Sonuga-Barke, Tannock, Sørensen, Damm and Thomsen2018; van Hulst, De Zeeuw, & Durston, Reference van Hulst, De Zeeuw and Durston2015). Resulting profiles from the best-fit solution were compared on indicator variables to evaluate construct validity of the profiles. Additionally, we compared resulting profiles on demographic variables (such as age and sex) and on validator variables (the remaining subscales and Global scale of the EDE-Q, EPSI subscales, and FNS scores). We selected variables for validation analyses based on their ability to theoretically measure ARFID and non-ARFID ED symptoms; if the profiles are valid, we would expect profiles with higher NIAS scores to score high on other measures of ARFID symptoms (e.g. FNS) and profiles with higher EDE-Q Restraint scores to score high on other measures of non-ARFID ED symptoms (e.g. non-Restraint EDE-Q subscales, EPSI subscales).
To explore whether findings were consistent with DSM-5 diagnostic schemes, we calculated the percentage of participants in a given profile by clinician-assigned diagnoses, as well as by cutoffs for each ARFID presentation (NIAS-Picky ⩾ 10; NIAS-Appetite ⩾ 9; NIAS-Fear ⩾ 10) and for non-ARFID ED symptoms (EDE-Q Global ⩾ 2.3; Mond et al., Reference Mond, Hay, Rodgers, Owen and Beumont2004). For each of the comparisons by profile (indicator variables, validator variables, diagnostic cutoffs), we conducted mirrored comparisons by clinician diagnostic categories (ARFID, AN, BN, BED, OSFED). We descriptively compared the analyses by profile to the analyses by clinical diagnosis.
All participants had complete data for all measures, as questions were marked as ‘required’ in REDCap, and no participants only partially completed measures.
Results
Latent profile analysis and comparisons on indicators
A 5-profile solution was the best fit to data (see Table 1). As expected, profiles differed significantly on all indicator variables (Fig. 1). Twenty-four (12%) participants were members of Latent Profile 1 (LP1; termed ‘Restraint/ARFID-Mixed’ based on mean scores on indicator variables suggesting both ARFID and restraint motivations), 56 (28%) were members of LP2 (termed ‘ARFID-2’, based on endorsement of two ARFID motivations, sensory-based avoidance and low appetite), 40 (20%) were members of LP3 (termed ‘ARFID-3’, based on endorsement of all three ARFID motivations), 45 (22%) were members of LP4 (termed ‘Restraint’), and 37 (18%) were members of LP5 (termed ‘Non-Endorsers’ due to low mean scores on all indicators). LPs differed significantly on sex [χ2(8) = 25.7, p < 0.001; see Table 2] and age [F (4, 193) = 7.21, p < 0.001]. Specifically, the ARFID-2 profile was significantly younger than the Restraint and Non-Endorsers profiles and comprised significantly more males than the ARFID-3 and Non-Endorsers profiles.
Table 1. Fit indices for latent profile analysis in a sample of 202 treatment-seeking individuals with eating disorders

Note: BIC, Bayesian Information Criterion; AIC, Akaike Information Criterion; cAIC, Consistent Akaike Information Criterion; BLRT, Bootstrapped Likelihood Ratio Test.
Best fit model bolded. In the 5-profile model, 85.14% of participants were assigned to a profile with probability ⩾0.80.

Figure 1. Z Score distributions of indicator variables by profile in a sample of 202 treatment-seeking individuals with eating disorders.
Note: Error bars reflect standard error within each profile. Z scores were used in the above figure given that scores on each NIAS subscale can range from 0 to 15, while scores on the EDE-Q Restraint subscale can range from 0 to 6. NIAS, Nine-item ARFID Screen, EDE-Q, Eating Disorders Examination Questionnaire.
Table 2. Characteristics by profile in a sample of 202 treatment-seeking individuals with eating disorders
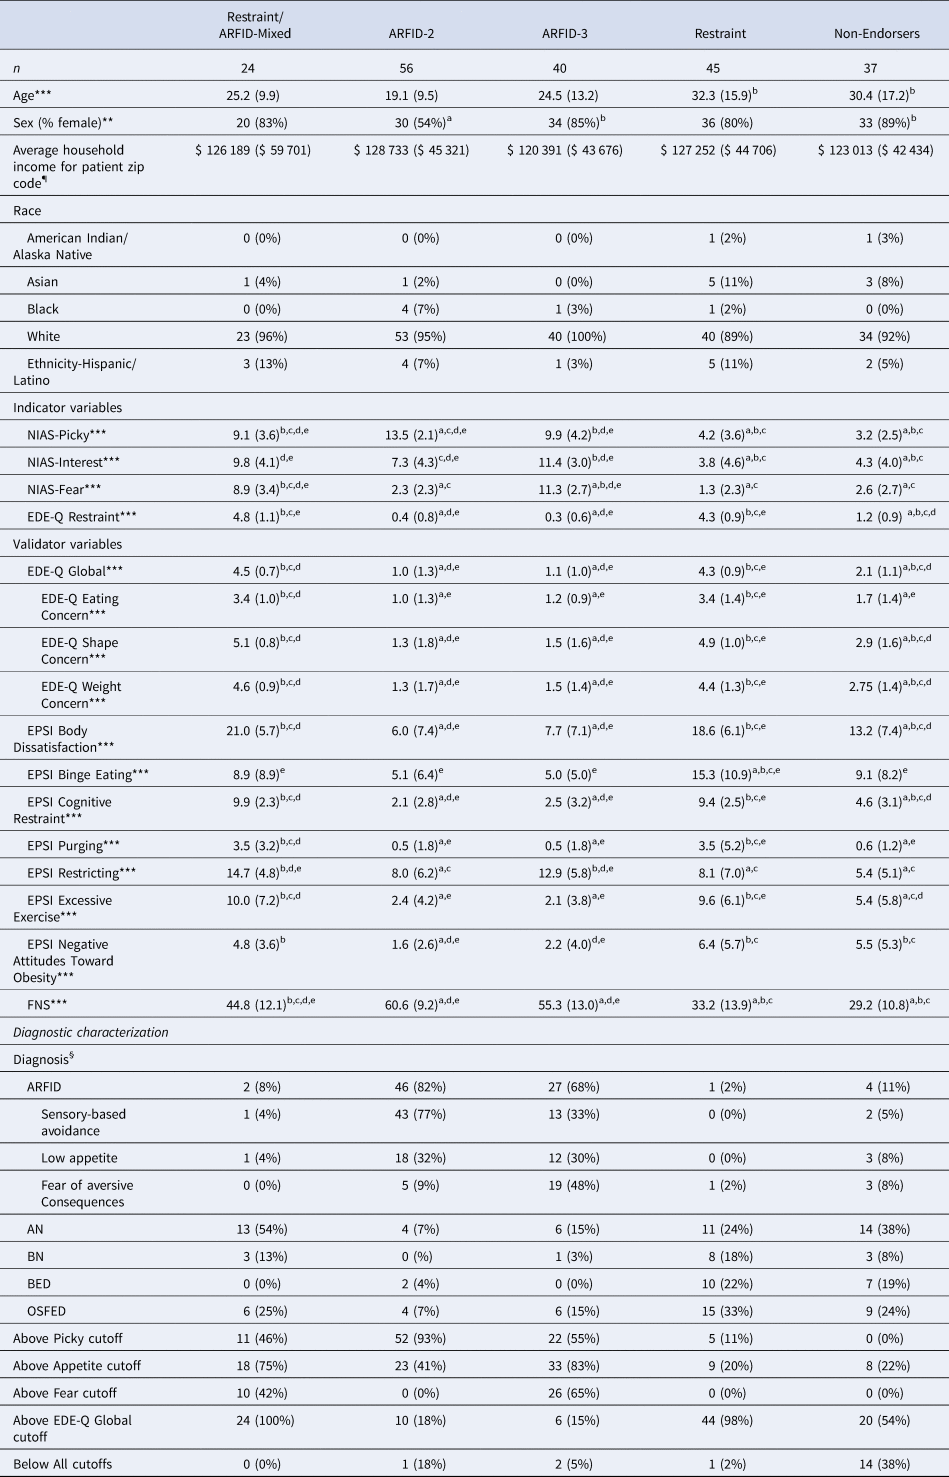
NIAS, Nine-Item ARFID Screen; EDE-Q, Eating Disorders Examination-Questionnaire; EPSI, Eating Pathology Symptoms Inventory; CIA, Clinical Impairment Assessment; FNS, Food Neophobia Scale. a, significantly different from Restraint/ARFID-Mixed; b, significantly different from ARFID-2; c, significantly different from ARFID-3; d, significantly different from Restraint; e, significantly different from Non-Endorsers. ¶Income is reported as mean and standard deviation of the median annual income for the zip code listed for each participant's zip code of residence (Charpignon et al., Reference Charpignon, Vakulenko-Lagun, Zheng, Magdamo, Su, Evans and Sheu2022). §Percentages for diagnoses refer to the percent of individuals in the profile with that diagnosis (i.e. percentages sum to 100 within the profile column). ARFID, Avoidant/restrictive food intake disorder; AN, Anorexia nervosa; BN, Bulimia nervosa; BED, Binge-eating disorder; OSFED, Other specified feeding or eating disorder. *p < 0.05, **p < 0.01, ***p < 0.001.
Note: Profile names represent high scores on the measures used as indicators: NIAS subscales (Picky, Appetite, Fear, which map onto the three ARFID prototypes) and/or the EDE-Q Restraint subscale (which measures restriction intended to impact body shape/weight). The Non-Endorsers profile had low scores across all of the indicators. Scores on measures reported as M(s.d.), sex, above cutoffs, and diagnosis reported as n(%).
When we compared differences by profile on indicators (Table 2) to differences by clinical diagnosis (Table 3), individuals with a clinical diagnosis of ARFID scored higher on the NIAS-Picky and lower on the EDE-Q Restraint subscale than all other diagnostic groups. AN and ARFID had higher NIAS-Interest scores than all other diagnostic groups but did not differ from one another. ARFID and AN had significantly higher NIAS-Fear scores than BED but did not differ from each other or from BN or OSFED.
Table 3. Characteristics by clinical diagnosis in a sample of 202 treatment-seeking individuals with eating disorders

NIAS, Nine-item ARFID Screen; EDE-Q, Eating Disorders Examination-Questionnaire; EPSI, Eating Pathology Symptoms Inventory; CIA, Clinical Impairment Assessment; FNS, Food Neophobia Scale. a, significantly different from ARFID; b, significantly different from AN; c, significantly different from BN; d, significantly different from BED; e, significantly different from OSFED. ¶Income is reported as mean and standard deviation of the median annual income for the zip code listed for each participant's zip code of residence (Charpignon et al., Reference Charpignon, Vakulenko-Lagun, Zheng, Magdamo, Su, Evans and Sheu2022). §Percentages refer to the percent of individuals in the full sample with that diagnosis for each profile (i.e. percentages sum to 100 within the diagnosis column). ARFID, Avoidant/restrictive food intake disorder; AN, Anorexia nervosa; BN, Bulimia nervosa; BED, Binge-eating disorder; OSFED, Other specified feeding or eating disorder. *p < 0.05, **p < 0.01, ***p < 0.001.
Note: Profile names represent high scores on the measures used as indicators: NIAS subscales (Picky, Appetite, Fear, which aim to map onto the three ARFID prototypes) and/or the EDE-Q Restraint subscale (which measures restriction intended to impact body shape/weight). The Non-Endorsers profile had low scores across all of the indicators. Scores on measures reported as M(s.d.), sex, above cutoffs, and diagnosis reported as n(%).
Validation analyses
For the validation analysis, profiles differed significantly on the FNS, EDE-Q Global, all EDE-Q subscales, and all EPSI subscales (Table 2). As expected, the Restraint/ARFID-Mixed profile had significantly higher FNS scores than the Restraint profile, but significantly lower scores than the ARFID-2 and ARFID-3 profiles. Further, profiles with restraint motivations had significantly higher scores on most measures assessing non-ARFID ED psychopathology (including the EDE-Q Shape Concern, EDE-Q Weight Concern, EPSI Binge Eating, EPSI Body Dissatisfaction, EPSI Cognitive Restraint, EPSI Excessive Exercise, and EPSI Negative Attitudes Toward Obesity) than profiles without restraint motivation. The Restraint/ARFID-Mixed and Restraint profiles also had significantly higher EPSI purging scores than the ARFID-2 and the ARFID-3 profiles. Finally, the profiles that endorsed the greatest number of motivations for restrictive eating (i.e. the Restraint/ARFID-Mixed and ARFID-3 profiles) endorsed significantly higher EPSI restricting scores than all other profiles.
When we compared differences by profile on validator variables (Table 2) to differences by clinical diagnosis (Table 3), individuals with ARFID clinical diagnoses had significantly lower scores on the EDE-Q Global and all subscales and EPSI-Body Dissatisfaction, Cognitive Restraint, Excessive Exercise, and Negative Attitudes Toward Obesity than all other diagnostic groups. Individuals with ARFID also had significantly higher FNS scores than all other diagnostic groups.
Diagnostic characterization
We further explored characteristics of each profile by descriptively reporting the frequencies of clinician-assigned diagnoses and frequencies of meeting positive screening cutoffs on self-report surveys for ARFID and non-ARFID EDs. As expected, the majority (92–98%) of those belonging to profiles with restraint motivations (Restraint/ARFID-Mixed; Restraint) had non-ARFID ED diagnoses. Also as expected, the majority (68–82%) of patients belonging to profiles without restraint motivations (ARFID-2, ARFID-3) had ARFID diagnoses. Notably, the majority of the Non-Endorsers profile (89%) had non-ARFID ED diagnoses (38% AN, 8% BN, 19% BED, 24% OSFED [63% atypical AN, 5% subthreshold BN, 25% subthreshold BED, 5% OSFED-Purging Disorder, 22% OSFED-Other]), while only 11% had ARFID.
Among patients in the Restraint/ARFID-Mixed profile, 100% met the cutoff for the EDE-Q Global, 75% for NIAS-Appetite, 46% for NIAS-Picky, and 42% for NIAS-Fear (Table 2). In the ARFID-2 profile, a large minority also met the cutoff for NIAS-Appetite (41%). Notably, in the Non-Endorsers profile, fourteen participants (38%) scored below the cutoffs on all NIAS variables and the EDE-Q Global.
When we compared differences by profile on diagnostic characterizations and cutoffs (Table 2) to differences by clinical diagnosis (Table 3), we found that a substantial minority of individuals with clinical AN diagnoses (25%) and clinical OSFED diagnoses (25%) did not meet the EDE-Q Global cutoff suggestive of clinically significant non-ARFID ED pathology. The majority of those with ARFID diagnoses belonged to one of the two ARFID profiles (92%), although 3% belonged to the Restraint/ARFID-Mixed profile, 1% to Restraint, and 5% to Non-Endorsers. Of those with non-ARFID ED diagnoses, 36% belonged to the Restraint profile, 18% to one of the Restraint/ARFID-Mixed profile, 19% to one of the two profiles endorsing only ARFID motivation for restriction, and 27% to Non-Endorsers.
Discussion
The present study investigated latent profiles of motivations for dietary restriction in a clinical sample of treatment-seeking patients clinically diagnosed with an eating disorder, including ARFID. A 5-profile solution was the best fit to the data, with two profiles reporting restriction driven primarily by ARFID motivations, one reporting restriction driven primarily by restraint motivations, one with mixed ARFID and restraint motivations, and one that endorsed neither ARFID nor restraint motivations. Specifically, ARFID-2, ARFID-3, and Restraint profiles reported either ARFID or restraint motivations, consistent with DSM-5. However, the Restraint/ARFID-Mixed profile and Non-Endorsers profile, both comprising primarily individuals diagnosed with non-ARFID EDs, contrasted with current DSM-5 schemes. In the Non-Endorsers profile, a large minority (38%) of individuals did not meet cutoffs for any ARFID prototype based on NIAS subscales or for clinically-significant non-ARFID ED symptoms (by EDE-Q Global cutoff). Findings suggest that a significant subset of individuals with non-ARFID EDs may present with both ARFID and restraint motivations (18%) or with salient ARFID motivations (19%) for restriction.
Notably, no profiles emerged that endorsed only one ARFID motivation, supporting overlap of ARFID presentations. While clinical case reports and case series have suggested that ARFID presentations are not mutually exclusive (Barney et al., Reference Barney, Bruett, Forsberg and Nagata2022; Thomas et al., Reference Thomas, Becker, Breithaupt, Burton-Murray, Jo, Kuhnle and Hauser2021a, Reference Thomas, Becker, Kuhnle, Jo, Harshman, Wons and Liebman2021c), empirical work has often considered presentations separately (e.g. Norris et al., Reference Norris, Spettigue, Hammond, Katzman, Zucker, Yelle and Obeid2018) and the extent to which these presentations overlap has not been empirically tested and is worthy of future study. ARFID-2 and ARFID-3 profiles appear to capture different ARFID symptom profiles, with ARFID-3 including higher levels of fear symptoms. This aligns with clinical diagnoses in this profile, where 48% of individuals with ARFID in the ARFID-3 profile were diagnosed with ARFID-fear of aversive consequences, in contrast to 9% in the ARFID-2 profile. Some research has suggested that the fear of aversive consequences presentation of ARFID may differ from the other two presentations in several ways, including a greater likelihood of acute weight loss (Norris et al., Reference Norris, Spettigue, Hammond, Katzman, Zucker, Yelle and Obeid2018; Zickgraf, Lane-Loney, Essayli, & Ornstein, Reference Zickgraf, Lane-Loney, Essayli and Ornstein2019) and higher levels of anxiety (Zickgraf et al., Reference Zickgraf, Lane-Loney, Essayli and Ornstein2019). Further, individuals with clinical ARFID diagnoses in our sample scored significantly lower on the EDE-Q Global, EDE-Q subscales, and EPSI-Body Dissatisfaction than individuals with clinical non-ARFID-ED diagnoses, supporting distinctions between ARFID and some individuals with non-ARFID EDs.
Although the majority of individuals were categorized into profiles that neatly aligned with DSM-5 categories (nearly 70% of participants fell into the ARFID-2, ARFID-3, or Restraint profile). While the DSM-5 does not allow for ARFID to be diagnosed concurrently with AN or BN, the emergence of the Restraint/ARFID-Mixed profile is notable and supports prior work suggesting that ARFID and restraint motivations can co-occur (Barney et al., Reference Barney, Bruett, Forsberg and Nagata2022; Becker et al., Reference Becker, Breithaupt, Lawson, Eddy and Thomas2020; Burton-Murray et al., Reference Burton-Murray, Dreier, Zickgraf, Becker, Breithaupt, Eddy and Thomas2021; Santonicola et al., Reference Santonicola, Siniscalchi, Capone, Gallotta, Ciacci and Iovino2012; Zucker & Bulik, Reference Zucker and Bulik2020). This profile was differentiated from the Restraint profile based on endorsement of ARFID motivations for restriction, higher food neophobia scores, higher EPSI Restricting scores, and lower EPSI Binge Eating scores. The co-occurrence of restraint and lack of interest/low appetite motivations may be most common – in our sample, 75% of individuals in the Restraint/ARFID-Mixed profile met the NIAS-Appetite clinical screening cutoff. The high prevalence of the appetite presentation in this profile may be reflective of NIAS cutoffs still being empirically validated. Results regarding cutpoints for the Appetite subscale in particular have been mixed (Billman Miller, Zickgraf, Murray, Essayli, & Lane-Loney, Reference Billman Miller, Zickgraf, Murray, Essayli and Lane-Loney2024). However, individuals in the Restraint/ARFID-Mixed profile also had a high frequency of meeting the clinical screening cutoff for NIAS-Picky (46%) and NIAS-Fear (42%) and higher average scores on both subscales compared to individuals in the Restraint profile. A higher frequency of meeting NIAS-Picky and NIAS-Fear cutoffs and higher mean scores on food neophobia was also seen in individuals with clinical ARFID diagnoses v. clinical non-ARFID ED diagnoses, supporting the similarities between the Restraint/ARFID-mixed profile and individuals with clinical ARFID diagnoses.
It is possible that the Restraint/ARFID-Mixed profile represents individuals with more severe ‘traditional’ non-ARFID EDs relative to individuals in the Restraint profile (who did not score high on the NIAS). The NIAS-Appetite subscale and NIAS-Picky subscale may be high in these individuals because some of the items may reflect symptoms that are a result of chronic restriction – for example, reduced dietary variety reflected in higher scores on the item ‘the list of foods that I will eat is shorter than the list of foods I won't eat’ may be because of dietary rules to control weight/shape (rather than sensory-based food avoidance). However, high food neophobia (i.e. fear of trying new foods, which has been shown to be elevated in ARFID relative to AN in prior work (Becker et al., Reference Becker, Keshishian, Liebman, Coniglio, Wang, Franko and Thomas2019) and high NIAS-Fear scores (which could be in part due to having physical comorbidities that interact with restrictive eating, such as gastrointestinal symptoms) in the Restraint/ARFID-Mixed profile support that true ARFID characteristics are present in this profile, rather than elevated NIAS scores relative to the Restraint profile simply reflecting higher non-ARFID ED severity. Overall, the Non-Endorsers profile suggests comorbidity between ARFID and non-ARFID EDs, despite DSM-5-TR's assumption that these diagnoses are mutually exclusive.
The ARFID-2, ARFID-3, and Restraint profiles each seem to capture individuals with EDs that fit neatly into current DSM-5 diagnostic schemes where ARFID and restraint motivations are separate from one another. Consistent with expectations, 98% of individuals in the Restraint profile were diagnosed with non-ARFID EDs. However, 18% of individuals in the ARFID-2 profile and 33% of individuals in the ARFID-3 profile were diagnosed with non-ARFID EDs, suggesting that even these profiles did not entirely align with current DSM-5 schemes. Validation analyses finding higher food neophobia and restriction – but not cognitive restraint – scores in ARFID-2 and ARFID-3 further supports that the ARFID-2 and ARFID-3 profiles were aligned with more predominant ARFID motivations based on prior work highlighting higher food neophobia and lower restraint in ARFID relative to AN, but equivalent restriction in the two groups (Becker et al., Reference Becker, Keshishian, Liebman, Coniglio, Wang, Franko and Thomas2019).
Within the Non-Endorsers profile, 38% of participants scored below the cutoff for all motivations for restriction, suggesting that these individuals: (1) do not have high levels of any dietary restriction symptoms; (2) might represent a presentation in line with non-fatphobic AN; (3) have symptoms that are not fully captured by EDE-Q questions (Burton-Murray et al., Reference Burton-Murray, Coniglio, Hartmann, Becker, Eddy and Thomas2017), perhaps due to current low body weight mitigating concerns about shape/weight generally; (4) low insight or ambivalence about treatment and/or (5) have alternative motivations for restriction not measured in the current study. The diagnostic composition of this profile could also suggest lower restriction symptoms overall relative to the rest of the sample, given that 19% of participants in this profile had a BED diagnosis (which may be less associated with restriction than other EDs; Elran-Barak et al., Reference Elran-Barak, Sztainer, Goldschmidt, Crow, Peterson, Hill and Le Grange2015). Notably, though, many individuals in the Non-Endorsers profile had an AN (38%) or atypical AN (16%) diagnosis, which could suggest that this profile, in part, captures non-fatphobic AN. It is still unclear whether individuals with non-fatphobic AN might have motivations for restriction that align more strongly with ARFID rather than AN, are minimizing or denying cognitive symptoms of AN, or have entirely different motivations for restriction (e.g. desire for control) (Thomas, Hartmann, & Killgore, Reference Thomas, Hartmann and Killgore2013).
Interestingly, the Non-Endorsers profile did report some level of body dissatisfaction and cognitive restraint on the EPSI and EDE-Q, although significantly less than the Restraint/ARFID-Mixed and Restraint profiles, and their EPSI-Restricting scores were significantly lower than the Restraint/ARFID-Mixed and ARFID-3 profiles. Overall, their scores on eating pathology fell somewhere between those of the ARFID-2 and ARFID-3 profiles and the Restraint profile. Further, when comparing clinical diagnostic groups, a substantial minority of individuals with AN and OSFED did not score above the EDE-Q Global cutoff, suggesting some non-fatphobic eating pathology in our sample. While non-fatphobic AN represents a heterogeneous group and work in this area is limited, prior work has found differences between non-fatphobic AN and ARFID on implicit bias toward dieting (Izquierdo et al., Reference Izquierdo, Plessow, Becker, Mancuso, Slattery, Burton-Murray and Eddy2019). Taken together, these findings suggest that not all individuals with non-fatphobic AN are better classified under ARFID. Further research should probe differences in symptoms and illness course between ARFID, non-fatphobic AN, and AN. Alternatively, restriction could be motivated by other reasons not measured in the current study such as by a desire for control in general (Fairburn, Reference Fairburn2008).
Our findings should be interpreted in the context of strengths and limitations. Our study is strengthened by its transdiagnostic clinical sample and assignment of diagnoses based on clinical interview. Further, profiles were derived empirically and using continuous rather than binary (as in latent class analysis) variables. However, some limitations should be noted. First, while the EDE-Q is well-validated and commonly used, the Restraint subscale primarily measures attempts at restriction due to body image disturbance, rather than actual restriction. Additionally, our sample primarily comprised individuals who were female, identified as White and non-Hispanic, and with high socioeconomic status. Further research should be conducted in more diverse samples. Inter-rater reliability for clinical diagnoses in the sample is unfortunately not available. Although prior work referenced above (Nylund et al., Reference Nylund, Asparouhov and Muthén2007) supports the use of LPA in sample sizes similar to ours, we acknowledge our modest sample size. Finally, because validation variables were cross-sectional, the predictive utility of these profiles is unknown.
The present study supports overall distinctions between ARFID and non-ARFID EDs, but also suggests that ARFID and restraint motivations for restriction may overlap in some individuals. The boundary between ARFID and non-ARFID EDs is unclear, and individuals may present with multiple motivations for restriction. Given that ARFID cannot currently be diagnosed in the presence of body image disturbance, future research should clarify diagnostic boundaries between ARFID and non-ARFID EDs, particularly restrictive EDs like AN, as this may have important implications for treatment. Future research should also consider whether DSM-5 should allow for a diagnosis of ARFID concurrent with AN and/or BN. It is possible that incorporating relevant treatment modules may be beneficial for individuals with overlapping motivations. For example, ARFID treatment modules (Thomas & Eddy, Reference Thomas and Eddy2019) could be incorporated into non-ARFID ED treatment. Similarly, select Enhanced Cognitive Behavioral Therapy (CBT-E; Fairburn, Reference Fairburn2008) or Brief Cognitive Behavioral Therapy for Non-Underweight Patients (CBT-T; Waller, Turner, Tatham, Mountford, and Wade, Reference Waller, Turner, Tatham, Mountford and Wade2019) modules could be incorporated into ARFID treatment (Thomas, Becker, & Eddy, Reference Thomas, Becker and Eddy2021b). Further, all ARFID profiles that emerged in the present study endorsed more than one ARFID motivation, adding empirical support to clinical observations suggesting that presentation overlap is common. Additionally, findings may support distinctions between non-fatphobic AN and ARFID based on the emergence of the Non-Endorsers profile that did not endorse either ARFID or restraint motivations for restriction, as well as more established distinctions between ‘traditional’ AN and ARFID based on the emergence of distinct ARFID-motivated and distinct restraint-motivated profiles. It may also be informative to test the utility of choosing an ARFID or non-ARFID ED diagnosis based on the strongest motivator for restriction in an individual, rather than on the basis of whether shape or weight concerns are present.
Funding statement
This work was supported by the National Institute of Diabetes and Digestive and Kidney Diseases (K23 DK131334 [HBM]) and the National Institute of Mental Health (R01 MH128246 [JJT], R01 MH116205 [KTE], K24 MH135189 [JJT], K23 MH125143 [KRB]).
Competing interests
SRA, TEJ, PEK, LP, LB, and CMS have no personal or financial conflicts to declare. HBM and JJT receive royalties from Oxford University Press for their forthcoming book on rumination syndrome. JJT, KRB, and KTE receive royalties from Cambridge University Press for the sale of their books, Cognitive-Behavioral Therapy for Avoidant/Restrictive Food Intake Disorder: Children, Adolescents, and Adults (JJT & KTE) and The Picky Eater's Recovery Book (JJT, KRB, KTE).
Ethical standards
The authors assert that all procedures contributing to this work comply with the ethical standards of the relevant national and institutional committees on human experimentation and with the Helsinki Declaration of 1975, as revised in 2008.


