


Introduction
Cashew (Anacardium occidentale L.) is an evergreen tree cultivated for its delicious kernels and apples. Inclusion of economically important traits becomes indispensable in cashew-breeding programmes. Moreover, agro-economic traits are significant for genetic diversity analysis and a prerequisite for the crop improvement. The main focus of cashew breeders is to discover and learn ways to eventually elevate and expand cashew nut yield. For instance, Indian Council of Agricultural Research (ICAR)-Directorate of Cashew Research, Puttur, released the cashew hybrid H-130 with precocious flowering behaviour, higher yields having bold nuts and Nethra Jumbo-1 with premium-sized kernels, early bearing.
Utilizing crop diversity is one method for enhancing agricultural output and is essential for achieving global food security. Highly significant research work from different corners of the world also revealed the importance of agro-morpho characterization of this crop for generating better availability of cashew cultivars in Malawi (Chipojola et al., Reference Chipojola, Mwase, Kwapata, Bokosi, Njoloma and Maliro2009), Benin (Chabi et al., Reference Chabi, Adoukonou-Sagbadja, Ahoton, Adebo, Adigoun, Saidou and Baba-Moussa2015) and India (Samal et al., Reference Samal, Rout and Lenka2003; Jena et al., Reference Jena, Samal, Pal, Das and Chand2016). Even though cashew cultivars are affected and influenced by environmental factors, the selection of elite cashew trees is mostly done by analysis of morphological characteristics (Adoukonou-Sagbadja et al., Reference Adoukonou-Sagbadja, Wagner, Dansi, Ahlemeyer, Daïnou, Akpagana and Friedt2007; Chipojola et al., Reference Chipojola, Mwase, Kwapata, Bokosi, Njoloma and Maliro2009; Ahoton et al., Reference Ahoton, Quenum and Mergeai2011). Morphological traits like kernel weight, kernel size, cashew apple colour and tree canopy are identified as the most useful agronomic and phenotypic traits (Van-Beuningen and Busch, Reference Van-Beuningen and Busch1997; Mneney et al., Reference Mneney, Mantell and Bennett2001).
Future increases in crop yield potential and quality requirements are desired, necessitating the exploitation of the existing genetic variability of cashew germplasm. Despite efforts made since 1950 to improve cashew for nut yield and quality through breeding, cashew production is unfortunately constrained by variable nut yields, poor nut quality and susceptibility to diseases, particularly powdery mildew and Helopeltis, respectively (Rao et al., Reference Rao, Swamy and Bhat1998).
Both classification and knowledge of genetic diversity play a significant role in the conservation of plant genetic resources for heterotic crosses by selecting efficient genotypes (Adoukonou-Sagbadja et al., Reference Adoukonou-Sagbadja, Wagner, Dansi, Ahlemeyer, Daïnou, Akpagana and Friedt2007). Djolossè et al. (2019) suggested the significance of phenotypic variability for cashew breeding using qualitative and quantitative traits. The use of qualitative and quantitative descriptors is one of the several approaches to achieving the agricultural productivity of tree crops, along with minimizing the large number of resources and labour required in tree-breeding programmes where extensive time is required for germplasm conservation.
Grouping of cashew germplasm by specific molecular markers based on gene-based markers and DNA sequence has proven to be efficient and accurate when compared to morphometric techniques and other dominant markers (Wahyudi and Rifliyah, Reference Wahyudi and Rifliyah2020; Probojati et al., Reference Probojati, Listyorini, Sulisetijono and Wahyudi2021). In cashew, maturase K (matK) is a chloroplast protein-coding gene of about 1547 bp. In several investigations, matK sequences have been used for barcoding (Asahina et al., Reference Asahina, Shinozaki, Masuda, Morimitsu and Satake2010) and for phylogenetic analysis (Kuo et al., Reference Kuo, Li, Chiou and Wang2011). The matK is a candidate plastid region found in gymnosperms, angiosperms and liverwort (Hollingsworth et al., Reference Hollingsworth, Andra Clark, Forrest, Richardson, Pennington, Long, Cowan, Chase, Gaudeul and Hollingsworth2009). According to the Consortium Barcode of Life (CBOL Plant Working Group, 2009), the matK gene is widely used for plant identification due to its slow mutation rate and specificity. The reconstruction of phylogenetic trees and genetic divergence was also completed using the matK gene (Udensi et al., Reference Udensi, Ita, Ikpeme, Ubi and Emeagi2017). The present study made an attempt for robust phenotyping using nearly all the qualitative and quantitative morphological parameters which was not done previously. Besides, molecular assessment added additional information which made the present study unique whereas the previous studies included either limited traits or lacks any molecular based reliable characterization. This study provides useful and reliable information that should be used in cashew-breeding programmes. It highlights the agro-morphological variability that exists among cashew hybrids and their parents which opens the way to the selection and production of improved competitive cashew cultivars. Crop improvement is made more successful by choosing parents with various genetic backgrounds, safeguarding germplasm and understanding existing genetic diversity. In order to provide cashew breeders with subsets of germplasm with higher yield and quality kernels, the goal of this study was to expand the evaluation of phenotypic variation patterns using morphological descriptors in cashew parents and their hybrids grown in West Bengal, India. Integration of biotechnological tools and conventional breeding methods will accelerate cashew-breeding programmes and widen the genetic base. This study also aimed to examine the genetic diversity among cashew germplasm based on the morphometric traits and matK gene-based molecular markers.
Materials and methods
Experimental site and materials
Cashew genotypes were selected from ICAR-All India Coordinated Research Projects (AICRP) on cashew, and the field experiment was performed during the 2021 and 2022 consecutive years for the evaluation of hybrids and parental trees at the Regional Research Station, Bidhan Chandra Krishi Viswavidyalaya (BCKV), Jhargram, Paschim Medinipur, West Bengal, located at 22.45°N, 86.98°E, 81 m above mean sea level. The climate is tropical and humid in the dry months. A total of 56 samples of cashew germplasm were assessed after being grouped into five populations based on their parental genotype (Table 1). The trees were planted at a distance of around 7 m × 7 m with pit sizes of 60 cm × 60 cm × 60 cm, covering a total area of 10 ha. The trials were performed following a randomized block design with three replications. For each individual genotype, three trees were selected. Each replication represents three branches from different directions of the tree from which morphological data were collected. On the basis of the origin and potential of the parental varieties, the parents were selected for producing hybrids based on cluster bearing, bold nuts, synchronized flowering and medium nuts/panicle (Table 1).
Table 1. Information on parents

Collection of data and parameters recorded for data analysis
Scoring was performed for all qualitative traits as per National Bureau of Plant Genetic Resources and Catalogue-V of Minimum Descriptors of Cashew Germplasm Accessions by ICAR-Directorate of Cashew Research, Puttur, D.K., Karnataka, India (Nayak et al., Reference Nayak, Mohana, Bhat, Saroj, Swamy and Bhat2014). Data for 65 descriptor traits (32 qualitative and 33 quantitative) were assessed for 56 cashew genotypes during morphological characterization using measurement materials such as metre ribbon, direct observations and comparison with descriptor schemes, direct observations, etc. For reliable descriptions, traits were comfortably categorized as qualitative and quantitative traits as described in online Supplementary Table S1 (Figs. 1–3).

Figure 1. Variability in cashew genotypes: tree habit (a), leaf shape (b), number of leaves per twig (c) and leaf apex (d).
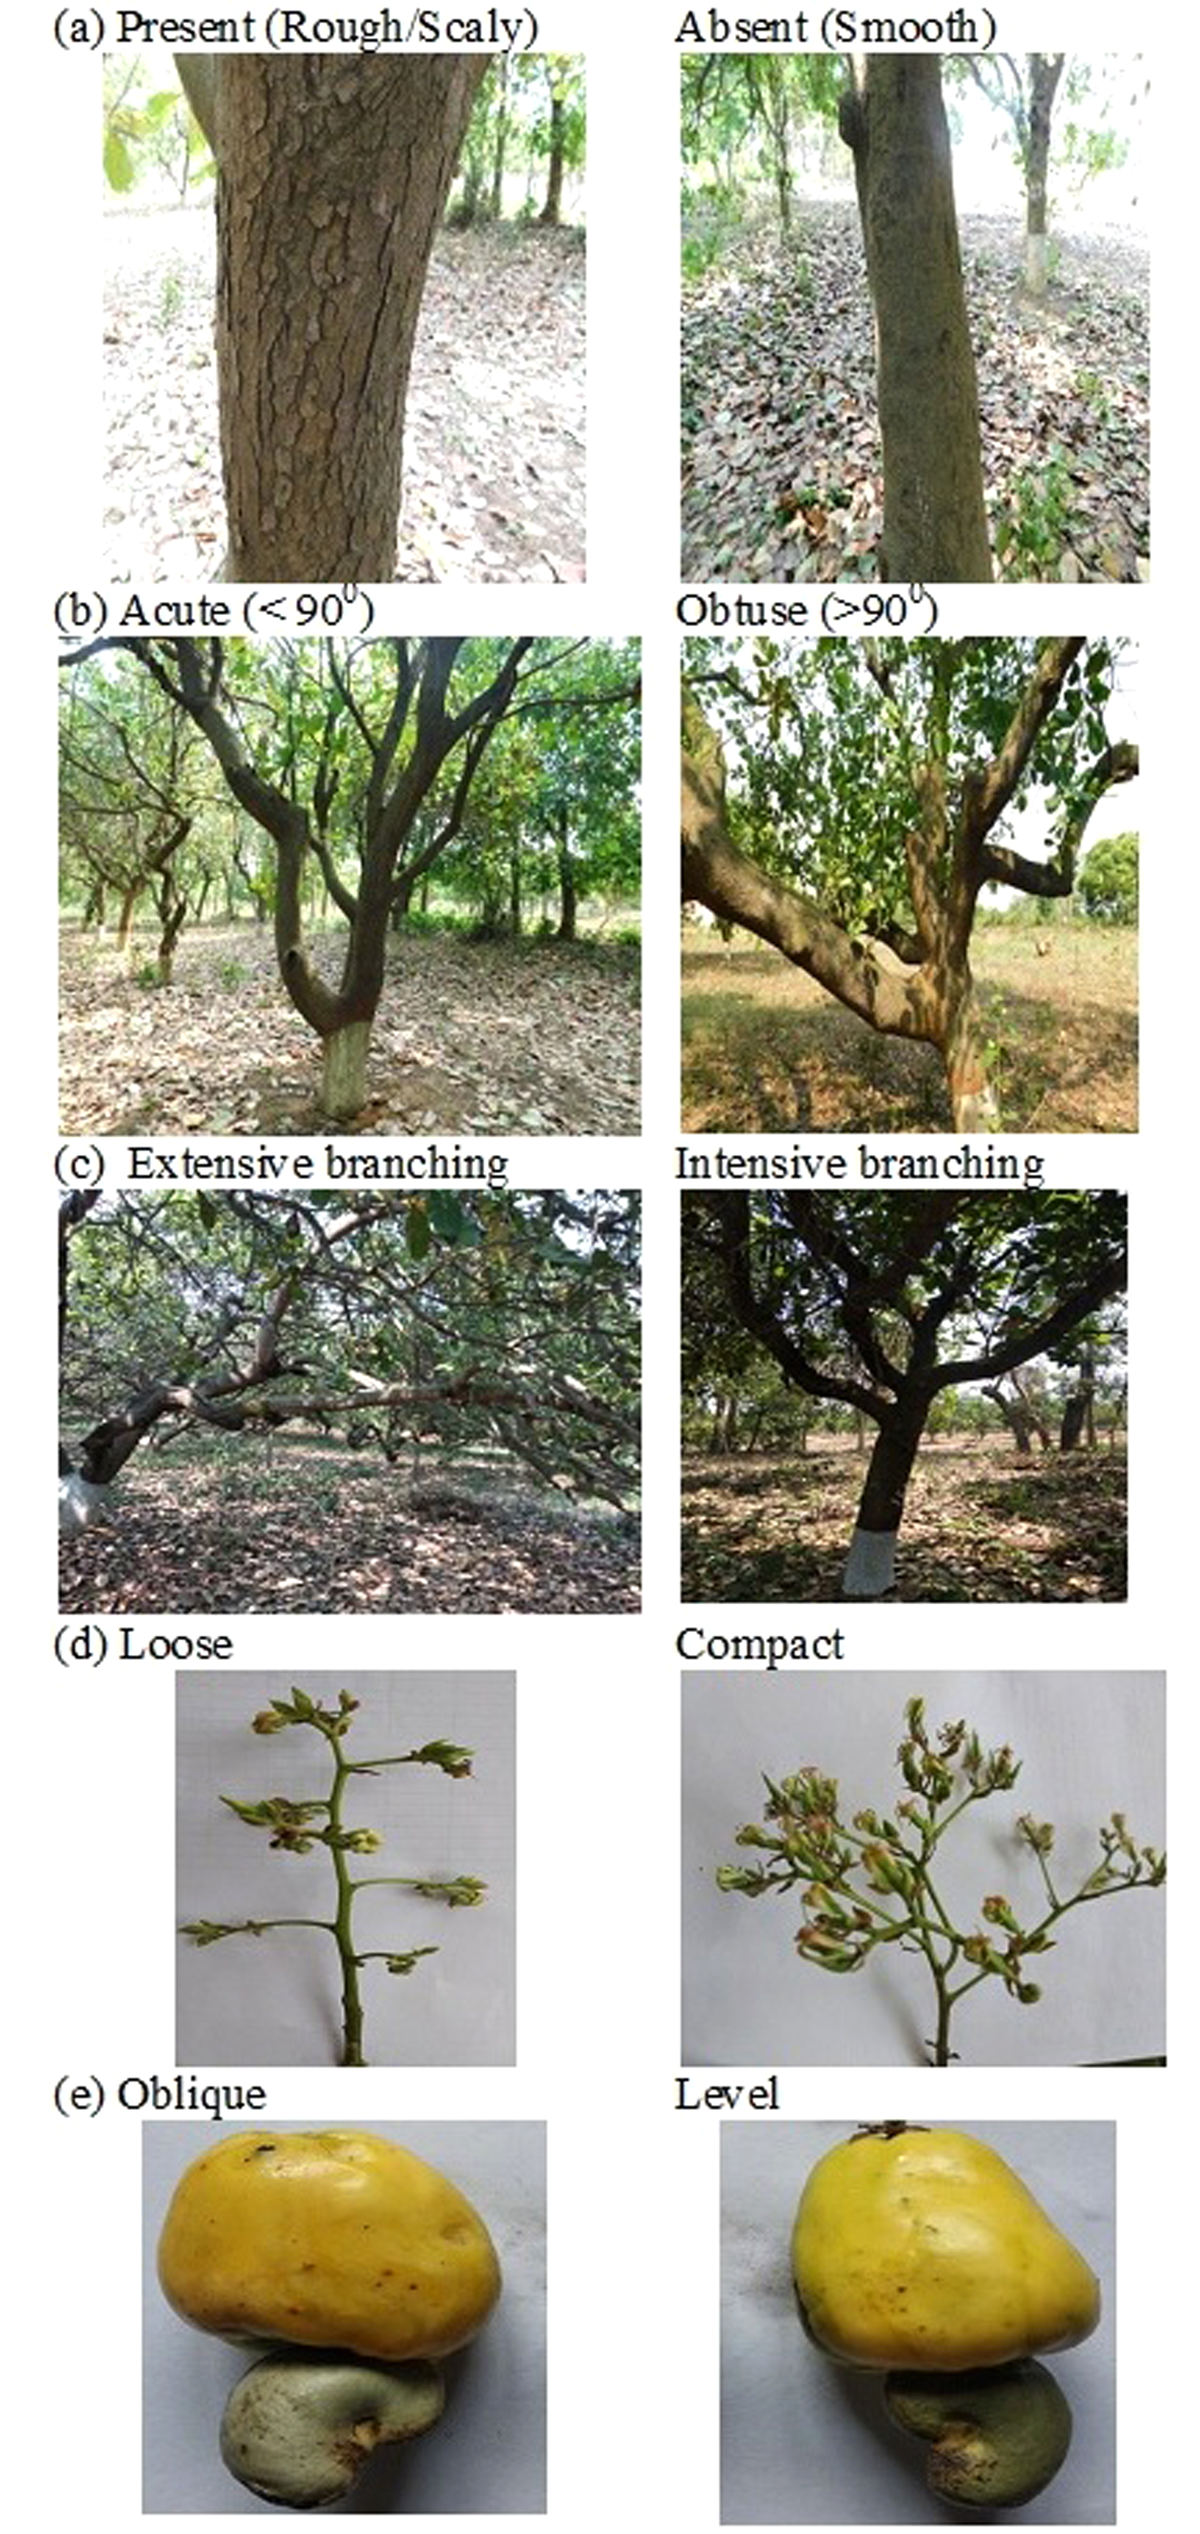
Figure 2. Variability in cashew genotypes: cracks on trunk bark (a), crotch angle (b), (c) branching pattern, compactness of inflorescence (d) and apple apex (e).

Figure 3. Variability in cashew genotypes: inflorescence length (a), flower colour (b), cashew apple colour (c), ridges on cashew apple (d) and cashew apple shape (e).
Statistical analysis
To characterize phenotypic frequencies, the Shannon–Weaver diversity index was used. It is calculated as follows:

where pi is the proportion of the total number of characters to the ith class and R is the number of phenotypic traits for a class. To express the values in the 0–1 range for H′, the value of H was converted by dividing by H max. The H′ was then classified as high (H′ ≥ 0.60), intermediate (0.40 ≤ H′ ≤ 0.60) or low (0.10 ≤ H′ ≤ 0.40).
For all quantitative data assessment, analysis of variance (ANOVA), multiple regression analysis and character association were performed. SPSS (Statistical Package for the Social Sciences) V23 software was used for all statistical analysis. The analysis and dendrogram construction were performed using Dissimilarity Analysis and Representation for Windows software.
matK analysis
Genomic DNA was isolated using cetyltrimethylammonium bromide as per Ferdous et al. (Reference Ferdous, Hanafi, Rafii and Muhammad2012). The presence of a single, sharp band of high molecular weight without smearing indicates good-quality DNA. The extracted DNA quality was quantified through the UV-1800 Shimadzu spectrophotometer. The primers were synthesized using the National Centre for Biotechnology Information (https://www.ncbi.nlm.nih.gov/tools/primer-blast/) and designed to cover partial regions of the gene. Four partial regions of 333, 692, 188 and 288 bp of matK were amplified from 56 cashew germplasm using primer pairs CsAmuta01, CsAmuta03, CsAmuta06 and CsAmuta10. polymerase chain reaction (PCR) was carried out in a Veriti 96-Well Thermal Cycler by Thermo Fisher Scientific, using a reaction volume of 25 μl, containing 1.5 μl template DNA (20 ng/μl), 0.2 μl Taq DNA polymerase (1 unit), 2 μl forward primer and 2 μl reverse primer, 1 μl deoxynucleoside triphosphate (10 mM), 2.5 μl 10× PCR buffer (with 10 mM MgCl2) and 15.8 μl nuclease-free water. The PCR programme used the following temperature profile: initial denaturation for 3 min at 94°C, 40 cycles of 30 min at 94°C, 1 min of annealing at T m (according to the annealing temperature of primers), at 72°C (extension) and a final extension of 10 min at 72°C (Yu et al., Reference Yu, Xue and Zhou2011). Amplified PCR products were run through 2% agarose gel electrophoresis followed by gel visualization through Zenith Gel Documentation System.
Computation of primer parameters
The binary matrix contained the scores for each entry. The information on allelic diversity and polymorphism is based on a comparison of the polymorphism information content (PIC) as per Anderson et al. (Reference Anderson, Churchill, Autrique, Tanksley and Sorrells1993). The polymorphism percentage (PP) was calculated using the formula: PP = (number of unique alleles/total number of alleles) × 100.
The resolving power (R p) was calculated using R p = ∑Ib, where Ib is the allele information, and the marker index (MI) was calculated using MI = PIC × proportion of polymorphic bands × average number of loci per assay unit (Powell et al., Reference Powell, Morgante, Andre, Hanafey, Vogel, Tingey and Rafalski1996). According to the formula EMR(E) = n p(n p/n), the effective multiplex ratio (EMR) is the result of the number of polymorphic loci and their proportion in a single experiment, where n is the overall number of loci and n p is the number of polymorphic loci.
Results
Morphological variation in cashew genotypes through qualitative descriptors
In these 2 years of observation, no difference among the genotypes was found in respect of the 32 qualitative traits, and the frequency distribution clearly depicts the nature of all the genotypes with respect to all monogenic traits. Refer to online Supplementary Table S2.
More than 50% of trees show apples with an angular base but a level apex. The genotypes showed equal traits for nut length. Grey-matured nutshells had 53.57%, while buff-matured nutshells had 42.86%. None of the genotypes was observed for the purple-coloured nutshells. For the shape of the nut base, genotypes were categorized into four groups: round (42.86%), flattened (28.57%), obliquely flattened (28.57%) and angular (1.29%). Assessment of the Shannon–Weaver diversity index across the descriptors is indicative of effective diversity. Due to differences in the composition of chemicals such as carotenoids, phenols, tannins, etc., the young leaves showed the highest diversity index (0.95). A higher diversity index (0.94) was also revealed by mature leaf colour, apple shape and colour, and apple and nut base shape. However, the lowest diversity was observed for the branching pattern (0.38).
Quantitative characterization of cashew genotypes
Observations on the quantitative characteristics of the 56 cashew genotypes were recorded for 2 years, during 2020–21 and 2021–22 (online Supplementary Table S3). Genotypes H-136, H-170 and H-134 were classified as tall trees, showing differential growth rates in terms of tree height, while WBDC-V and red hazari showed minimum tree height. For canopy spread northsouth, genotypes H-39, H-30 and H-147 showed the widest canopy spread, tree area (m2) and tree spread. Nut weight in the present study varies from 3.91 to 9.3 g in 2021 and from 3.66 to 9.00 g in 2022. Observed values for nuts/m2 ranged from 4 to 40.5 in 2021 and from 4 to 42.5 in 2022. Shelling per cent varied from 15.49 to 61.85% in 2021 and from 15.55 to 56.34% in 2022.
ANOVA for quantitative traits
The ANOVA performed for all 33 quantitative traits among those five genotypic groups revealed significant variation between groups and within groups (online Supplementary Table S4). During 2021, vegetative characters such as internode length, vegetative flush/m2 and twig diameter; flowering components such as inflorescence length and breadth and cashew kernel components such as kernel width and thickness were found to be highly significant (P = 0.01) in 2021. During 2022, ANOVA showed highly significant (P = 0.01) variation among vegetative characters such as internode length and vegetative flush/m2, the flowering component only inflorescence breadth and cashew kernel weight.
Mean quantitative traits of different genotype groups under study during 2021 and 2022
For mean performance (online Supplementary Table S5) and box plots describing the confidence level of the mean and the median (online Supplementary Figs. S1–S6) during 2021, group 1 was a significantly vigorous vegetation producer. Group 4 had better inflorescence length compared to others. The mean performance of group 4 was higher. Nuts/m2 was significantly higher in group 3, which was similarly better. The superior performance for nut weight was found in group 4 during 2022 and vigorous nuts/m2 was observed in group 3. Quality kernel length was shown by group 2. Significant performance with respect to kernel width and superior apple length was obtained in group 1. Nuts/m2 and nuts/panicle were found to be highest in group 3. Thereby, it can be concluded that trees from group 3 are higher nut producers; refer to online Supplementary Table S6 and Figs. S1–S6.
Association of yield with different agronomic quantitative traits
Moderate-to-high significance and a positive correlation were found between the quantitative discriminant variables for both 2021 and 2022. The highest positive correlation coefficient was obtained between yield and nuts/m2 followed by yield and nuts/panicle (online Supplementary Table S7). Results were similar for 2022 (online Supplementary Table S8). It can be concluded that cashew yield per tree had a highly significant correlation with canopy spread N-S, canopy spread E-W, tree area, tree spread, nuts/m2 and nuts/panicle.
Multiple regression analysis
In multiple regression analysis, nut yield was a dependent character, and the other 32 characters were independent predictor variables that were included in the regression model. The results indicated a higher magnitude of R 2 values of 0.80 (for 2021) and 0.86 (for 2022). An adjusted-R 2 value of 0.79 (for 2021) and 0.84 (for 2022), which indicated that the variables in the regression model cumulatively explained 80% (for 2021) and 86% (for 2022) of the variance in the yield component traits under this study (Table 2).
Table 2. Multiple regression model for nut yield and its contributing traits for 2021 and 2022

a SE, standard error.
The results further show that the regression coefficients of nuts/m2, tree area, nuts/panicle, kernel weight, shell thickness, inflorescence breadth and sex ratio significantly predicted the yield per tree. These seven variables have an assured influence on nut yield, and the best-fit regression equation is provided in online Supplementary Table S9. The variables with a non-significant P-value were eliminated from the regression model.
Genetic diversity based on qualitative characters
The dendrogram was grouped into five divergent clusters. The dendrogram showed dissimilarity indices ranging from 32 to 91%. The Jaccard's dissimilarity coefficient was found to be highest between genotypes H-176 and H-30 (0.91), and was minimum in genotypes H-140 and H-165, H-170 and H-171 (0.32). Cluster I comprises the largest number of members compared to other clusters, as evident from both the cluster analyses (CA). Based on the consensus of CA, the following clusters and their group members were formed (online Supplementary Fig. S7). In this study, it was observed that most of the cashew genotypes from the same cluster concerning selected qualitative traits have the same characteristics. In the clustering pattern, most of the individuals were characterized by spreading tree habits with extensive branching and pyramidal inflorescence in cluster I. Cluster II is composed of seven trees that produce pink flowers in compact inflorescence. Cluster III had yellow-coloured apples produced by pink-coloured flowers arranged in all-round main axis inflorescence types on upright and open trees. In cluster IV, seven trees shared common characteristics such as upright and open tree habits, white flowers in broad pyramidal inflorescences, and the production of yellow-red apples. In cluster V, trees produced pink-coloured flowers and yellow cashew apples on extensive branching of spreading-type trees.
Principal component analysis
A principal component analysis (PCA) was conducted for the 11 agronomically important quantitative traits related to yield of the 56 cashew germplasm samples to reveal the structure by analysing the relationship among multiple traits for 2021 and 2022. Combined with the eigenvector and principal component load matrix, the total contribution rate was 83.9% (for 2021) (online Supplementary Table S10) and 82.8% (for 2022) (online Supplementary Table S12).
On the basis of the coefficient and load matrix of the first two principal components (online Supplementary Table S11), the linear equations between the physical characteristic indexes of quantitative traits and the principal components were used, exhibiting the principal component and corresponding variables as follows:


For 2022 (online Supplementary Table S13), the linear equations exhibiting the principal component and corresponding variables are as follows:


Genetic diversity based on quantitative characters
The CA grouped 56 genotypes of cashew into five diverged clusters (online Supplementary Figs. S8 and S9), which were grouped into three diverged clusters. Most of the trees in clusters II, IV and V were of the tall type (>4.0 m). Vegetative flush/m2 was found to be lowest in genotypes in cluster V but higher than average in cluster III. All the genotypes in cluster V had high apple weights (>52 g). Nuts/m2 was found to be higher in cluster III trees. Intermediate kernel weight (1.2–2.5 g) was found in most of the trees in cluster I and also showed a bold nut (kernel thickness >9 mm). The highest-yielding producer genotype belonged to cluster III.
In 2022, except for cluster III, all genotypes from different clusters were tall (>4.0 m). Cluster III had the trees with the thickest girth; in contrast, in clusters I and III, trees had a medium-to-high girth. Apple weight was found to be medium in all the trees in cluster IV, and higher apple weight was obtained in clusters I and II. Nuts/m2 was found to be lower in clusters IV and V, while cluster I had a good yield and higher kernel quality. Cluster II had an average nut yield and average tree height.
Amplification of matK gene-based primers and genetic diversity
The matK primer pairs were successfully amplified in 56 cashew germplasm, with PIC values of 0.24 in primer CsAmuta01, 0.33 in primer CsAmuta03, 0.49 in primer CsAmuta06 and 0.43 in primer CsAmuta10. Primer pairs CsAmuta01 (Fig. 4) and CsAmuta10 showed 100% polymorphism (online Supplementary Table S14). Genetic diversity grouped cashew trees into four major clusters (online Supplementary Fig. S10). Cluster A consists of trees of the spreading type with extensive branching, pyramidal inflorescence and yellow-coloured cashew apples, and the nut yield is more than 10 kg per tree. The trees in cluster B produce good-quality kernels, and the pseudo-apples they produce are also biochemically rich with pink flowers and compact inflorescence. In cluster C, the cashew trees are upright and open, bearing yellow-coloured apples, pink flowers and average nut producers.

Figure 4. Profile among genotypes using CsAmuta01 primer pair. Left to right: M, 100 bp DNA ladder, (1) local parent, (2) 2/9 Dicherla, (3) H-28, (4) H-30, (5) H-36, (6) H-39, (7) H-2/15, (8) red hazari, (9) H-109, (10) H-110, (11) H-111, (12) H-113, (13) H-114, (14) H-115, (15) H-117, (16) H-129, (17) H-130, (18) H-132, (19) H-133, (20) H-134, (21) H-135, (22) H-136, (23) H-137, (24) WBDC- V, (25) JGM-1, (26) H-49, (27) Bla-39-4, (28) H-146, (29) H-144, (30) H-147, (31) H-140, (32) H-142, (33) H-145, (34) yellow hazari, (35) H-153, (36) H-154, (37) H-155, (38) H-157, (39) H-158, (40) H-159, (41) H-160, (42) H-161, (43) H-162, (44) H-163, (45) H-164, (46) H-165, (47) H-166, (48) H-167, (49) H-168, (50) H-169, (51) H-170, (52) H-171, (53) H-172, (54) H-173, (55) H-174, (56) H-176.
Discussion
In this study, spreading-type tree habits were dominant confirming previous results obtained by Reddy et al. (Reference Reddy, Mohammed and Kumar2002) and Asna et al. (Reference Asna, Menon and Smitha2021). Trees with a minimum height and differential canopy patterns significantly yielded the most confirming results from previous studies (Dorajeerao et al., Reference Dorajeerao, Ravisankar, Reddy and Dayanand2002; Reddy et al., Reference Reddy, Mohammed and Kumar2002; Chandrasekhar et al, Reference Chandrasekhar, Sethi, Tripathy, Mukherjee, Panda and Roy2018). Considerable leaf size variation among cashew genotypes was evident, where a bigger leaf area contributes to photosynthesis and biomass output, with a similar variation of leaf size reported by Reddy et al. (Reference Reddy, Mohammed and Kumar2002). We also observed a considerable variation in percentage shelling and shell thickness between the genotypes under the study. Percentage shelling is considered important commercially and industrially, as reported by Chipojola et al. (Reference Chipojola, Mwase, Kwapata, Bokosi, Njoloma and Maliro2009); Jena et al. (Reference Jena, Samal, Pal, Das and Chand2016); Adeigbe et al. (Reference Adeigbe, Adewale, Muyiwa, Olasupo, Olaniyi, Adenuga and Aliyu2016) and Sempore et al. (Reference Sempore, Songré, Tarpaga, Bationo and Dicko2021). Apple-to-nut ratio is a measure to determine the importance of cashew apple weight on the outcome of cashew nuts which was found to be highest in hybrid H-168. In order to achieve intensive cultivation, an upright and compact tree habit is most suitable for accommodating a large number of trees per unit area, and productivity may be higher in a spreading-type tree habit with extensive branching. Our results show 19.64% of the cashew trees follow this tree habit.
In our study, characteristics such as tree spread, trunk height, vegetative flush/m2, nut weight, kernel weight, kernel length, flowering duration and yield showed the highest variability which were in agreement with the findings of Aliyu and Awopetu (Reference Aliyu and Awopetu2011); Jacinto et al. (Reference Jacinto, Brás, Valdiviesso, Capelo, Arsénio and Nóbrega2020) and Adu-Gyamfi et al. (Reference Adu-Gyamfi, Akpertey, Barnnor, Ofori and Padi2020) for agro-morphological traits of cashew. From the present study cashew hybrids H-39, H-113, H-129 and H-49 were found with the potential highest yielders. However, there could be discrepancies in cashew kernel weight, quality and yield in different parts of the world because the best growth for most trees depends on well-distributed rainfall in the pre-flowering phase and the kind of soil.
Positive correlation coefficients with growth parameters such as canopy spread N-S, canopy spread E-W, tree spread, nuts/m2 and nuts/panicle, which reflect strong genotypic linkage, also suggest that nut yield will be affected by impairing any of these parameters. Apple weight and apple length were found to have a highly significant correlation in this study. This may lead to the selection of better-quality cashew apples for the juice industry and ultimately be used for cashew breeding (Chabi et al., Reference Chabi, Adoukonou-Sagbadja, Ahoton, Adebo, Adigoun, Saidou and Baba-Moussa2015; Djolossè et al., Reference Djolosse, Sagbadja, Gbemavo, Kodjo, Badou, Maliki and Nra2019). In our investigation, variability among cashew apple colours was also observed, which ranged from red to yellow-red to yellow.
Regression analysis establishes a base for meticulous selection with respect to yield-contributing characters or traits as well as to compensate for yield losses (Sethi et al., Reference Sethi, Dash and Tripathy2020). Variables such as nuts/panicle, tree height and canopy spread revealed significant values in regression studies. The PCA derived from 2-year data indicated that extensive branching and higher canopy spread are yield contributors under differential environmental conditions. Previous studies have shown that clustering of cashew cultivars from different ecotypes through genetic diversity resulted in similar trends where cultivars showing a few similar traits were closely associated (Jena et al., Reference Jena, Samal, Pal, Das and Chand2016).
Diversity based on matK markers differentiated tree morphotypes efficiently. Studies showed similar findings by Hand et al. (Reference Hand, Cogan and Forster2012) and Abouseada et al. (Reference Abouseada, Mohamed, Teleb, Badr, Tantawy, Shafik, Ibrahim, Ellmouni and Ibrahim2023). Studies by Probojati et al. (Reference Probojati, Listyorini, Sulisetijono and Wahyudi2021), for instance, showed that the high nucleotide density among sequences of the matK gene is due to a large population historically. Along with this, findings reported by Viswanathan et al. (Reference Viswanathan, Rajasekar and Sathish2015), Nguyen et al. (Reference Nguyen, Tran, Tran, Ohsawa and Yoshioka2019) and Yang et al. (Reference Yang, Chen, Wang, Tian, Zheng, Jin, Hao, Xue, Ding and Zong2023) suggest the effectiveness of matK gene-based primers in genetic diversity studies. The matK gene facilitates identification of genetic background (Anita-Sari et al., Reference Anita-Sari, Sobir, Susilo, Hidayatullah, Sugianto and Faizal2018). Genetic background ensures efficient parent selection in future breeding programmes. In addition to this, genotyping of the matK gene can be applied for backcrossing (Adriansyah et al., Reference Adriansyah, Hasmeda, Suwignyo, Halimi and Sarimana2021). Thereby, the matK gene can be directly deployed for future breeding and genetic purposes. The current study's findings are particularly interesting because of the existing and future benefits for developing new crop types to boost cashew production diversity and food security, as well as ensuring sustainable crop utilization in terms of nut yield, juice processing sector and high profitability.
To conclude, the present investigation identified a set of morphological traits and molecular markers to be used for direct selection of the better cashew-breeding lines with higher genetic gain in a cheaper and easiest way. Further, the use of matK gene-based genetic diversity has been proved as the essential molecular characterization. A number of cashew hybrids (H-39, H-113, H-129 and H-49) with desired traits have also been identified for further use from the present study. Future research should identify a set of markers with high discriminatory power to be used for the quality control of cultivars.
Supplementary material
The supplementary material for this article can be found at https://doi.org/10.1017/S1479262123000874.
Data
All data generated or analysed during this study are included in this paper and its additional files as Supplementary material.
Acknowledgements
The current research was successfully accomplished at the Regional Research Station (AICRP on Cashews), BCKV, Jhargram, Paschim Medinipur, India. The first author is extremely thankful to AICRP (All India Coordinated Research Projects) on cashew for providing all the essential assistance for collecting morphological data.
Author contributions
S. D.: carried out the experimental work, performed data collection and writing – original draft preparation and evaluation. M. N. A. and S. D. performed literature search, statistical analysis and editing. M. N. A. supervised the original draft. S. B. performed the review and editing. M. P. reviewed the draft and contributed to data collection of morphological parameters.
Competing interests
None.


