Policy efforts to mitigate global climate change are projected to impose significant economic costs on firms. Yet a large and growing number of firms lobby actively in favor of climate change cooperation and domestic regulation to mitigate carbon emissions. Support for mitigation policies can be found across a range of industries, from transportation and electronics to cement production and finance. Even within the oil and gas industry, infamous for its historically trenchant opposition to climate action, major players such as BP and Shell have come out in favor of policies designed to reduce carbon emissions.
Support for domestic regulation is especially puzzling in the context of an increasingly integrated global economy. Domestic regulation will raise energy costs, undermining domestic producers’ competitiveness both at home and abroad. Consider the global aluminum industry. Aluminum smelting is energy intensive, with energy accounting for 20 percent of overall production costs.Footnote 1 The US aluminum industry faces stiff competition from abroad. Yet when the US House of Representatives passed nation-wide carbon cap-and-trade legislation in 2009, Pittsburgh-based producer Alcoa Corporation was among its most vocal proponents.Footnote 2
Alcoa's support for cap-and-trade was more than a simple public relations campaign. Alcoa was a founding member of the US Climate Action Partnership (US CAP), an industry group counting BP, Duke Energy, and Caterpillar among its members. The Waxman-Markey bill passed by the House of Representatives was modeled directly on draft legislation published by US CAP.Footnote 3 Outside of US CAP numerous other firms, including electric utilities themselves, provided public support for climate action. Louisiana-based electric utility Entergy called the proposed cap-and-trade system “a major step forward in solving the biggest challenge of our time” and lobbied for its passage.Footnote 4 These and other firms played a major role in pushing for, and shaping, US cap-and-trade legislation.
To be sure, private sector opposition remains. In fact a key feature of industry's response to climate change policy has been its divisiveness within industries. While BP promoted the 2009 cap-and-trade bill as a member of US CAP, Exxon Mobil denied the threat of climate change until a change in leadership brought grudging acknowledgment in 2014. While Alcoa has long advocated effective climate change policy, one of its main US competitors, Noranda Aluminum, publicly threatened to relocate to Mexico if Waxman-Markey became law and lobbied lawmakers to oppose.Footnote 5 Major agricultural groups including the National Farmers Union supported the cap-and-trade bill while the American Farm Bureau and others lobbied against it.Footnote 6
Why do some firms support costly legislation while others continue to oppose? How does globalization shape firm incentives to support domestic regulation? I argue that competition for market share drives firms to support climate change policies in order to impose costs on domestic competitors. While policies to combat climate change impose costs on all firms in the economy, these costs vary across firms even within industry. It follows that while climate change policy increases costs across the board, it also leads to shifts in market share that benefit those firms with relatively low adjustment costs. If these shifts in market share are large, they may compensate for the policy's direct costs, creating incentive for low-adjustment-cost firms to lobby in favor. This has distinct implications for the strategic calculus of firms exposed to the global economy.
There are several reasons that domestic competitors might anticipate dramatically different adjustment costs from regulation. First, cost advantages may arise as a result of variation in firms’ ex ante capital stock. Increasing the energy efficiency of production becomes more expensive the older a firm's machinery and equipment currently in use.Footnote 7 Second, asymmetric adjustment costs might reflect prior investments related to energy efficiency or long-term access to clean energy.Footnote 8 Third, adjustment costs can vary with the location of firms’ production facilities. Within the United States, regions vary in the mix of fuels commonly used for electricity generation. Those regions that rely more intensively on coal tend to emit high levels of greenhouse gases. The costs of emissions reduction in these areas are anticipated to be higher relative to regions that rely on cleaner sources of fuel.Footnote 9
From here on I refer to any firm-specific advantage in adjusting to the costs of mitigation policies as green capital. To study how green capital affects firm behavior I develop a game theoretic model in which two firms have the opportunity to participate in the political process prior to engaging in market competition. The model consists of two phases. In the policy phase firms offer campaign contributions to a single policymaker who subsequently chooses a level of regulation for the economy.Footnote 10 In the competition phase each firm selects a level of output and sells its product at the resulting market price. Tying the two phases together is the relationship between the level of regulation in the economy and firms’ (relative) marginal costs. Marginal costs are increasing in the level of regulation in the economy. Yet the sensitivity of marginal costs to regulation depends upon firm-specific green capital: firms with high green capital anticipate lower marginal adjustment costs than their competitors.
I first analyze equilibrium behavior in a benchmark model in which only domestic firms compete. I provide conditions under which firms facing low adjustment costs lobby in favor of climate change legislation. The degree of heterogeneity in adjustment costs is key: supportive lobbying will emerge only where firms hold a significant cost advantage over the competition. I also demonstrate the model's plausibility by providing empirical evidence consistent with the core argument that competitive concerns drive lobbying on climate change legislation. I analyze newly collected data on firm lobbying in favor of the American Clean Energy and Security Act, a nation-wide cap-and-trade bill passed by the US House of Representatives in 2009. Using fine-grained geographic proxies for anticipated adjustment costs, I find that firms whose competitors are expected to bear high costs are significantly more likely to lobby in favor.
I next consider firms’ incentives to lobby in favor of climate change regulation in an open economy. Firms facing import pressure—or engaged in export abroad—must compete with foreign firms not subject to the domestic regulatory environment. Yet gains in competitiveness relative to domestic competitors may compensate for losses relative to foreign firms. Firm preferences reflect not only the market share of foreign competitors, but also the distribution of green capital among domestic competitors. I also show that firms engaged in global value chains may gain from climate change regulation if it increases the cost of intermediate goods to domestically sourced competitors. Statistical tests support the argument that multinationals active in final goods production exhibit greater preference intensity—that is, are more likely to lobby in favor of climate change regulation—than their counterparts engaged in other stages of production.
The arguments advanced here amend two dominant approaches to the study of firms and climate change politics. Most closely related, a series of papers explore firms’ competitive incentives to embrace pro-environmental lobbying. Vogel argues that early adopters of environmental standards export these standards to trade partners through restrictions on market access benefiting firms in front-runner countries at the expense of laggard-country competitors.Footnote 11 Genovese and Tvinnereim and Genovese emphasize the direct gains accruing from the overallocation of permits to some firms under carbon trading schemes, permits which can be subsequently sold for windfall profits.Footnote 12 My argument is substantially more general than these earlier accounts: it establishes that strategic incentives to support climate change regulation can occur in nearly any regulatory setting. The emergence of these incentives does not rely on the presence or absence of asymmetries in how industries are regulated nor on cross-national variation in the adoption of climate change regulation. Instead, variation in firms’ anticipated regulatory costs alone is sufficient to generate support.
A second approach to the study of firms and climate change politics emphasizes the role of open borders in shaping firm preferences. Where regulation remains lax, domestic firms abroad may fear greater competition from foreign firms operating in comparatively low-cost environments.Footnote 13 Another widely held view is that multinational corporations (MNCs) may support climate change regulation to promote compatibility of national policy initiatives.Footnote 14 The theory and supporting evidence I describe provide a very different account. First, even in the presence of foreign competition, firm preferences are determined in part by their position with respect to domestic competitors. Second, multinational firms may in fact gain from variation in national regulatory regimes, an alternative explanation for MNC preferences which is supported by the descriptive analysis.
In addition to these substantive contributions, this work builds on the now-standard approach of incorporating insights from the field of industrial organization into models of international trade.Footnote 15 The results of this “new” New Trade Theory have been fruitfully applied to the study of firm political preferences in a growing number of papers.Footnote 16 In a similar vein this work draws on the insights of industrial organization regarding regulation's competitive effects within industry. This argument has most widely been made where regulation acts as a barrier to entry.Footnote 17 Yet as in my current work others have studied the distributional effects of regulation that affect firm-variable costs.Footnote 18
Incorporating these insights into an open economy setting highlights how domestic competition mediates firm preferences for international cooperation. Thus far the dominant approach within international political economy has been to derive firm preferences by exploring their competitive position relative to foreign, rather than domestic, competitors.Footnote 19 Growing scholarly attention to within-industry variation in firms’ competitive positions suggests that this may overlook important nuances in firm preferences, arising from strategic and competitive considerations within the domestic market. While firms compete simultaneously with foreign and domestic competitors, domestic competitors will often be the more salient category which suggests that regulation’s implications for these firms will matter even within an open economy setting. Calculations about gains and losses relative to these distinct groupings combine to shape firm preferences for international cooperation.
The Asymmetric Costs of Climate Change Regulation
To elaborate on the argument, I provide descriptive analysis of firms’ political participation in climate change policymaking and variation in expected adjustment costs. I focus in particular on the case of the American Clean Energy and Security Act (ACES) of 2009, the closest the US Congress has come to enacting comprehensive climate change legislation. Passed by the US House of Representatives on 26 June 2009, the ACES called for a nation-wide “cap-and-trade” system to reduce emissions of carbon dioxide and other greenhouse gases. The patterns that emerge from this analysis provide support for the empirical plausibility of the formal model, and insight into the mechanisms of my argument.Footnote 20
The ACES originated in the House Committee on Energy and Commerce early in 2009 under the leadership of Representative Henry Waxman (D-CA), then chairman of the committee, and Representative Ed Markey (D-MA). The committee remained active throughout 2009 and 2010, holding a series of hearings on the design and implementation of a national carbon cap-and-trade system. Throughout, its membership was strictly partisan in its approach: voting for the bill took place along party lines with Republican members proposing over 400 amendments over the course of the year in an attempt to slow legislative progress. Campaign contributions to Democratic versus Republican members of the committee during this period thus provide a useful proxy for firms’ support or opposition to the cap-and-trade bill.Footnote 21
Figure 1 depicts the amount and proportion of campaign contributions directed toward each party for all Fortune 500 companies.Footnote 22 Each point corresponds to a single firm, scaled by the amount of the firm's total contributions. Vertical placement indicates the sector each firm is a member of while horizontal placement indicates the proportion of contributions directed toward Democratic (that is pro-climate legislation) candidates. While a number of firms give contributions to members of both parties and so fall within the interior of the plot, the vast majority of firms provide contributions to only a single political party. In fact a key feature of this giving is the variation within sector of firms’ preferred political party. Nearly all sectors appear strongly bimodal with a number of firms supporting only Republican candidates and a similar number supporting only Democratic candidates. Combined with the anecdotal data I noted in the introduction, these contributions suggest significant variation within industry in firms’ position taking with respect to climate change legislation.

Figure 1. Campaign contributions to members of house energy and commerce committee
My core argument is that this variation in firms’ position taking can be explained by intra-industry competition between firms. The following example illustrates the mechanism. In 2004 Colorado voters approved a state-wide renewable energy portfolio standard despite opposition from local utility companies, including Colorado's largest provider, Xcel Energy. Despite this initial opposition, Xcel quickly discovered that the renewable energy standard placed a far higher burden on its biggest competitors—older natural gas plants—whose facilities were less efficient because of age. Ordinarily the natural gas plants benefited from their older facilities, having paid off capital costs and bidding electricity prices low as a result.
The renewable energy standard reversed this advantage: Xcel gained market share while meeting its own regulatory burden with little effort. Unsurprisingly, Xcel subsequently reversed its political strategy, joining the successful campaign for an even stricter renewable energy standard in 2007.Footnote 23 Generalizing from this example about which firms will enjoy a cost advantage relative to their competition is no easy task. Adjustment to climate change regulation depends on a confluence of factors, the most salient of which may vary from one industry to another. Nonetheless publicly available data make clear the variation among firms in their likely costs of adjustment to any new climate change regime.
Figure 2 depicts within-industry variation on a number of dimensions likely to have an impact on climate change adjustment costs. The top two panels plot the mean versus standard deviation of (logged) annual investment in property, plant and equipment (left panel), and existing capital stocks (right panel) by industry. Manufacturing industries, on average disproportionately affected by climate change regulation due to their high energy usage, are depicted in black while nonmanufacturing industries are depicted in gray. Across industries considerable variation exists in the mean level of both investment and existing capital stocks. Yet both plots also depict significant variation among firms within industry: both display a near linear relationship between mean investment (capital stocks) and the corresponding industry standard deviation. Both variables matter for firm adjustment costs because existing capital stocks may require retrofitting or replacement to enhance energy efficiency while more recent investments—as in the case of Xcel—may indicate higher levels of ex ante preparedness.

Figure 2. Variation in firm investments and adjustment costs
The bottom two panels of Figure 2 speak directly to variation within industry in firms’ preparedness for climate change regulation. The left-hand panel depicts the density (across industries) of the proportion of firms employing several examples of energy-saving technology. For example, within the modal industry only around 15 percent of firms report employing automated technologies to control the building-wide environment, though in some industries the proportion of firms employing these technologies may be 50 percent or greater, again suggesting significant variation in firms’ existing investments in energy efficiency. The right-hand panel plots the proportion of firms by industry who report the ability to switch from electricity to alternative energy sources versus the proportion of firms in the same industry with the ability to switch from coal to alternative energy sources. While a number of industries cluster at 0—indicating that no incumbent firms report the ability to fuel switch on either dimension—within the majority of industries a positive though small fraction of firms report the ability to switch energy sources given appropriate incentives.
Figure 3 highlights one last source of variation in adjustment costs that firms often have little control over. The left panel of Figure 3 displays the spatial distribution of (logged) per capita carbon intensity from electricity generation across the fifty states with darker states corresponding to greater carbon intensity.Footnote 24 The right-hand panel of Figure 3 depicts the density of carbon emissions per capita from electricity generation, weighted by the number of firms operating in each state. The figure makes clear the variation in energy cost environment across firms. The modal firm is located in a relatively low carbon-intensive state but a large proportion of firms nonetheless operate in more emission-heavy environments.Footnote 25

Figure 3. Carbon emissions per capita from electricity generation
Finally I provide direct evidence of the variation in firms’ anticipated exposure to climate change legislation. To do so I estimate an event study of firm-level abnormal returns following passage of the ACES. Event studies are widely employed in the finance literature to estimate the impact of economic or financial events on the profitability of individual firms. The core idea of the event study framework is to predict firm profits immediately following the event, employing data from a period of time immediately preceding the event. The difference between observed and predicted profits is then interpreted as the abnormal return, potentially attributable to the event under study. The probability of observing this abnormal return by random chance can then be calculated employing an estimate of the variance of firm-level abnormal returns.
To predict abnormal returns I employ a market model, a standard approach in the finance literature, in which a predicted abnormal return is generated for each firm by regressing that firm's returns prior to the event on a chosen market index and then predicting returns based on the resulting coefficient estimates.Footnote 26 As my index I employ the Dow Jones Industrial Average and estimate the model employing data on the twenty-five days prior to and ten days following passage of H.R.2454 (the US Clean Energy and Security Act). If market actors anticipated a successful outcome in the days immediately prior to passage then including the observed returns from these days could bias the results. For this reason I exclude the five days prior to treatment from my definition of the pre-event window.Footnote 27
Figure 4 plots the estimated abnormal returns to all publicly traded manufacturing firms following the passage of the ACES. The abnormal returns, aggregated across firms and across industries, are jointly significant and negative on average. This is consistent with the predicted overall economic costs of climate change regulation. Yet within industry there is much variation in investor perceptions of the legislation's firm-level impact. Most importantly, while the average abnormal return for nearly all industries is negative as expected, in many industries the abnormal returns to a minority of firms are estimated to be positive, suggesting that some firms are expected to gain in profitability following the imposition of costly climate change legislation.

Figure 4. Abnormal returns to manufacturing industries following passage of H.R.2454
In the next section I develop a formal model that connects the variation in firms’ anticipated adjustment costs detailed here with support for climate change legislation.
Model
Let there be two firms i = 1, 2 and a policymaker. In the initial phase, firms attempt to influence the policymaker's choice of a (unidimensional) regulatory regime, r ∈ [0, R] where R > 0.Footnote 28 To do so, firms simultaneously announce contribution schedules, s i:[0, R] → ℝ+ for i = 1, 2. Each contribution schedule is a function, mapping every possible level of regulation to a corresponding non-negative campaign contribution, which the firm commits to providing in case that level of regulation is adopted. Contribution schedules are binding so firms cannot renege on their promises once they've been announced.Footnote 29
Following firms’ announcements of their contribution schedules, the policymaker selects a level of regulation. I assume that the policymaker cares about both the policy outcome and her realized campaign contributions. In particular her ideal policy is given by r PM ∈ [0, R].Footnote 30 While I take this ideal point to be exogenous, it can be interpreted as the social value of regulation, weighted by the policymaker's beliefs about the dangers of climate change. The policymaker values campaign contributions and is indifferent to their source. The policymaker's objective function is:
 $$g\lpar {r\vert s_1\lpar{\cdot} \rpar \comma \;s_2\lpar{\cdot} \rpar \comma \;r^{PM}} \rpar ={-}\lambda \lpar {r^{PM}-r} \rpar ^2 + \lpar {1-\lambda } \rpar \lpar {s_1\lpar r \rpar + s_2\lpar r \rpar } \rpar $$
where λ ∈ [0, 1] is the weight the policymaker attaches to her own policy preferences and (1 − λ) is the weight she attaches to campaign contributions.
In the competition phase of the game firms produce a single homogeneous good that they sell at an endogenously determined market price. The phase begins with firms simultaneously selecting output levels q i ∈ ℝ+ for i = 1, 2. Price is decreasing in aggregate output according to the inverse demand function:
 $$p\lpar q_i\comma \;q_j\rpar = \left\{{\matrix{ {\alpha -q_i-q_j} \hfill & {{\rm if\ }q_i + q_j \le \alpha } \hfill \cr 0 \hfill & {{\rm if\ }q_i + q_j \gt \alpha } \hfill \cr } } \right.$$
for some α > 0. Throughout I assume that α is “large” in the sense that for even the strictest regulatory regime, it remains optimal for both firms to produce positive output.Footnote 31
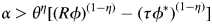
Firms have constant, asymmetric marginal costs reflecting the level of regulation in the economy, r, and a firm-specific parameter, F i, representing firm i's level of “green capital.” Green capital can be interpreted as any geographic or firm-level characteristic that provides advantage in the case that more stringent regulation is passed. For example, a low F i may reflect the location of production facilities in regions expected to be hardest hit by legislation or may reflect obstacles to increasing the energy efficiency of a firm's capital stock. Higher values of F i indicate that a firm holds a competitive advantage in coping with climate change regulation. Marginal costs are  $c\lpar {F_i\comma \;r} \rpar = {r \over {F_i}}$.Footnote 32
For both firms costs are increasing in r and decreasing in F i. The marginal cost of regulation, r, is strictly decreasing in green capital, F i. These assumptions are key for the results of the model. They ensure that firms holding high levels of green capital face lower adjustment costs than their high-cost competitors. Each firm's profits are defined by total revenue less total costs, or:
 $$\pi _i\lpar q_i\comma \;q_j\comma \;F_i\rpar = \left\{{\matrix{ {q_i \lsqb {\alpha -q_i-q_j-c\lpar F_i\comma \;r\rpar } \rsqb } \hfill & {{\rm if\ }q_i + q_j \le \alpha } \hfill \cr {-q_ic\lpar F_i\comma \;r\rpar } \hfill & {{\rm if\ }q_i + q_j \gt \alpha } \hfill \cr } } \right.$$
for i = 1, 2. I assume that firms seek to maximize profits less the cost of their equilibrium campaign contribution. I assume that there are some (unmodeled) barriers to entry which prevent profits from being dissipated.Footnote 33
Finally, let  $\gamma _i = {1 \over {F_j}}-{2 \over {F_i}}$ and vice versa for firm j. The meaning of this notation will become clear in the analysis. The following technical assumption ensures that the policymaker's utility is strictly concave, ensuring the existence of a unique solution:
 $$\lambda \gt \displaystyle{{\gamma _i^2 + \gamma _j^2 } \over {9 + \gamma _i^2 + \gamma _j^2 }}$$
It it straightforward to confirm that the lower bound on λ lies between 0 and 1 and is thus well defined. Substantively the assumption implies that the policymaker places relatively high weight on his own preferences relative to those of the firms. Alternatively this may be interpreted as implying that each individual firm has only a marginal impact on policymaking, an empirical point consistent with findings in the literature on firm lobbying.Footnote 34
In the analysis I restrict attention to Truthful (Subgame Perfect) Nash Equilibria.Footnote 35 A firm's contribution schedule is said to be truthful relative to equilibrium policy r* if one of the following conditions applies for every policy alternative, r′: (1) the promised contribution, s i(r′), leaves the firm with the same net utility if either r* or r′ is selected, or (2) the promised contribution is exactly 0. That is, if firm i's contribution schedule is truthful, then it offers for each alternative exactly its value for switching from r* to that alternative, provided this value is non-negative. Otherwise the firm offers 0. A Truthful Nash Equilibrium is a Nash Equilibrium in which all firms employ truthful strategies.Footnote 36
Green Lobbying in a Closed Economy
The focus of the following analysis is the emergence of firm lobbying in favor of climate change legislation. I first characterize optimal behavior at each stage of the game. Conditions for the emergence of green lobbying follow naturally from this analysis.
Equilibrium Characterization
The game is solved via backwards induction, beginning in the market competition stage. Firm i maximizes profits, taking into account firm j's output q j. The best response function maps firm j's output to firm i's optimal choice,  $\tilde{q}_i\lpar {q_j} \rpar $. Equilibrium outputs are determined by the intersection of the best response functions for the two firms. Firm i's equilibrium output is
 $$q_i^\ast{=} \max \left\{{\displaystyle{1 \over 3}\lpar {\alpha + r^\ast \gamma_i} \rpar \comma \;0} \right\}$$
where, as defined earlier,  $\gamma _i = {1 \over {F_j}}-{2 \over {F_i}}$. Note that given the assumption that α is large, $q_i^\ast \gt 0$ for any feasible regulatory level.
We can now interpret γ i substantively as a measure of the distance between the two firms’ marginal cost of regulation or firm i's relative efficiency. It is central to our analysis. For any positive level of regulation, firm i's output is increasing in its relative efficiency. At the same time, the impact of γ i on equilibrium output is moderated by the level of regulation. For low levels of regulation, differences in adjustment costs matter little. For higher levels of regulation, differences in adjustment cost will lead to significant divergence in firm outputs.
Firm profits depend both on total output and on production costs. Equilibrium profits are
 $$\matrix{ {\pi _i\lpar q_i^\ast \rpar } \hfill & { = \displaystyle{1 \over 9}{\lpar {\alpha + r\gamma_i} \rpar }^2} \hfill \cr } $$
It is immediate from this expression that firm i's profits are increasing in r when γ i > 0. This requires that firm i hold twice the level of green capital as firm j, F i > 2F j. If firm i holds only a slight advantage over his competitor, or if it is his competitor who holds the advantage, firm i's profits are decreasing in r. Note that if γ i > 0, it must be that γ j < 0. Profits can be increasing in regulation for at most one firm.Footnote 37
Now that we have characterized equilibrium behavior in the market competition phase of the game we can proceed to analyze optimal behavior during the policymaking phase. In selecting a level of regulation, the policymaker takes each firm's contribution schedule, s i( ⋅ ) and s j( ⋅ ), as fixed and chooses the optimal r, setting the marginal benefit of increasing regulation equal to its marginal cost. Rearranging the policymaker's first-order condition yields
 $$r^\ast{=\;} r^{PM} + \displaystyle{{1-\lambda } \over {2\lambda }}\left({{\left. {\displaystyle{{ds_1\lpar r\rpar } \over {dr}}} \right\vert }_{r^\ast } + {\left. {\displaystyle{{ds_2\lpar r^\ast \rpar } \over {dr}}} \right\vert }_{r^\ast }} \right)$$
This expression makes clear that equilibrium regulation depends not on the absolute level of political contributions but rather the marginal contribution from each firm. Recall that, given the assumption of truthful contribution schedules, firm contributions are such that they receive the same level of utility given policy choice r* as for any r′ ≠ r*. This implies that any change in profits brought about by a shift in policy must be exactly offset by a corresponding change in the firm's expenditure on lobbying. Since each firm's marginal value for money is constant (and equal to 1) this in turn implies that any change in profits must be offset by an identical and opposite change in the firm's contribution. For small deviations from the equilibrium policy, it must then be the case that firms’ marginal contributions in equilibrium are exactly equal to their marginal change in profits. Evaluating the required derivatives and rearranging (5) yields the equilibrium policy. Recalling that the policy must lie in the interval [0, R], the equilibrium policy is
 $$r^\ast{=} \min \left\{{\max \left\{{\displaystyle{{r^{PM} + \alpha \beta \lpar \gamma_i + \gamma_j\rpar } \over {1-\beta \lpar \gamma_i^2 + \gamma_j^2 \rpar }}\comma \;0} \right\}\comma \;R} \right\}$$
where  $\beta \equiv {1 \over 9}\cdot {{1-\lambda } \over \lambda }$ is a measure of the weight the policymaker assigns to campaign contributions versus her own policy preferences. Assumption A1 ensures that the derived expression for r* is a global maximum of the policymaker's utility on the feasible set of policies. Note that $\gamma _i + \gamma _j ={-}\left({{1 \over {F_i}} + {1 \over {F_j}}} \right)$, or the marginal cost of regulation for the economy as a whole. Thus in the case of an interior solution, the numerator in equation (9) is strictly decreasing in the average marginal costs of regulation. In contrast, the denominator is decreasing in the distance between firms’ adjustment costs. Equilibrium regulation then depends both on average and relative adjustment costs.
Finally we consider firms’ optimal contribution schedules. Recall that in any Truthful Nash Equilibrium firms’ contribution schedules must be truthful relative to the policy, r*. This implies that contribution schedules will take the following form:
 $$s_i\lpar r\rpar = \pi _i\lpar r\rpar -\pi _i\lpar r^\ast \rpar + s_i\lpar r^\ast \rpar $$
The schedule is completely pinned down by firm i's equilibrium contribution, s i(r*). All that remains then is to calculate this contribution. We have already characterized equilibrium regulation, r*. Using a similar approach we can characterize the equilibrium outcome if firm i chooses not to contribute, r j. If firm i chooses not to contribute then the policymaker attains utility g(r j). Taking into account i's equilibrium contribution, the policymaker attains utility g(r*). Given that the policymaker can achieve g(r j) by ignoring firm i and choosing r j, it must be that if she chooses r* in equilibrium, she is at least as well off. Firm i never optimally provides a greater contribution than what is strictly required to induce r* thus the equilibrium contribution is that which yields exactly g(r j) = g(r*). Plugging firm j's contribution schedule (defined similarly to (7)) into the policymaker's indifference condition establishes firm i's equilibrium contribution. Figure 5 depicts the construction of the equilibrium.

Figure 5. Equilibrium contributions
Note that this condition pins down the vertical placement of each firm's contribution schedule. Neither firm has an incentive to shift the schedule upward: doing so does not alter the equilibrium policy choice—provided that the marginal contribution remains unchanged—but simply transfers utility from the firm to the policymaker. At the same time neither firm would choose to lower its contribution schedule since doing so would reduce the policymaker's equilibrium utility, yielding a profitable deviation to either of the reservation values r i or r j. Proposition 1 summarizes the analysis so far.
Proposition 1. There exists a unique (truthful) subgame perfect equilibrium:
(a) In the final stage of the game, firms i = 1, 2 choose production levels:
(8)where $$q_i^\ast{=} \max \left\{{\displaystyle{1 \over 3}\lpar \alpha + r^\ast \gamma_i\rpar \comma \;0} \right\}$$$\gamma _i = {1 \over {F_j}}-{2 \over {F_i}}$.
(b) In the policymaking stage, the legislator selects r* ∈ [0, R] where
(9)and$$r^\ast{=} \min \left\{{\max \left\{{\displaystyle{{r^{PM} + \alpha \beta \lpar \gamma_i + \gamma_j\rpar } \over {1-\beta \lpar \gamma_i^2 + \gamma_j^2 \rpar }}\comma \;0} \right\}\comma \;R} \right\}$$$\beta = {1 \over 9}\cdot {{1-\lambda } \over \lambda }$.(c) Prior to the selection of policy, firms announce contribution schedules:
(10)where$$s_i\lpar r\rpar = \pi _i\lpar r\rpar -\pi _i\lpar r^\ast \rpar + s_i\lpar r^\ast \rpar $$$s_i\lpar {r^\ast } \rpar = \max \left\{{{\lambda \over {1-\lambda }}\lsqb {} {\lpar {r^{PM}-r^\ast } \rpar }^2-{\lpar {r^{PM}-r^j} \rpar }^2\rsqb + \pi_j\lpar {r^j} \rpar -\pi_j\lpar {r^\ast } \rpar \comma \;0} \right\}$.


The proof of Proposition 1 (along with those of all other results) is included in Appendix A. Note that in any equilibrium, firm i offers higher contributions in exchange for policies that improve its welfare, relative to r*, and lower contributions (or 0) for policies that leave it worse off. From here on we say that firm i lobbies in favor of regulation if s i(r) > s i(r*) for all r ∈ (r*, r* + ϵ) and firm i lobbies against regulation if s i(r) > s i(r*) for all r ∈ (r* − ϵ, r*) for ϵ greater than 0.
The Emergence of Green Lobbying
My central claim is that relatively low-cost firms lobby in favor of climate change regulation to gain market share at the expense of high-cost competitors.Footnote 38 The next proposition establishes this core result.
Proposition 2. Let γi > 0. Then firm i lobbies in favor of climate change legislation while j lobbies against.
The intuition behind Proposition 2 is as follows. When γ i is greater than 0, firm i's profits are strictly increasing in regulation. It is then optimal for firm i to offer greater contributions for higher levels of regulation in equilibrium. Recall that γ i > 0 requires F i > 2F j, that is, firm i holds twice the level of green capital as firm j. Thus competitive lobbying emerges only if there exists significant heterogeneity in adjustment costs. This reflects the fact that climate change legislation has both a direct and an indirect effect on firm profits. The direct effect of regulation is that of increasing each firm's production cost. The indirect effect is that of shifting market share toward the low-cost firm. If firms are relatively close in terms of their adjustment costs, the former will dominate the latter since the shift in market share must be small. As heterogeneity in adjustment cost grows, the impact of regulation on market share grows, eventually overtaking the direct effect of increasing costs. From here on I refer to any equilibrium in which one firm lobbies in favor of climate change regulation as a “competitive equilibrium.”
To provide support for this core result I construct a measure of individual firm support for the ACES by comparing lobbying activity reported under the Federal Lobbying Disclosure Act with public statements of support for H.R.2454.Footnote 39 Firms that both disclose lobbying activity and take a public stance in favor of the climate change bill are coded as supportive. Information on lobbying disclosures is obtained from the Center for Responsive Politics. I construct a measure of anticipated competitor costs by calculating for each firm i (1) the share of competitors within industry j located in zip codes above the median in terms of coal usage in electricity generation and (2) the share of competitors in industry j located in zip codes containing coal reserves.Footnote 40 The resulting measures vary both within industry and within region, reflecting firm i's own location relative to the geographic distribution of its competitors.
The full sample consists of all US-based publicly traded firms whether or not they disclose lobbying activity.Footnote 41 Data on publicly traded firms as well as a number of financial covariates are obtained from the Osiris database. In total I identify 8,216 unique firms representing 276 industries.Footnote 42 Key financial covariates include property, plant, and equipment, market capital, productivity, and market share.Footnote 43 I also include indicator variables that take a value of 1 if a firm is located in a zip code with high anticipated costs, if the firm is a multinational, if the firm is engaged in energy-intensive manufacturing, or if the firm itself is an electricity provider.Footnote 44
Results from logistic regression confirm the existence of a positive and statistically significant relationship between the measures of competitor adjustment costs and a firm's propensity to lobby in favor of cap-and-trade legislation. Figure 6 depicts the marginal effects for an average firm estimated by regressing both measures of competitor costs on supportive lobbying and controlling for a range of firm-level characteristics. The estimated effects are substantively meaningful. Moving from the mean to one standard deviation above the mean for either independent variable increases the probability of lobbying in favor of climate change legislation by around 70 percent when compared with the observed base rate of lobbying.Footnote 45 Although these estimates are purely correlational and should be interpreted with care, they are suggestive of exactly the relationship between firm competition and political behavior described earlier in the formal model. Appendix B1 contains the full results of both models along with additional results confirming the robustness of the findings.Footnote 46

Figure 6. Marginal effects of key variables for an average firm
Before moving to the analysis of an open economy setting I briefly note two additional results. Let F i > 2F j so that γ i > 0. One question with implications for the design of climate change regulation is how increasing or decreasing heterogeneity in adjustment costs would affect equilibrium policymaking. As noted earlier equilibrium regulation depends on both average and relative marginal costs of regulation. These two quantities are closely linked. Suppose that γ i > 0 so that firm i has lower adjustment costs than firm j. Increasing F i has the dual effect of decreasing average adjustment costs and increasing firm heterogeneity. Both of these effects tend to increase equilibrium regulation. Thus in this case a decrease in average adjustment costs is associated with a higher level of regulation.
Consider instead a decrease in the adjustment costs for firm j. Again this has the effect of lowering average costs of regulation. This should lead to a higher level of equilibrium regulation, all else equal. Yet increasing F j also has implications for firm heterogeneity: by decreasing the distance between firms’ adjustment costs, an increase in F j reduces firm i's incentive to lobby in favor of climate change legislation. This exerts a countervailing effect on equilibrium regulation. The overall effect of increasing F j then depends on the relative strength of these two dynamics. Proposition 3 establishes that in some cases the latter may outweigh the former: increasing F j reduces average adjustment costs, yet leads to strictly lower equilibrium regulation.
Proposition 3. There exists a competitive equilibrium in which regulation is strictly decreasing in the less competitive firm's green capital.
Proposition 3 suggests that the allocation of free permits or other subsidy-like aspects to climate change regulation can have significant implications for the emergence of private sector support. These measures are often seen as key to the political success of climate change legislation. The result takes on particular significance in the context of international negotiations in which climate finance has traditionally played a central role. A key achievement of the Paris Agreement is the commitment by developed countries to provide around USD 100 billion annually in funds to assist developing countries in mitigation and adaptation. Figure 7 depicts the distribution of climate finance already disbursed at the time of Paris negotiations. Proposition 3 suggests that the allocation of these funds within developing countries’ domestic economies will have significant implications for the balance of support or opposition for climate change commitments in the developing world.

Figure 7. OECD climate finance, 2002–2016 (in millions USD)
The final result establishes an important connection between policymakers’ ideology and firms’ propensity to support climate change legislation and adds additional support to the empirical plausibility of the model. Earlier I described several examples of firm lobbying in favor of climate change legislation. Yet as noted the emergence of green lobbying, at least in the United States, represents a relatively new phenomenon. Proposition 4 provides insight into the emergence of this phenomenon, establishing a relationship between the policymaker's own preference and the emergence of green lobbying.
Proposition 4. Consider a sequence of ideal points  $\lcub {r_n^{PM} } \rcub _{n\in N}$converging to 0. There exists a corresponding sequence of competitive equilibria in which (i) equilibrium regulation converges to 0, (ii) firm i's equilibrium contribution converges to 0, and (iii) firm j's equilibrium contribution is bounded strictly away from 0.
Recall that in selecting a level of regulation the policymaker balances his own preferred policy against the preferred policy of the firms providing campaign contributions. In equilibrium the policymaker equates his marginal loss from selecting a policy other than his (ideologically driven) ideal point with the marginal gain in campaign contributions accruing from the two firms. The marginal change in campaign contributions is given by the sum of the marginal changes in firm profitability given contribution schedules that are locally truthful.
Proposition 4 applies when this aggregate change in firms’ profitability is strictly negative.Footnote 47 Since regulation increases costs of production and thus prices for consumers, it reduces overall firm profitability. For a positive level of regulation to prevail it must be the case that the policymaker has a positive marginal value for regulation, offsetting these economic losses. The surprising result related to firm lobbying is that even when the policymaker holds no value for regulation, the antiregulation firm must still offer contributions to deter lobbying from green firms that might otherwise—in isolation—induce a skeptical policymaker to depart from his ideal policy of 0 and implement a positive level of regulation.Footnote 48
To illustrate the logic of this result, consider firm lobbying on climate change policy during the Bush administration, the vast majority of which was carried out exclusively by firms opposed to US participation in the Kyoto Protocol. One oil industry group, the Global Climate Coalition (GCC) was particularly instrumental in the administration's decision to withdraw from the treaty. As noted in official documents released under a Freedom of Information Act (FOIA) request, Paula Dobriansky, then US under-secretary of state, is noted as thanking the GCC for its “active involvement” and confirming that “Potus rejected Kyoto in part based on input from you.”Footnote 49
This was the case despite the administration's own predisposition against climate change regulation. Climate and energy policy fell under the portfolio of then Vice President Dick Cheney, a notorious opponent of climate change policy.Footnote 50 Cheney appointed Jim Connaughton as chairman of the Council on Environmental Quality who made it his mission to obstruct any progress on climate change regulation, even appointing a former employee of the American Petroleum Institute (one of the core founders of the GCC) as his top deputy. While utilities companies and other manufacturers were also outspoken in their opposition to climate change policy there is no evidence of significant counter-vailing pressure from supportive firms, consistent with the predictions of Proposition 4.Footnote 51
Green Lobbying in an Open Economy
Trade Openness
Here I consider the implications of green lobbying in an open economy setting.Footnote 52 First I consider the case of import competition. Because foreign firms produce abroad, they are not subject to national regulation. Yet they may sell in the domestic market, potentially undercutting those firms whose costs are affected by regulatory choices. Let there be a set of domestic firms  ${\cal M}$ where $\vert {\cal M} \vert = M \gt 1$. Suppose there are a total of N firms competing in the market, implying that N − M of these are foreign competitors. Domestic firms have marginal cost of production as above with green capital F i for each $i\in {\cal M}$. Production costs of importers are unaffected by the level of regulation in the economy, but they face a symmetric per-unit transportation cost, τ > 0.Footnote 53 Each active firm announces contribution schedule s i:ℝ+ → ℝ+ and selects a level of output q i. Again, I assume that α is sufficiently large that all incumbent firms choose to continue production even under the most stringent possible regulatory outcome.Footnote 54 All other aspects of the game remain as before.
By increasing marginal production costs for domestic firms only, climate change regulation clearly worsens these firms’ competitive position relative to foreign competitors. Nonetheless, as the next result establishes, domestic firms may continue to support higher levels of climate change regulation. Denote by  $F_{{-}i}^M $ the harmonic mean of green capital among firm i's domestic competitors, $j\in {\cal M}\backslash i$.Footnote 55
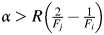
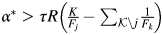
Proposition 5. Domestic firm i lobbies in favor of climate change regulation if and only if  $F_i \ge {N \over {M-1}}F_{{-}i}^M $.
Proposition 5 establishes the robustness of green lobbying to the presence of import competition. Moreover it highlights the relative importance of domestic versus foreign competitors in shaping firm preferences. The right-hand side of Proposition 5 consists of two components. The first corresponds to the (inverse) proportion of firm i's competitors subject to domestic regulation. The second term describes the distribution of green capital among these domestic competitors. Firm i's support for climate change regulation depends not only on the relative market share of foreign firms but also its competitiveness with respect to the domestic firms.
The case of export competition differs from that of import competition in that exporting firms now compete with their domestic competitors both at home and in some cases abroad in the foreign market. Again, foreign firms themselves will be unaffected by domestic climate change regulation. Yet climate change regulation will shift the market share of domestic firms both at home and abroad. Again denote the set of domestic firms  ${\cal M}$ with $\vert {\cal M} \vert = M$. An exogenously given subset of these firms, ${\cal K}$, also engages in export to a single foreign market, where $\vert {\cal K} \vert = K \gt 1$. Let the set of foreign incumbent firms in that market be ${\cal J}$ with $\vert {\cal J} \vert = J$. Inverse demand in the foreign market is given by $p\lpar {\bi q} \rpar = {\alpha^\ast} {-}\mathop \sum \nolimits_{j\in {\cal J}}q_j-\mathop \sum \nolimits_{k\in {\cal K}}q_k$.Footnote 56 The marginal production cost of foreign firms is constant and given by ϕ > 0. Thus foreign production costs are independent of the level of domestic regulation and symmetric across firms.
Exporting firms incur higher variable costs in serving the foreign market relative to the domestic market. This additional cost may stem from transportation goods, trade policy in the destination country, or increased frictions of operating in a foreign market. The cost to domestic firms of exporting q j units is  ${{r\tau } \over {F_i}}\cdot q_j$ where τ > 1. Production costs and competition in the domestic market—as well as all other features of the game—remain the same. Domestic firm profits are now given by the sum of profits in the domestic market, $\pi _i^d $, and in the export market, $\pi _i^e $.
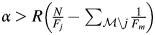
Note that higher levels of climate change regulation will necessarily decrease the collective market share of exporting firms in the foreign market given their now higher marginal costs across the board. Nonetheless the next result establishes that individual exporters may still benefit from higher levels of regulation. Even where this does not occur, gains in the domestic market may continue to compensate exporting firms for competitive losses in the export market. Let  $F_{{-}i}^K $ denote the harmonic mean of green capital among firm i's export competitors and assume that $F_{{-}i}^K \gt F_{{-}i}^M $.Footnote 57
Proposition 6. For any  $i\in {\cal K}$
1. Export profits are increasing in r if and only if
$F_i \ge {{J + K} \over {K-1}}F_{{-}i}^K $.2. Firm i lobbies in favor of climate change regulation if and only if
$F_i \ge F_i^\ast $for some $F_i^\ast{\in} \lpar {F_{{-}i}^M \comma \;F_{{-}i}^K } \rpar $.


The first part of Proposition 6 establishes that increases in climate change regulation may increase not only domestic profits but also export profits for firms with high levels of green capital relative to other exporters. Similar to the case of import penetration, if these shifts in market share are sufficiently large they may compensate exporting firms for losses relative to foreign competitors. The second part of Proposition 6 establishes that exporting firms may support climate change regulation, even where the first condition does not hold. If firm i's advantage in terms of green capital is sufficiently large relative to its domestic competitors, then gains in the domestic market can offset overall losses in the export market. In this case, exporting firms’ incentives to support climate change regulation reflect both the market share of domestic firms abroad as well as the distribution of green capital with respect to exporting firms,  ${\cal K}$, and the full population of domestic firms, ${\cal M}$.
Figure 8 explores the interaction of competitor costs and trade exposure empirically by adding an interaction term to the model, the results of which are depicted in Figure 6. Panel (a) depicts the estimated effect of competitor costs conditional on import penetration. The association between competitor costs and the probability of supporting climate change legislation remains relatively stable up through the eightieth percentile by (logged) import penetration. Following this the correlation is significantly attenuated. Panel (b) depicts the same, but including separate estimates for firms that are both trade exposed and energy intensive. For these firms, there is little association between competitor concerns and supportive lobbying, perhaps reflecting these firms’ overall propensity to lobby in favor, given the special provisions for them included in the final legislation.

Figure 8. The moderating effects of foreign competition
Panels (c) and (d) again depict the estimated effect of competitor costs, conditional on (logged) exports. I employ carbon intensity and coal reserves respectively as alternative measures of competitor costs. In these cases while higher levels of (logged) exports similarly lead to attenuation, the effect is smoother and less dramatic than in the case of imports. While the statistical tests are inconclusive—the moderating effects depicted in either case are not statistically significant—descriptively the patterns revealed in the data are consistent with the idea that supportive lobbying depends on both the relative share of foreign versus domestic competitors and each firm's competitive position relative to the domestic industry.Footnote 58
Vertical Integration and Outsourcing
Next I develop a model of green lobbying in the presence of global value chains.Footnote 59 Let firms i ∈ {1, 2} produce good q i using an intermediate input m i and headquarter services h i. I assume that firm 1 purchases the intermediate good abroad either via outsourcing (O) or vertical integration (V). Firm 2 purchases the intermediate good domestically, again either via outsourcing or vertical integration. Denote each firm's organizational structure by k i ∈ {V, O}. The marginal cost of the intermediate good differs according to its production location. If the intermediate good is produced at home its marginal cost is rϕ for some ϕ > 0 whether production takes place internally (k 2 = V ) or externally (k 2 = O). If the intermediate good is produced abroad its marginal cost is ϕ* again regardless of organizational structure.Footnote 60 In either case a firm purchasing the intermediate good abroad also pays per unit transportation cost τ > 0. Let θ > 0 be the (symmetric) cost of headquarter services.
Production is Cobb-Douglas and given by
 $$q_i\lpar {h_i\comma \;m_i} \rpar = A_i\left({\displaystyle{{h_i} \over \eta }} \right)^\eta \left({\displaystyle{{m_i} \over {1-\eta }}} \right)^{1-\eta }$$
where A i > 0 is each firm's overall productivity and η > 0 is the output elasticity of headquarter services. To emphasize the role of organizational structure and sourcing decisions as opposed to innate differences in productivity I normalize A 1 = A 2 = 1. Each firm simultaneously chooses how much of the intermediate good m i to purchase (or produce in the case of vertical integration) and final output levels q i.Footnote 61
Neither firm can write enforceable ex ante contracts with independent intermediate goods producers but instead bargain over ex post profits. In the case of vertical integration profits are determined again by ex post bargaining between headquarters and its subsidiary. As a result of bargaining firm i retains share, S k, of total profits for k ∈ {V, O}.Footnote 62 Vertical integration implies greater bargaining power on the part of headquarters via a residual claim on the subsidiary's production of the intermediate good.Footnote 63 Thus I assume S V > S O. Proposition 7 establishes the core result in the model with differential sourcing.
Proposition 7. Firm 1 lobbies in favor of climate change regulation regardless of its organizational structure while firm 2 lobbies against. Both firms lobby more intensively under vertical integration than under outsourcing.
As in the case of import competition, firm 1's production is unaffected by the domestic level of regulation while firm 2 is adversely affected. Firm 1 enjoys gains in market share from increases in regulation without incurring any additional costs providing clear incentive to support climate change regulation for competitive reasons. Firm 2 by contrast loses out both from direct increases in its operating costs and erosion of its competitive position relative to firm 1. Moreover, as vertically integrated firms enjoy a greater share of operating profits they exhibit greater preference intensity than their counterparts who source externally.
This last result suggests an alternative explanation for the observed activism of multinational corporations (by nature vertically integrated) on climate change policy. While there is already a broad consensus in the literature that multinational corporations are more likely to support climate change legislation, the mechanism advanced here is very different than the conventional wisdom.Footnote 64 Vertically integrated firms may gain from regulatory divergence if regulation increases the costs of their competitors’ intermediate goods.
Evidence for this particular mechanism can be found by comparing the lobbying of multinational corporations engaged in final goods production with those engaged in other stages of production. Proposition 7 suggests that multinationals should exhibit greater preference intensity for climate change regulation in markets where they engage in final goods production. While some domestic firms engaged in outsourcing may also prefer higher levels of climate change regulation, the intensity of these preferences will be lower and, furthermore, diluted in the data by domestic firms engaged in final goods production but reliant on domestic and therefore higher expected intermediate goods prices.
Again building on my analysis, I provide statistical evidence consistent with this prediction in Figure 9. The figure depicts the predicted probability of lobbying by both multinational and domestic firms by production stage. I obtained these estimates by interacting MNC status with an indicator for final goods production employing the same lobbying data and covariates described in Figure 6. The measure of final goods production is based on industry and defined according to the UN Broad Economic Categories (BEC).Footnote 65 The mean predicted probability of lobbying by multinationals is higher for those engaged in final goods production, and the difference in the two means is statistically significant at the 0.01 level. This suggests that the widespread finding that MNC's are more likely to lobby in favor of climate change may in part be driven by firms engaged in final goods production and thus unlikely to be subject to regulations affecting earlier, more energy-intensive production stages.Footnote 66

Figure 9. Moderating effects of production stage
Conclusion
Why do some firms support national climate change regulation despite its economic costs? Firms’ embrace of environmental regulation is all the more puzzling in a globalized economy where national regulation may undermine domestic firms’ competitiveness relative to foreign competitors and where differences in cross-national regulatory regimes increase transaction costs for multinational corporations operating across state lines. I argue that firms support climate change legislation to gain advantage over domestic market competitors and that these gains may even offset competitive losses relative to foreign firms. In a closed economy model of policymaking and market competition I show that firms holding an advantage in adjustment costs may see increased profits following the introduction of carbon regulation and thus find it optimal to invest resources in lobbying in support of the new regime. This conclusion is supported by statistical analysis of firms’ lobbying in favor of US climate change legislation.
These same intuitions carry over to an open economy setting where firms facing import penetration—or engaged in export competition—may find it optimal to support climate change regulation despite competitive losses relative to foreign firms. Willingness to do so in either case depends on the relative market share (at home or abroad) of domestic competitors as well as the distribution of green capital among those competitors. Contrary to existing literature, the analysis demonstrates that the impact of foreign competition on firm preferences for climate change policy depends on competitive dynamics in the domestic market. Finally in the context of global value chains I show that multinational corporations are more likely to support efforts to mitigate global climate change if those efforts raise the costs of domestically produced intermediate goods, providing an alternative to the conventional wisdom that MNCs support climate change regulation in order to bring about harmonization of national policies. Statistical analysis of multinational lobbying behavior provides support for this prediction.
The arguments and empirical evidence I've presented have implications for the domestic political economy of climate change, the environmental effects of open borders, and the study of firms in international cooperation. Existing accounts of firm support for climate change regulation rely on idiosyncratic features of regulatory design or the sequencing of regulation across countries. The benchmark results provide a more general explanation for the emergence of support for climate change legislation. Competition between domestic firms is a sufficient condition for supportive lobbying in nearly any regulatory context. Given the obstructionist policies of the United States, the substantive implications of this argument suggest that pressure for climate change regulation need not rely on leadership by the world's remaining super power, but can arise endogenously as a result of competitive dynamics between firms.
Turning to the perennial question of how globalization affects environmental welfare, my arguments suggest that the overall effect is more complex than has been appreciated thus far. Open borders do not necessarily dampen support for climate change policy and in some cases may provide special impetus for firms to come out in favor of national regulations. The equilibrium effect of open borders on climate change policy depends heavily on the location of various stages of production around the world and the design of global value chains. US domestic regulation may be undermined by carbon leakage, yet carbon leakage may also increase the likelihood of passing climate change legislation in one of the world's largest emitters of carbon dioxide.
Finally, the current work builds on existing models of open economy politics by incorporating insights from the growing literature on intra-industry heterogeneity. In spite of recent advances in the field in firm-level analysis of policy preferences, existing work in this area has yet to appreciate the importance of intra-industry variation with respect to domestic competitors.Footnote 67 The arguments here show that firm preferences for international cooperation will be shaped by their competitive position with respect to both domestic and foreign competitors. Analyses that ignore these considerations may systematically misclassify the winners and losers from cooperation. Future work could explore the implications of these arguments for other policy areas with implications for competition across borders.
Data Availability Statement
Replication files for this article may be found at <https://doi.org/10.7910/DVN/26HDEO>.
Supplementary Material
Supplementary material for this article is available at <https://doi.org/10.1017/S0020818320000107>.
Acknowledgments
For helpful comments and suggestions I thank Helen Milner, Matias Iaryczower, Kris Ramsay, Eric Arias, Felipe Balcazar, Lawrence Broz, Ryan Brutger, Ted Enamorado, Germán Gieczewski, Bob Keohane, James Lee, Melissa Lee, John Londregan, Julia Morse, David Stasavage, Saurabh Pant, Tyler Pratt, Yuki Shiraito, Sondre Solstad, and B. Peter Rosendorff.