


Introduction
Young sea ice plays a very important role in the surface heat and mass balance of the arctic ocean. this ice is formed, for example, due to the divergence of wind stress which continually produces cracks in the perennial sea-ice cover, known as leads. these transient fissures attract scientific attention because they provide a thermal conduit through which heat- and radiative-transfer processes are enhanced tremendously, relative to the thick pack ice that surrounds them. the thermal importance of leads was put in context by Reference Badgley and FletcherBadgley (1966), who showed that during winter the atmospheric heat flux from rapidly freezing leads can be several orders of magnitude larger than over perennial sea ice. he emphasized the large-scale implications of leads by arguing that they need occupy only 1% of the area of the ice cover in order to dominate the heat exchange from the ocean to the atmosphere. in the arctic winter, the relatively warm water in leads is exposed to the cold air above it. a thin veneer of ice rapidly forms across an exposed lead. after 1 day’s growth, the ice layer is about 10cm deep, which is still thin compared with the surrounding ice, which is typically several metres thick. the field observations (Reference ScheilThe leadex group, 1993) show that the heat loss through leads can be up to 300wm–2, or 15 times that from the surrounding ice. we consider the initial formation of ice in leads and its growth during the first few days. contrary to the theory developed by Reference WorsterWettlaufer and others (2000), which is based on the balance approaches and phenomenological considerations, and other papers on this subject, our theory uses as a source the classical mushy (skeletal)-layer theory modified by reasonable and verified physical hypotheses. the analyticity and explicit form of all dynamic dependencies, obtained from the non-linear equations of a mushy layer, is the main feature of our approach. a detailed description of the scientific program and observations has been given by Reference ScheilThe leadex group (1993) and Reference WorsterWettlaufer and others (2000). we will not dwell on this point in detail. however, we will point out the main features of the leadex experiment field campaign. there were four main lead deployments during the 6 week experiment. a particularly interesting deployment is ‘lead 3’ which was the largest (approximately 1 km wide) lead. deployment at lead 3 began early on the morning of 6 april 1992 and was evacuated 2 days later. we describe observations from both of the buoys that were deployed late on the afternoon of 6 april 1992 (buoy 5 was deployed ∽2 hours before buoy 6).
At first, for the goals of our theory, we briefly outline the frontal model and discuss its predictions about sea-ice dynamics.
Frontal Approach
Let us now demonstrate how one of the simplest models of the planar front works in practice. the system under consideration is shown in figure 1a: ice and sea water are divided by the phase transition boundary, h(t), moving downwards in the ocean because the ice surface, z = 0, is cooled with time oscillations. the atmospheric temperature, T s(t), determined at z =0, will be regarded as experimentally known. now, we treat the process as fully thermally controlled. on this basis, the heat transfer process is described by the local conservation of heat within the sea ice
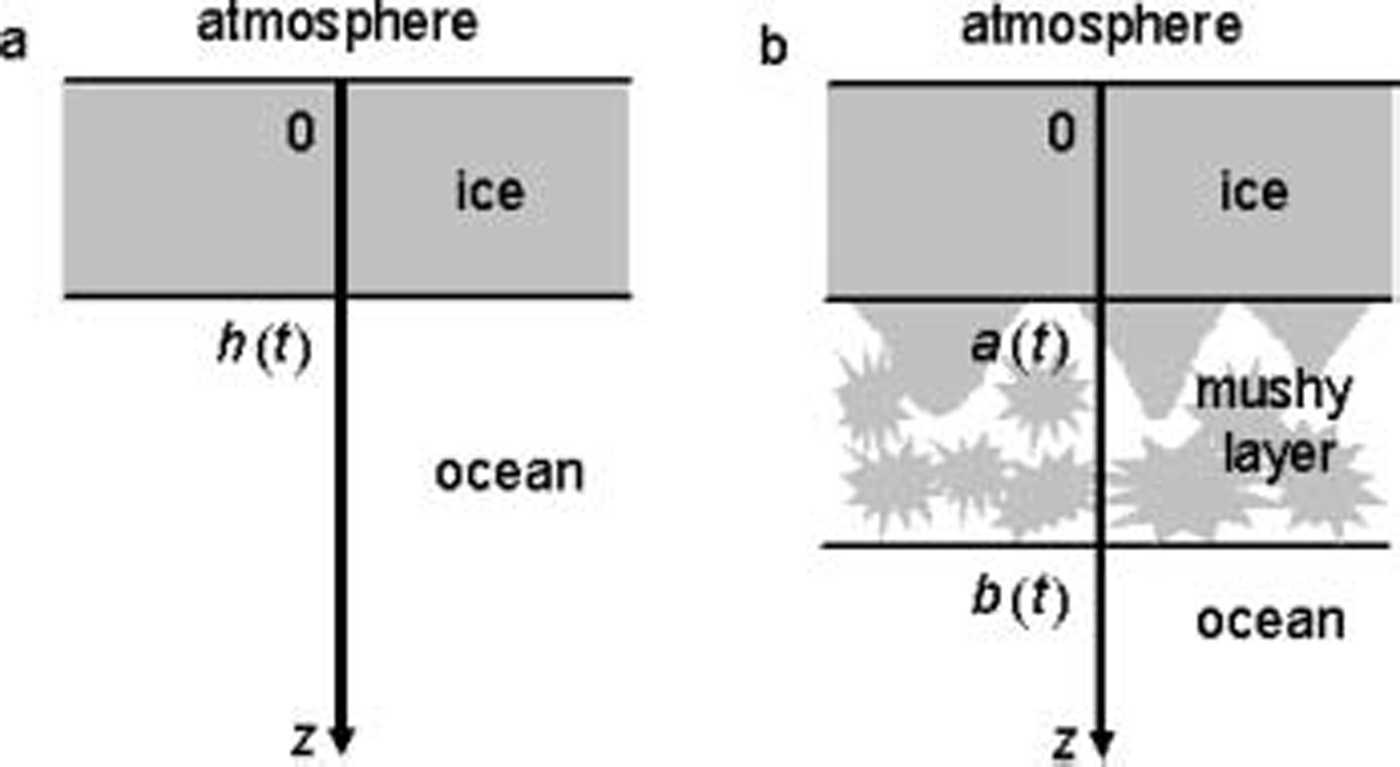
Fig. 1. A scheme illustrating the models under consideration: (a) planar front and (b) mushy layer.
Supplemented by the stefan condition (a heat balance) at the planar interface, which is
Where Ti is the temperature, L
V is the latent heat released as the ice fraction increases, k
i is the thermal conductivity, ρ
i is the density and c
i is the specific heat capacity of the sea ice. the ocean is treated as isothermal, which is to say that the temperature field T
o = constant, for z ≥ h(t). analyzing experimental curves (see fig. 2), we conclude that the temperature distribution in the young sea ice can be regarded as a nearly linear function of the spatial coordinate z. from the physical point of view, this means that the temperatures at different depths undergo near-self-similar change (fig. 2b and d), with small variations from full self-similarity. from the mathematical point of view, this means that equation (1) takes the form ![]() this is because the temperature relaxation time is many times less than a characteristic time of the front motion. taking into account the latter, we arrive at the linear temperature profile within the sea ice
this is because the temperature relaxation time is many times less than a characteristic time of the front motion. taking into account the latter, we arrive at the linear temperature profile within the sea ice
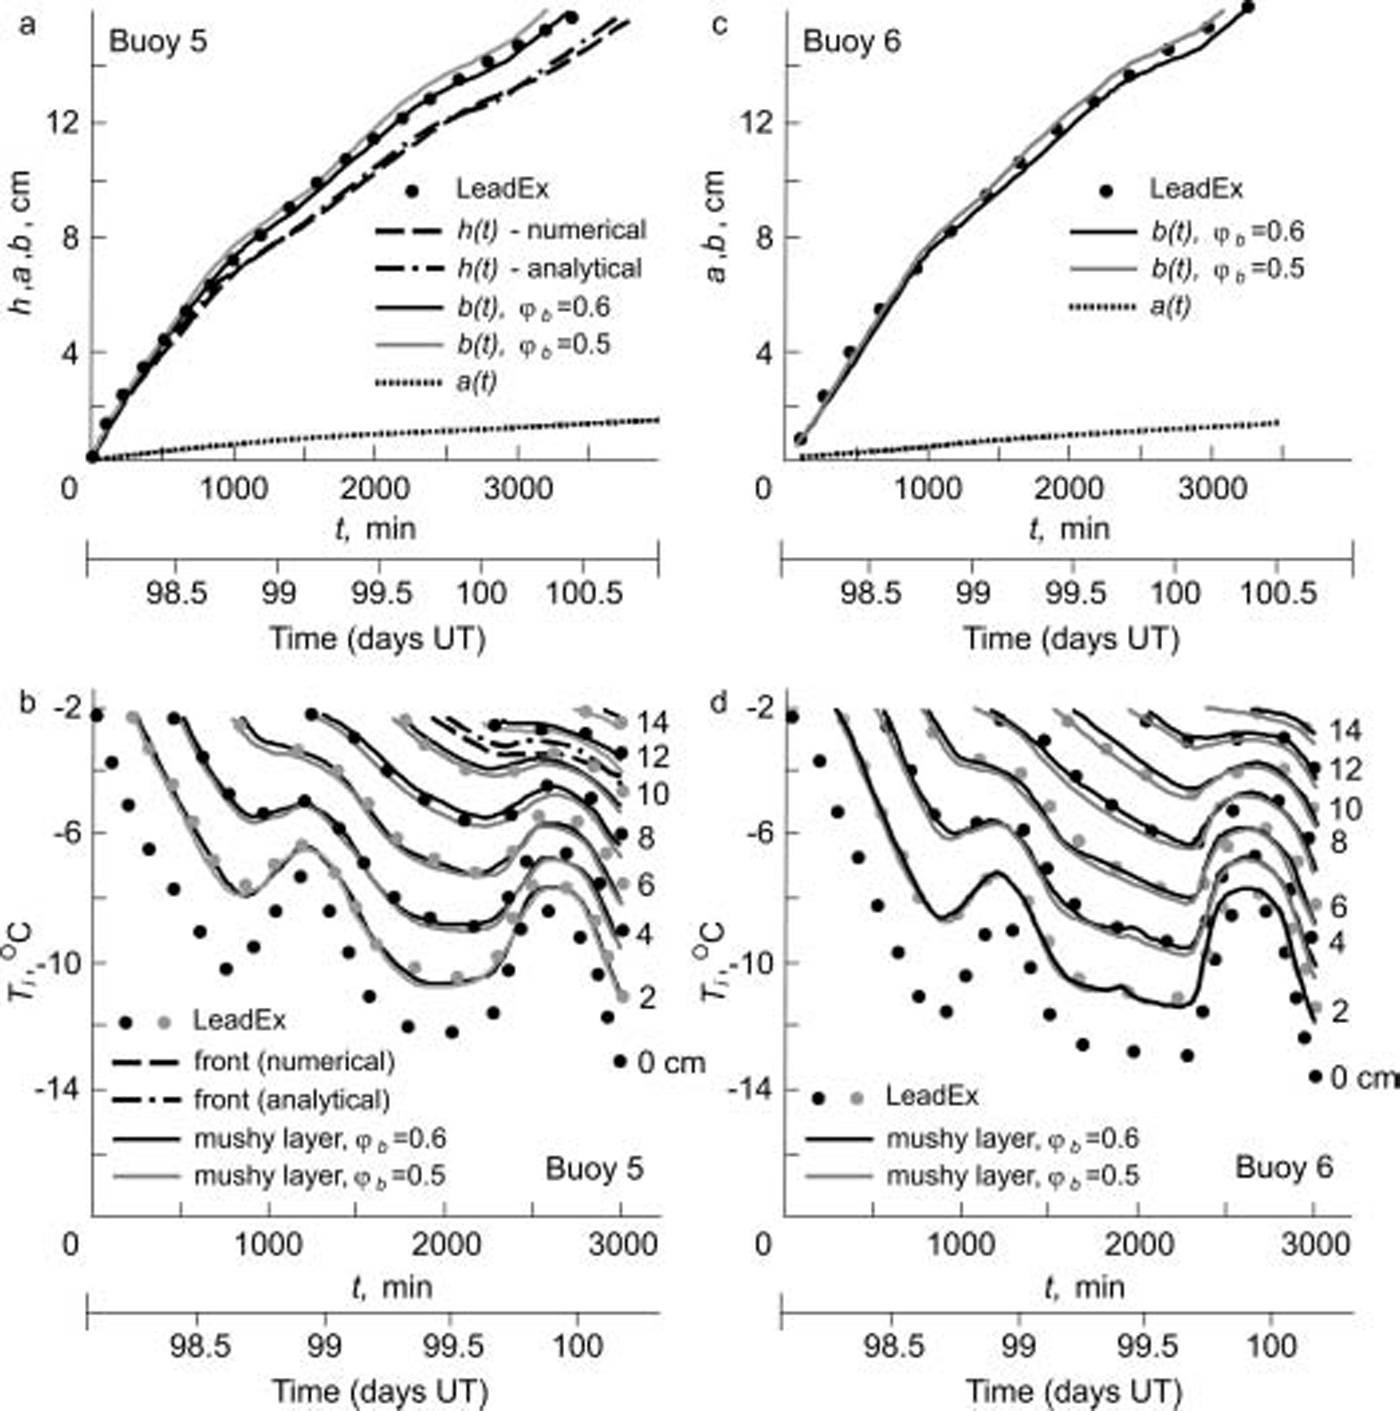
Fig. 2. Time series of ice thickness and temperature–time traces for (a, b) buoy 5 and (c,d) buoy 6 at lead 3 in accordance with the LeadEx experiment and the theory under consideration. The ice–mushy-layer boundary is a good approximation to the data for φb = 0.5 and φb = 0.6 (these dependencies are shown by means of function a(t)). Numbers at the curves corresponding to each trace designate the depths (expressed in centimeters) measured from the ice/atmosphere interface. The curve at z = 0 cm represents the atmospheric temperature (T s(t)) at the ice surface. The timescale used by the LeadEx investigators is decimal days of 1992, abbreviated as UT. The time origin in minutes corresponds to 0221, day 98 UT. Physical properties used in calculations: T o = –2˚C, L v = 3072 ×105Wsm–3, k i = 2.03Wm–1 ˚C–1, k w = 0.56Wm–1 ˚C–1, D w = 1.2×10⁻⁹m2 s–1.
The position of the planar sea-ice–ocean interface is found from condition (2), namely
Where the initial condition of the form h(0) = 0 is taken into account.
Time series of ice thickness and temperature–time traces in accordance with expressions (3) and (4) are shown in figure 2a and b for buoy 5 by the dash-dotted lines. it is easily seen that this frontal solution rather poorly describes experimental data (this line is drawn only for z = 10cm in fig. 2b). to test the validity of expressions (3) and (4) (instead of the partial differential equation (1) with corresponding boundary conditions) we demonstrate our numerical solution of expressions (1) and (2) by the dashed curves in figure 2a and b. one can readily see that the dashed and dash-dotted curves coincide very closely, whereas, as before, the curves obtained numerically and experimentally are widely spaced.
Further, if we forget for a minute that the temperature T o is constant, that is, if we consider it as a free time-dependent parameter, we conclude that an increase in the absolute value of T o decreases the calculated h(t) for each fixed t, i.e. the front positions, obtained from expression (4), moving h(t) further from experimental data. on the other hand, the temperature profiles T i(z,t), obtained from expression (3) for fixed z, approach experimental data for this same increase in jToj. decreasing the absolute value of T o leads to the opposite conclusions. it immediately follows that variations in the temperature T o cannot reconcile theory and observations, or, in other words, the frontal theory does not adequately describe experimental data. this is apparently due to the fact that the clear dividing boundary ‘sea-ice–ocean’ of the phase transition does not exist in natural conditions. in other words, the phase transition occurs in a layer, filled with the liquid and solid material, which is ahead of the purely sea ice. such a layer is considered below. for now, let us emphasize that the linear temperature profile (3) is in good agreement with the frontal model, and perhaps this profile describes most initial stages of the process.
Mushy Layer
Mushy layers are regions of mixed phase (solid and liquid) in which the solid forms a rigid matrix and the liquid fills its interstices. we model the process under consideration by a thermodynamically equilibrium mushy layer (see, e.g., Reference Buyevich, Alexandrov and MansurovBuyevich and others, 2001). we consider a semi-infinite region (z > 0) filled with the young sea ice (0 < z < a(t)), the mushy layer (a(t) < z < b(t)) and the ocean (z > b(t)). here a(t) and b(t) represent the sea-ice/mushy-layer and mushy-layer/ocean-phase transition boundaries (fig. 1b). as before, our analysis is based on the assumption of a linear temperature profile in the sea ice with respect to the spatial coordinate, i.e.
Where C 1(t) is a time-dependent function. this expression is based on observations by Reference ScheilThe leadex group (1993) (see also Reference WorsterWettlaufer and others, 2000) and aforementioned discussions.
By analogy, by reason of self-similarity, the temperature profile within the mushy layer is considered as a linear function of z, i.e.
Where time-dependent functions T 1(t) and T 2(t) are found below (gradients of distributions (5) and (6) are different). from the physical point of view, the temperature linearity means that the relaxation time of the temperature field is not only less than a characteristic time for growth of the mushy layer, but also less than the time of variation of solid fraction in the mushy layer. what is more, the question of why expression (6) approximately satisfies the classical heat-transfer equation
Is discussed below. here φ is the solid fraction, ρ m is the density, c m is the heat capacity and k m is the conductivity of the mushy layer.
The transport of solute takes the form (we use the scheil equation to describe the mass transfer in a mush (Reference Kerr, Woods, Worster and HubbertKerr and others, 1990))
Where C m is the brine salinity (integration gives the scheil formula known in metallurgy). formula (8), which assumes that the salinity of the mushy layer is independent of time, has been frequently applied by a number of investigators (see, e.g., Reference Weeks and LeppärantaScheil, 1942; Reference Kerr, Woods, Worster and HubbertKerr and others, 1990). it is a good approximation for the impurity redistribution during the crystal growth for a wide range of experimental conditions (e.g. Reference FlemingsFlemings, 1974). within the mushy layer the local salinity of the liquid phase and the local temperature are related to one another through the phase diagram for sea ice (e.g. Reference Wettlaufer, Worster and HuppertWeeks, 1994). for the range of salinities used here, the salinity-dependent freezing point is expressed by the linear phase diagram
Where m is the liquidus slope.
The boundary conditions applied at the sea-ice/mushy-layer interface are (Reference WorsterWorster, 1986)
Where ’a = φa(t) is the solid fraction at z = a(t), and k
w and D
w are the thermal conductivity and diffusion coefficient, respectively, of the pure water. the thermal properties of the mush are assumed to be volume-fraction-weighted averages of the properties of the individual phases, so that ![]() (see, e.g., Reference Buyevich and AlexandrovBuyevich and alexandrov, 2005).
(see, e.g., Reference Buyevich and AlexandrovBuyevich and alexandrov, 2005).
Further, we have the boundary conditions imposed at the interface between the mushy layer and the relatively warm isothermal ocean (T o = const.)
Where φb is the solid fraction at z = b(t), and T o is the constant temperature of the sea water determined for z ≥ b(t). it must be emphasized that the mass-balance condition at z = b(t ), analogous to the boundary condition (12), is absent within the framework of our model. this is because some variations in the temperature gradient at z = b(t) on the mush side of the interface (constant temperature in the ocean) lead to corresponding variations in the brine salinity gradient at z = b(t) and, therefore, to variations in the mushy-layer thickness in accordance with the criterion for constitutional supercooling (this condition holds for the mushy layer and its boundaries), which is
Physically, a decrease in the temperature within the oceanic boundary layer causes a crystallization process, which is in progress until the local salinity attains its equilibrium value for a given temperature.
Integrating equation (8) and taking into account expressions (6), (9) and (13), we come to the solid-phase distribution within the mushy layer (a similar form of φ is deduced by Reference WorsterWettlaufer and others, 2000):
Substitution of expressions (5), (6), (9) and (15) into the boundary conditions (10–14) gives
As is seen from expression (16), if we suppose φa = 1, it immediately follows that φb = 1, that is, the mushy layer is entirely filled with the sea ice (frontal model). in view of the fact that we seek an alternative solution (φa 6≠ 1), like factors, 1 – ’a, can be cancelled from both sides of equation (19).
Combining expressions (16), (18) and (20), we find the solid fraction at the ice/mushy-layer interface in the form
Eliminating t2(t) from expressions (19) and (20), we have
In view of the fact that the interfaces move relatively slowly (Reference ScheilThe leadex group, 1993; Reference WorsterWettlaufer and others, 2000), we arrive at the linear differential equation connecting a(t) and b(t) (neglecting the term proportional to (da/dt)(db/dt)). integrating this equation in view of the initial conditions a(0) = b(0) = 0, we get
(a(t)/b(t) = 0.071 for the physical parameters under consideration and φb = 0.5). we choose these initial conditions because a characteristic time of observations (Reference ScheilThe leadex group, 1993) is many times higher than a time of mushy-layer initiation.
Substituting C 1(t) and T 2(t) from expressions (17) and (20) into condition (18), eliminating φa(t) by means of formula (22), we obtain the non-linear differential equation containing functions a(t) and b(t):
Further, substituting the term in square brackets from equation (23) into equation (25), taking into account equation (24), we come to the linear differential equation for b 2(t):
Where
After integration of this equation (b(0) = 0), we find the mushy-layer/ocean interface
Expression (26) shows that the interfaces a(t) and b(t), as would be expected, become self-similar (Reference WorsterWorster, 1986) if the ice surface temperature T s is constant. if the temperature T s undergoes different time variations, the interfaces a(t) and b(t) lie between two self-similar regimes, which correspond to the maximum (T max) and minimum (T min) ice surface temperatures measured in experiments. so, for example, for
The mushy-layer/ocean interface, we have
Thus, the non-linear problem under consideration is solved analytically (explicit form of solutions is given by expressions (5), (6), (9), (15), (17), (20–22), (24) and (26)). let us especially emphasize that the solution depends on one free parameter φb (this value cannot be found in the context of the theory under consideration). the solid fraction φb must be found semi-empirically (when one of the functions found theoretically is compared with experiments). then all of the other functions will be completely known for any depths and times.
We have been interested to compare the mushy-layer theory with the frontal analogue. if we formally put φb = 1 (the mushy layer is entirely filled with the sea ice), it is easy to see that expression (26) transforms to expression (4), φa(t) and φ(z,t) ![]() 1, and T
1(t) and C
1(t) = T
2(t) become T
s(t) and (T
o–T
s(t))/h(t ), respectively. in other words, our analytical solutions for the mushy layer transform to their analogues for the planar front.
1, and T
1(t) and C
1(t) = T
2(t) become T
s(t) and (T
o–T
s(t))/h(t ), respectively. in other words, our analytical solutions for the mushy layer transform to their analogues for the planar front.
figure 2 demonstrates how the theory under consideration agrees with experimental data (see Reference ScheilThe leadex group, 1993; Reference WorsterWettlaufer and others, 2000). the free parameter φb is chosen in such a manner that one of the functions found theoretically would approximate its experimental analogue (it is easily seen from figure 2 that all of the other values found theoretically are in good agreement with observations for this value of φb). all of the curves plotted for two values of φb essentially differ from the frontal solutions and properly describe the solidification dynamics of ice-thickness and temperature fluctuations.
The solid fraction at the sea-ice/mushy-layer interface as a function of time is shown in figure 3. an important point is that φa and ᵠ (φb ≤ φ ≤ φa) undergo only insignificant time and spatial variations (a rapid growth of φ occurs only in the early stages of the process, ∽100 min, when a thin ice cover appears). taking into account the latter and the fact that the temperature relaxation time is many times smaller than a characteristic time of the front motion, we conclude that equation (7) can be approximated by means of equation ∂2Tm(z,t)/∂z2 = 0. now, it is easily seen that the linear temperature profile (6) exactly satisfies this equation and approximately describes the heat balance in the form of equation (7). the mass-balance equation in the form of equation (8) follows from expressions (6) and (9).

Fig. 3. Time series of the solid fraction φa (scale of values on the left) and heat fluxes (scale of values on the right) for (a) buoy 5 and (b) buoy 6. Heat fluxes are calculated for φb = 0.5 (buoy 5) and φb = 0.6 (buoy 6).
It is important to keep in mind that the sea-ice/ocean interface in nature does not divide pure ice and freezing ocean, and divides the mushy layer with a high content of ice (φ ∽ 0.5–0.9; fig. 3) and sea water free of ice. the sea-ice/mushy-layer interface, a(t), lags behind the mushy-layer/ ocean interface, b(t), by virtue of the fact that the process of ice formation is hampered within the mushy layer with a high content of ice (all of the impurities rejected by the ice lattice are initially retained within the interstices of a layer of sea ice).
Let us pay attention to the conductive heat flux released to the atmosphere from the sea-ice/atmosphere interface at z = 0. within the framework of the model under consideration, this flux can be written in the form JC(t) = kiC1(t). this flux stems from the latent heat flux and other factors. let us write down the mean latent heat flux as
In view of insignificant rates of change of a(t) with time (fig. 2a and c), the term connected with the motion of this boundary is omitted. figure 3 demonstrating time variations of the fluxes shows that J C(t) and J L(t) lie close to each other. the residual heat flux J(t) = J C(t) – J L(t) (see fig. 3), within the framework of the model under consideration, is connected with the heat release to the atmosphere. in order to explain the latter it is necessary to say that the residual flux is significant only during initial stages of the process (figure 3 illustrates its dynamics hereafter, where the flux drops and oscillates in the vicinity of J = 0). in other words, the role of J makes itself evident during essential variations in the solid fraction. it should be noted that the heat flux J(t) decreases when the atmospheric temperature goes down and, as a consequence, when the mushy layer increases most rapidly (these instants of time are shown by slight crests of b(t) in figurefigure 2a and c). the total oceanic heat flux differs from the residual flux J(t) because some additions (e.g. the turbulent oceanic heat flux at the underside of the ice, and the solar radiation heat flux reflected from the ice cover) appear in nature. some of these factors can be analyzed in the spirit of this paper. let us emphasize in conclusion that the heat flux J C(t) (or J L(t)), obtained theoretically on the basis of experimental data, approximately represents the total heat flux per unit area lost in solidification of leads.
Acknowledgements
This work was made possible in part by award no. rec-005 (ek-005-x1) of the us civilian research and development foundation for the independent states of the former soviet union (crdf) and due to the financial support of grants nos. 05-01-00240, 04-02-96002 ural, 04-01-96008 ural (russian foundation for basic research). d. alexandrov is grateful to brhe program (crdf and minobrnauka rf, grant no. y1-pme-05-02) and president grant md-7106.2006.2.


