


“The key data is this, and it’s important to reemphasize if only to shut up the useless, overpaid political consultants who idiotically babble about ‘moving to the center’ or ‘compromising with the other side’. . .What matters is turning out our voters. That’s it. The Democrats win when we fire up and turn out our base.”
—Blog post on Daily KosFootnote 1
“Democrats cannot win elections without capturing the votes of independent-minded swing voters.”
—Commentary in the Wall Street JournalFootnote 2
INTRODUCTION
The current state of American politics, characterized by high degrees of legislative polarization, brinksmanship, and gridlock (e.g., McCarty, Poole, and Rosenthal Reference McCarty, Poole and Rosenthal2006), has raised new questions about the interplay of ideology and electoral success in US elections. The study of candidate ideology and electoral performance in US elections can be crudely divided into two literatures that seem fundamentally at odds with each other. On one side is what we might call the institutional literature, which uses election data to suggest that there is an electoral advantage for moderate candidates (e.g., Ansolabehere, Snyder, and Stewart Reference Ansolabehere, Snyder and Stewart2001; Canes-Wrone, Brady, and Cogan Reference Canes-Wrone, Brady and Cogan2002; Erikson Reference Erikson1971; Erikson and Wright Reference Erikson, Wright, Brady, Cogan and Fiorina2000; Hall Reference Hall2015). This literature is often associated with the idea that candidates must appeal to “swing voters” to win office. On the other side is what we might call the behavioral literature, which uses survey evidence to suggest that many voters are uninformed and ideologically inconsistent, casting doubt on whether swing voters are relevant or whether they even exist at all (e.g., Campbell et al. Reference Campbell, Converse, Miller and Stokes1960; Converse Reference Converse and Apter1964; Lenz Reference Lenz2012; Miller and Stokes Reference Miller and Stokes1963). This latter literature is often associated with the idea that turnout among the parties’ bases determines election outcomes.Footnote 3 In the strongest version of this claim, voters are rigid partisans, “campaigns consist in large part of reminding voters of their partisan identities—‘mobilizing’ them to support their group at the polls,” and more moderate candidates do no better than more extreme candidates because “election outcomes are essentially random choices among the available parties” (Achen and Bartels Reference Achen and Bartels2016, 311–312).
This disagreement rages on in the popular press, too, where pundits and campaign practitioners debate the relative merits of hypothetical moderate candidates who capture swing voters or ideologically committed candidates who “fire up the base.” Consider, as a recent example, the 2016 Democratic presidential primary race between Hillary Clinton, widely thought to be the more pragmatic and moderate candidate, and Bernie Sanders, the farther left progressive candidate.Footnote 4 Thom Hartmann, the progressive radio host, argued that Sanders would make a better general-election candidate than Clinton, saying: “the truth is, Democrats win when voter turnout is high. And voter turnout is high when voters have real progressive candidates and a truly progressive platform to support.”Footnote 5 This is a sentiment shared by many progressives, as the colorful Daily Kos quote in the epigraph above suggests. Former member of Congress Barney Frank disagreed with this idea, penning an op-ed telling readers that ‘wishful thinking won’t win the White House.” Frank continued, “[Sanders’s] very unwillingness to be confined by existing voter attitudes. . .is both a very valuable contribution to the democratic dialogue and an obvious bar to winning support from the majority of these very voters in the near term.”Footnote 6 Similar arguments have been made for Republican candidates and for elections up and down the ballot. While the Clinton–Sanders example concerns the presidency, an office whose elections differ fundamentally from the legislative elections we study, it helps highlight the more general argument about turning out the base versus appealing to swing voters. Although the argument has gone on for decades, empirical evidence to resolve it has been scant. Do more extreme legislative candidates actually galvanize their own bases, and, if so, do they actually perform better than moderate candidates in elections?
In this article, we attempt to answer these questions, and in so doing, we help connect the behavioral and institutional literatures. In particular, we combine election data with survey data from the Cooperative Congressional Election Study (CCES), as well as comprehensive administrative data on voters from Catalist, to show that more extreme candidates do worse, electorally, in part because they decrease their party’s share of turnout in the general election. As a result, turnout among the parties’ bases is a mechanism for the advantage of moderate candidates rather than a phenomenon at odds with selecting candidates of certain ideologies. Extremist candidates do worse, because, contrary to rhetoric, they fail to galvanize their own base and instead encourage the opposing party’s base to turn out more, on average. Put another way, the possibility that voters are tribal partisans, even if true, does not imply that more moderate candidates cannot outperform extremist candidates. In a hypothetical world of rigid partisanship, turnout still allows elections to have ideological consequences.
Our results therefore suggest that the institutional and behavioral literatures on elections are both right and both wrong. Moderate candidates do perform better, electorally, but their success depends largely on their ability to encourage their partisans to turn out—or, similarly, to discourage the other party’s partisans from turning out. As we will show, the estimates from our regression discontinuity design are consistent with the possibility that the bulk of the vote-share penalty of extremist nominees comes from changes in turnout (though our tests cannot prove whether or not there are also swing voters at play). A key point we want to emphasize is that these effects on turnout need not be the result of individual voters carefully processing information about candidates’ positions—for example, the effects could instead be the result of purely elite-driven behavior filtered through campaigns (e.g., endorsements, fundraising). We will not take a stance one way or another on whether voters are informed or rational. The key takeaway from our results is that however individual voters process information, their decision to turn out to vote is systematically related to whether a more extreme or more moderate candidate is running—an observation that helps to revise both the institutional and behavioral literatures on American elections.
We also link our study to a long political economy literature on candidate ideology and turnout (Adams and Merrill Reference Adams and Merrill2003; Adams, Dow, and Merrill Reference Adams, Dow and Merrill2006; Downs Reference Downs1957; Glaeser, Ponzetto, and Shapiro Reference Glaeser, Ponzetto and Shapiro2005; Hinich and Ordeshook Reference Hinich and Ordeshook1969; Peress Reference Peress2011). We make the simple point that, in a typical spatial model where voters have concave utility (and thus convex disutility), so that they receive increasingly large amounts of disutility from candidates further and further from their ideal point, it is the opposing party’s voters who should care the most about a party nominating an extremist instead of a moderate. While the party’s base voters may prefer a more extreme nominee, the opposing party’s base voters dislike this extreme nominee more than the party’s base likes him or her. This is even more true if we consider more behavioral models of voter preferences, like loss aversion, in which case voters might especially dislike opposing-party extremists. Our empirical results are broadly consistent with ideas like these. While the party’s base may or may not turn out more in response to a more extreme nominee, extremist nominees do seem to galvanize turnout in the opposing party.
Documenting these effects empirically requires overcoming a number of issues of omitted variables and selection bias, as well as problems of measurement. Places where more extreme candidates win nomination and stand for office in the general election are sure to vary, systematically, from places where more moderate candidates are nominated. To address this issue, we implement a regression discontinuity (RD) design based on close primary elections. This approach ensures, under plausible assumptions, that districts in which a more extreme candidate barely wins nomination and runs in the general election are otherwise identical, in expectation, to those where a more moderate candidate barely wins the primary and runs in the general. Although the identifying assumption of the RD has been challenged in US House general elections (Grimmer et al. Reference Grimmer, Hersh, Feinstein and Carpenter2012; Caughey and Sekhon Reference Caughey and Sekhon2011), our tests, in line with those of Hall (Reference Hall2015), strongly suggest the design is valid in US House primaries.
To implement the RD, we require a way to scale candidates. Previous studies have mainly relied on roll-call votes, which indicate the ideology of incumbents but cannot tell us anything about candidates who have never served in office. We follow recent work in using the mix of campaign contributions that candidates receive as an indicator of ideology (e.g., Bonica Reference Bonica2013, Reference Bonica2014; Hall Reference Hall2015; Thomsen Reference Thomsen2014, Reference Thomsen2016). These scalings are invaluable, because they inform us not just about incumbents but also about candidates who have never served in office. No other measure is available for studying questions about incumbents and challengers at scale. That said, recent work, focusing primarily on the CFScore scalings from Bonica (Reference Bonica2014), raises questions about what the scalings actually measure (Hill and Huber Reference Hill and Huber2017; Tausanovitch and Warshaw Reference Tausanovitch and Warshaw2017). Tausanovitch and Warshaw (Reference Tausanovitch and Warshaw2017), in particular, shows that CFScores do not correlate well with DW-NOMINATE scores—a conventional measure of roll-call-based ideology for sitting legislators from Poole and Rosenthal (Reference Poole and Rosenthal1985)—within party. We take these concerns seriously, and we address them in several ways. First, we present all of our main results using the contribution-based scalings developed in Hall and Snyder (Reference Hall and Snyder2014) and used in Hall (Reference Hall2015). These scalings have a simple interpretation that emphasizes their substantive meaning irrespective of roll-call-based ideology, and they also correlate fairly well with DW-NOMINATE within party. Finally, we also show the robustness of our results to the use of a variety of contribution-based scalings, which run the gamut from not using information about roll-call votes at all to being setup explicitly to predict roll-call-based scalings.
The remainder of the article is organized as follows. In the following section, we discuss the similarities and differences between the institutional and behavioral literatures on elections and ideology, and we briefly discuss formal theories of candidate ideology and turnout. Following that, we discuss the data we use to study these topics empirically. In the next section, we present regression-discontinuity results that consistently show that extremist candidates do worse, electorally, in part because they skew general-election turnout away from their own party. Finally, we conclude by discussing how our findings help revise and connect behavioral and institutional studies of elections and enhance our understanding of ideology, electoral performance, and turnout.
THEORETICAL BACKGROUND: SWING VOTERS AND TURNING OUT THE BASE
A large literature on American political institutions finds that legislative candidates measured to have more moderate positions do better electorally (e.g., Ansolabehere, Snyder, and Stewart Reference Ansolabehere, Snyder and Stewart2001; Canes-Wrone, Brady, and Cogan Reference Canes-Wrone, Brady and Cogan2002; Erikson and Wright Reference Erikson, Wright, Brady, Cogan and Fiorina2000; Hall Reference Hall2015). An equally large literature on American voter behavior, however, finds that many voters know little about candidates’ ideologies and do not report consistent ideological views (e.g., Broockman Reference Broockman2016; Campbell et al. Reference Campbell, Converse, Miller and Stokes1960; Converse Reference Converse and Apter1964; Lenz Reference Lenz2012; Miller and Stokes Reference Miller and Stokes1963). Furthermore, in surveys, voters do not seem to express support for candidates based on their ideological proximity (e.g., Tausanovitch and Warshaw Reference Tausanovitch and Warshaw2015). For this reason, the political science literature has long viewed the idea that moderates do better electorally and the idea that individual voters are uninformed and highly partisan as fundamentally at odds. Consider this passage from a recent op-ed by Professors Christopher Achen and Larry Bartels in The New York Times:
Decades of social-scientific evidence show that voting behavior is primarily a product of inherited partisan loyalties, social identities and symbolic attachments. Over time, engaged citizens may construct policy preferences and ideologies that rationalize their choices, but those issues are seldom fundamental.
That is one key reason contemporary American politics is so polarized: The electoral penalty for candidates taking extreme positions is quite modest because voters in the political center do not reliably support the candidates closest to them on the issues.Footnote 7
Building off of these arguments, some scholars and campaign practitioners have concluded that elections are much more about “turning out the base”—encouraging partisans who will vote for the party to turn out and vote—than they are about altering ideological positions to appeal to swing voters.Footnote 8 Reviewing precisely these kinds of arguments in 2014, but with a logic that could apply in any year, Professor Lynn Vavreck wrote for The New York Times that “The 2014 fight is not over swing voters. It’s for partisans.”Footnote 9
Each of these literatures has a clear strength and a clear weakness. The strength of the institutional approach is that it speaks confidently to overall election results. Because these articles study actual elections, they can make clear points about which types of candidates actually win real elections. The weakness, of course, is that finding this aggregate evidence does not give us direct information about the mechanisms underlying it. Although institutional scholars have been tempted to take these empirical patterns as evidence that moderate voters sway elections, there is, to our knowledge at least, no direct evidence for this idea. The strength of the behavioral literature is that it can examine these mechanisms directly. The main takeaway is that, generally speaking, many voters do not seem informed enough to make systematically ideological choices in whom they support in the voting booth. This forces us to revise electoral theories that depend on swing voters in important ways. The weakness to this approach is that it is difficult to extrapolate from surveys to actual elections. While many respondents may struggle to articulate coherent positions on a survey, we do not know how the electorate as a whole does or does not process ideological information. Even a relatively small number of well-informed voters, for example, could determine most election outcomes if the less informed voters are relatively evenly split between the two parties. One aim of our study is to address these weaknesses by combining data on election outcomes with survey data on individual voters, so that we can attempt to assess both aggregate electoral outcomes and individual-level mechanisms in a single analysis.
The second point we want to make is that the main findings in the two literatures need not be at odds with one another. Moderate candidates may perform better, electorally, even in the extreme hypothetical where swing voters do not exist, and even if most or all voters are not well informed if turnout is a mechanism for the support of moderate candidates. In particular, extremist candidates could turn off their own party’s voters from turning out to vote and/or galvanize voters in the opposing party to turn out and vote. Although voter attention is one plausible mechanism for effects of this kind, this idea does not depend on voters being highly informed and learning the ideology of each party’s candidate—perhaps, for example, a party coordinates more get-out-the-vote campaigning when it has nominated a more moderate candidate versus when it has nominated an extremist. Perhaps newspapers cover moderates more favorably than extremists, inducing supporters to turn out more—or, conversely, perhaps newspapers slam extremists, exciting voters in the opposition party. There are many possible reasons that candidates of varying ideology could affect turnout and, as a result, could induce electoral effects even if there are few or no swing voters. As a first contribution, our focus is on understanding the consequences of extreme versus moderate candidates in the general election rather than on identifying which of these mechanisms is most responsible for those consequences.
To explain the idea of how candidates of varying ideology can affect turnout in more detail, we turn now to considering formal theoretic ideas about candidate ideology and voter turnout.
Formal Theories of Turnout
Although the formal theory literature on elections largely builds on the median-voter theorem’s basic foundation, a significant literature studies the question of candidate ideology and turnout directly (e.g., Adams and Merrill Reference Adams and Merrill2003; Adams, Dow, and Merrill Reference Adams, Dow and Merrill2006; Downs Reference Downs1957; Glaeser, Ponzetto, and Shapiro Reference Glaeser, Ponzetto and Shapiro2005; Hinich and Ordeshook Reference Hinich and Ordeshook1969; Hortala-Vallve and Esteve-Volart Reference Hortala-Vallve and Esteve-Volart2011; Peress Reference Peress2011). We will not test the predictions of these models directly, but we will make one simple point about how moderate versus extremist nominees might affect turnout in these theoretical models.
Suppose, as is standard, that voters have concave utility over policy positions, that is, convex disutility, so that they dislike positions farther from their ideal point more and more. This assumption is not the only way to construct a model in which opposing-party voters turn out more in response to extremist nominees, but it is a helpful and standard example. Now imagine a typical voter in each party considering turning out when the Republicans nominate a moderate versus when they nominate an extremist. Figure 1 presents the situation graphically. The figure considers a base voter in each party—voter j is a Democrat; voter i is a Republican. Each voter is located at their bliss point on the ideological spectrum. The upside-down parabolas represent each voter’s utility, which is zero at its maximum when a candidate is at the voter’s ideal point and is decreasing away from the ideal point—and, crucially, following normal assumptions, the rate at which it decreases goes up as the distance grows.
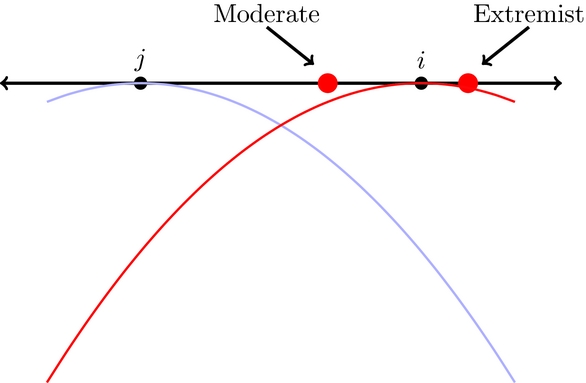
FIGURE 1. Candidate Ideology and Turnout. With a typical concave utility function, the nomination of an extremist over a moderate affects voters in the opposing party more than voters in the nominee’s party. Specifically, voter j, in the opposing party, loses more utility than voter i gains when voter i’s party nominates an extremist instead of a moderate.
Suppose that the Republican party nominates either a moderate Republican candidate (labeled on the plot as the moderate) or an extremist (also labeled on the plot). Clearly, voter i is closer to the extremist than the moderate. Her utility is higher at the extremist’s point than at the moderate’s, so she may be more willing to turn out in the general when the party nominates the extremist. Conversely, though, voter j loses more utility than voter i gains when we consider the switch from the moderate to the extremist. Voter j’s utility function makes this clear; because it gets steeper as we get further from voter j’s bliss point, and because candidates in the other party are naturally farther away from j than they are from i, voters in the opposing party are likely to be more horrified by an extremist nominee than the party’s own base is pleased by one. If this fear drives voter turnout, then extremists will galvanize voters in the opposing party more than those in their own party’s base.
Another reason extremist nominees may galvanize turnout in the opposing party has to do with “rational inattention,” an area of growing interest in political economy. Matějka and Tabellini (Reference Matějka and Tabellini2017), for example, offers a model in which rational, forward-looking voters consider whether to invest effort in becoming informed about candidates. A key factor in their decision is what is at stake in the election—that is, it is more valuable for voters to be informed if the potential policy outcomes induced by the election are more consequential to them. Although it is not a specific prediction put forward in the article, opposing-party extremist voters may have a particularly strong incentive to become informed when the opposing party nominates an extremist. We suspect that rationally inattentive voters are a promising recent literature to which our empirical tests will be relevant.
The spatial model massively abstracts from the actual electoral process. As we have presented it, it omits all of the nonideological factors that candidates possess, as well as the effects of media, campaigns, and more. We have also assumed that utility functions are quadratic rather than, for example, Gaussian or asymmetric as in prospect theory (Carroll et al. Reference Carroll, Lewis, Lo, Poole and Rosenthal2013; Quattrone and Tversky Reference Quattrone and Tversky1988; Brady and Ansolabehere Reference Brady and Ansolabehere1989).Footnote 10 Further, some research questions the ability of voters to process information about candidate ideology directly (e.g., Ahler, Citrin, and Lenz Reference Ahler, Citrin and Lenz2016; Tausanovitch and Warshaw Reference Tausanovitch and Warshaw2013), leaving the task of translating ideology into voter behavior to elites or factions (Snyder and Ting Reference Snyder and Ting2002), campaigns (Franklin Reference Franklin1991), or some other mechanism. We do not claim our simple sketch captures all of these possibilities, but it helps illustrate the simple point that, while extremists might galvanize their own base, they could just as easily, if not more easily, galvanize voters in the opposing party. Having laid this idea out, we now turn to our empirical analyses of candidate ideology, electoral outcomes, and turnout.
DATA ON ELECTIONS, IDEOLOGY, AND TURNOUT IN THE US HOUSE
To investigate these topics, we combine three main datasets. The first is a dataset containing all US House primary and general elections, 1980–2014, compiled from primary sources for a series of articles including Ansolabehere et al. (Reference Ansolabehere, Hansen, Hirano and Snyder2007) and extended to later years by the same authors.
The second dataset comes from the CCES (Schaffner and Ansolabehere Reference Schaffner and Ansolabehere2015) and measures partisan turnout in US House general elections for the years 2006–2014. For each respondent in the CCES, we rely on the validated turnout indicator rather than the self-reported turnout. For this variable, each respondent’s turnout status is validated using administrative data compiled by Catalist. We define Democrats to be any respondent who reports identifying with the Democratic party in the seven-point party identification item, including strong Democrats, not very strong, and leaners, and we define Republicans analogously. This choice is consistent with the finding that leaners and weak partisans behave in nearly identical ways (Abramowitz Reference Abramowitz2012; Keith et al. Reference Keith, Magleby, Nelson, Orr and Westlye1992; Pew Research Center 2014).Footnote 11 We can then compute two types of turnout rates from the CCES data: the share of validated voters who identify as Democrats and the share of respondents who turn out broken up by party. This first turnout share variable tells us whether the electorate in the district skews towards one party or another in a given election; the second tells us whether members of a given party turned out more or less than usual. For example, imagine a district in which 250 Democrats and 250 Republicans are sampled, and 100 Democrats and 200 Republicans have validated turnout. In this district, the Democratic share of validated votes is 100/(100+200) = 33%, the Democratic turnout rate is 100/250 = 40%, and the Republican turnout rate is 200/250 = 80%.
Response bias from the fact that taking surveys like the CCES is voluntary is certainly a concern. Indeed, validated turnout rates in the CCES are substantially above the population turnout rate (Ansolabehere and Hersh Reference Ansolabehere and Hersh2012). To attempt to account for these kinds of issues, we do two things. First, we only make comparisons across CCES respondents (e.g., turnout for Republicans versus for Democrats in the same race) to difference out the fixed part of this bias. Second, and more importantly, we replicate our main results using Catalist voter-file data, directly. This alternative data contains full voter files, removing all response bias (although it has other, unrelated, issues that we discuss below). We find extremely similar point estimates using this data, suggesting that survey response bias does not affect our conclusions.
The third dataset contains the ideological scalings of congressional candidates and comes from Hall and Snyder (Reference Hall and Snyder2014). The Hall–Snyder scalings are created in two stages. First, donors are given an imputed DW-NOMINATE score (hereafter, Nominate score) based on the roll-call scalings of the incumbents to whom they donate. Donors with more positive scalings are thus donors that donate more to farther right incumbents; donors with more negative scalings donate more to far left incumbents. In the second stage, candidates’ scores are imputed based on the donors from whom they received contributions. A farther left candidate, in the Hall–Snyder scaling, is one who receives more donations from donors who tend to support farther left incumbents, for example.
Details on how we cleaned and merged these datasets can be found in the Appendix.
Considering Issues with Contribution-Based Candidate Scalings
Recent literature has raised questions about what exactly contribution-based scalings reveal about candidate positions.Footnote 12 In particular, Tausanovitch and Warshaw (Reference Tausanovitch and Warshaw2017) shows that the CFScores developed in Bonica (Reference Bonica2014) do not correlate well with estimates of candidate ideology built from roll-call votes (like the Nominate scalings from Poole and Rosenthal (Reference Poole and Rosenthal1985)). The most important point for us to make is that the Hall–Snyder scalings we use actually correlate fairly well with Nominate within party; as Hall and Snyder (Reference Hall and Snyder2014) shows, the Hall–Snyder scores correlate at 0.61 with Nominate scores for Democrats and at 0.53 for Republican Nominate scores. Since the Hall–Snyder scalings are built off of Nominate (though not intended to predict them, necessarily), it is not surprising that they correlate with it more highly than CFScores, which use only the candidate-donor matrix to extract a dimension of ideology.
This raises a broader point about scaling candidates. No scaling technique can isolate ideology, since it is such a complicated object with different meanings in different contexts. Roll-call votes indicate one important aspect of the concept, the part related to the incumbent’s formal behavior in the legislature.Footnote 13 Sometimes, like when we are specifically studying roll-call votes—one of the most important representative acts a legislator performs—it makes sense to focus on measures that explicitly attempt to predict roll-call votes for candidates who have not cast them. In other contexts, the goal might not be specifically to predict roll-call votes. When voters, elites, and the media consider the ideology of potential representatives, they may consider a variety of factors. How will a potential candidate shape legislation? What issues will she prioritize? Whose voices will she listen to? These activities include roll-call voting but also many other items that are distinct from roll-call voting. The mix of campaign contributions a candidate receives may tell us something about who is extreme and who is moderate—in the precise sense of what kinds of donors her portfolio is weighted towards—that is valuable and somewhat distinct from roll-call voting. This is why it is not clear that the goal of contribution-based scalings should be to perfectly recover the Nominate scaling. This is clearest to us when considering the Hall–Snyder scalings. As described above, these scalings convey substantive information on whether they correlate with Nominate scores. It is coherent to talk about an extremist—a candidate who raises most of his of her money from donors who tend to donate to extreme members of the legislature—in the context of these scalings.
That being said, it is important to understand whether our results depend on our choice of scaling method and the degree to which it accords with Nominate scores. After presenting our results using Hall–Snyder scores, which have a medium correlation with roll-call scores within party, we then present our results with three other possible scalings: CFScores and Dynamic CFScores, which have very low correlations with Nominate within party, and DW-DIME scores, which are constructed to be as highly correlated with Nominate within party as possible. Although these alternative scalings have some problems for our design, because they use posttreatment contributions, we think they provide a useful range of estimates across the range of within-party correlation with roll-call-based scores. As we show, we find results that are similar in magnitude across all the scalings. In the end, our results do not seem to depend on whether we use Nominate scores as the ground truth for predicting candidate ideology.
EFFECTS OF EXTREMIST NOMINEES ON TURNOUT: RD EVIDENCE
Do more extreme candidates do worse in general elections? To isolate the effect of extremists on general-election turnout, we follow Hall (Reference Hall2015) in focusing on close primary elections between a more extreme candidate and a more moderate one. Districts that nominate more or less extreme candidates will differ from one another in general. However, the set of districts where an extreme candidate barely wins or barely loses a close primary race to a more moderate candidate will be otherwise identical, on average.
Consider again the rhetoric concerning more moderate versus more extreme primary candidates. We want to evaluate the consequences of nominating an extremist instead of a more moderate candidate in the general election. Is it true that extremists increase turnout among the base? Or is it the case that more moderate candidates successfully secure swing voters? More moderate and more extreme candidates surely differ from each other in other ways beyond ideology, but by systematically studying these types of choices, we can learn about the electoral and representational consequences of voters’ decision to nominate more extreme or more moderate candidates, whatever the myriad mechanisms underlying these consequences. While the RD estimates the effect of a “bundled” treatment, the bundle of all candidate characteristics correlated with being an extremist, these are precisely the bundles voters are constrained to choose between, and thus the quantity estimated is directly relevant.
As this discussion makes clear, the goal is not to isolate the “causal effect” of candidate positions, themselves. In fact, it is not even clear that there is such a thing as a causal effect of candidate positions. Like gender or race, ideology is probably a deep characteristic built throughout one’s life; it almost certainly violates the “no causation without manipulation” maxim. Although one can imagine altering the candidate positions that voters see in a survey or field experiment, this does not isolate actual changes in candidate positions. If candidates with different ideologies differ on other dimensions, then voters may make inferences about these other attributes when they are told that a candidate holds certain positions (e.g., Gerber, Gooch, and Huber Reference Gerber, Gooch and Huber2017).
In order to implement the RD design, we need to identify extremist and moderate primary candidates. First, we limit the data to contested primary races where the top two candidates in the race both have raised enough money to have a Hall–Snyder score. Some of these races occur between two candidates who are very distinct, ideologically, where it is clear that one candidate is the extremist and one the moderate. But in other races, the candidates are closer together, ideologically. Following Hall (Reference Hall2015), we define a primary race as being one between an extremist and a moderate if the ideological distance between the candidates, in terms of their contribution-based scalings, is at or above the median distance between the top two primary candidates across all races in the sample.
Specifically, we estimate equations of the form
 $$\begin{equation}
Y_{ipt} = \beta _0 + \beta _1 \mathit {\rm Extremist \, Win}_{ipt} + f(V_{ipt}) + \epsilon _{ipt},
\end{equation}$$
$$\begin{equation}
Y_{ipt} = \beta _0 + \beta _1 \mathit {\rm Extremist \, Win}_{ipt} + f(V_{ipt}) + \epsilon _{ipt},
\end{equation}$$
where Y ipt is one of our outcome variables measured for party p in district i at time t, usually either party p’s vote share or turnout share. Extremist Winipt is an indicator variable for whether the extremist candidate wins the primary for party p in district i at time t. The quantity of interest is thus β1, which reflects the RD estimate of the effect of an extremist nomination. Finally, the function f(V ipt) is the function used to control for the extremist’s vote-share winning margin in the primary, V ipt.
In this article, we use this design to study turnout effects rather than vote-share effects like in the original article. That being said, we first replicate the Hall (Reference Hall2015) estimates on vote share. We do this replication because our subsequent analyses will be using a smaller dataset that only includes election years since the beginning of the CCES in 2006, while the original article used data from 1980 onward. We will also refer back to these vote-share estimates later in interpreting the turnout estimates. Table 1 presents the estimates. As is standard in RD studies, we report estimates at a variety of specifications and bandwidths for f(V ipt). In the first column, we use a local linear ordinary least squares (OLS) estimated separately on each side of the discontinuity, using only observations where the primary winner won by ten percentage points or less. In the second column, we use all the data with a third-order polynomial of the running variable. In the third column, we increase this polynomial to fifth-order. In the fourth column, we use the automated bandwidth selection and kernel estimation from Calonico, Cattaneo, and Titiunik (Reference Calonico, Cattaneo and Titiunik2014). These first four columns are all on general-election vote share; the final four columns replicate these specifications for electoral victory (an indicator) instead of vote share.
TABLE 1. Effect of Extremist Nominee on Party’s General-Election Vote Share and Victory, US House, 2006–2014

Robust standard errors clustered by district in parentheses in columns 1–3 and 4–7; standard errors in columns 4 and 8 come from the rdrobust package and are clustered by district. The running variable is the extremist primary candidate’s vote-share winning margin in the primary.
As the table shows, we find large effects on vote share and electoral victory, consistent with Hall (Reference Hall2015). Nominating an extremist drastically reduces the party’s electoral fortunes in the general election. Although the estimate does move around from specification to specification, likely because of the reduced sample size when only focusing on data from 2006 to 2014, it is consistently negative and statistically significant.
Having documented the effect of extremist nominees on vote share, we now examine their effect on partisan turnout. Following typical practices, we begin by studying the RD graphically. Figure 2 plots binned averages of the extremist candidate’s winning margin in each primary race, on the horizontal axis, against the general-election vote share of the primary winner, on the vertical axis. When the winning margin is above 0, to the right of the vertical line in the plot, the extremist candidate from among the top two primary candidates wins the race, and the party fields an extremist in the general election. When the winning margin is below 0, to the left of the vertical line in the plot, the moderate wins and stands in the general election instead.
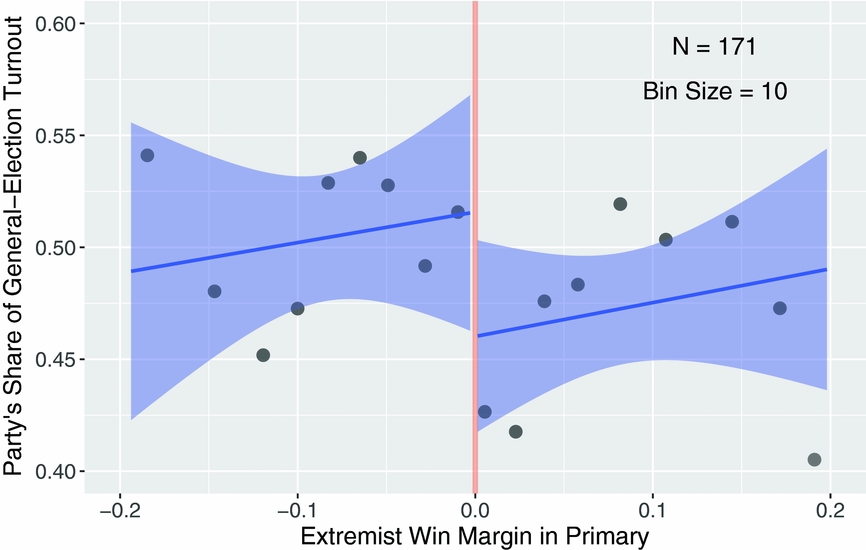
FIGURE 2. The Effect of Extremist Nominees on Validated Partisan Turnout in the General Election. US House, 2006–2014. When a party nominates an extremist in its primary, general-election turnout skews towards the opposing party.
The plot also includes OLS lines fit to each side of the discontinuity, separately. These lines, as well as their 95% confidence intervals, are estimated from the underlying data, not the binned averages. As the lines show, there appears to be a noticeable drop at the discontinuity; when the party goes from just barely nominating a moderate to just barely nominating an extremist, its share of turnout in the general election drops by roughly six percentage points in the graph.
Table 2 presents the formal estimates, using the same specifications as in the vote share RD. No matter the specification, we find strong, negative effects of extremist nominees on their party’s share of turnout in the general election.Footnote 14 Consider the first column. Here, we estimate that nominating an extremist instead of a moderate causes a party’s voters to constitute a ten-percentage-point smaller turnout in the general election. Looking across the columns, the estimates range from −6 to −10 percentage points. All together, we find strong evidence that extremist nominees depress their party’s share of turnout in the general election, on average.
TABLE 2. Effect of Extremist Nominee on Party’s General-Election Turnout, US House, 2006–2014
Robust standard errors clustered by district in parentheses in columns 1–3; standard error in column 4 comes from the rdrobust package and is clustered by district. The running variable is the extremist primary candidate’s vote-share winning margin in the primary.
It is worth restating this finding in the context of the RD to make clear the things that are not driving this effect. We can think of the effect in the context of a hypothetical identical district. In one world, this district receives a more extreme nominee—let us say it is a Democratic extremist. In the other world, this district receives a more moderate Democratic nominee. Everything else, including the identity of the Republican opponent and the partisanship of the district, are exactly the same across these two worlds.Footnote 15 In the case where the extremist now runs in the general election, our findings say that the pool of people who turn out to vote in the general will have a lower proportion of Democratic voters—that is, Democrats will make up a smaller share of the electorate—than in the case where the moderate runs in the general election instead.
These effects are substantial, and we might wonder how simply changing the identity of a US House nominee could alter turnout so much. Below, we offer some analyses on possible mechanisms, and we suggest that campaigning effects—the ways moderate nominees run their general-election campaigns and the support they get from party elites—probably drive some of the effect. Consistent with this possibility, our effect estimates are quite similar to the estimates of the aggregated effects of presidential campaigns on local turnout. While individual get-out-the-vote (GOTV) interventions only seem to affect turnout by roughly a percentage point, on average (Green, McGrath, and Aronow Reference Green, McGrath and Aronow2013), Enos and Fowler (Reference Enos and Fowler2016) estimates that the stacked effects of many such interventions over the course of a presidential campaign causes approximately an eight-percentage-point increase in turnout, squarely in the range of our estimates.
Additionally, our own analyses suggest that House-specific features of the electoral landscape can alter turnout more than might be expected if one thinks of turnout as mainly driven by presidential elections. To show this, in the Online Appendix we use data on district-level House vote from 1980 to 2016. We use the winning margin in the race to predict total votes cast. We include district and year fixed effects to account for the possibility that some districts and some election years have both higher turnout and more competitive races. Within districts, when a House race is more competitive, more people turn out, even relative to average turnout across the country in that year. This holds even when we only estimate the regression with presidential election years, and when we zoom up only on recent elections. The relationship is large, too. For example, using only the presidential elections 2004, 2008, 2012, and 2016, we estimate that a ten-percentage-point increase in the House election win margin is associated with roughly a seven-percentage-point reduction in total turnout, relative to turnout in a hypothetical tied race, on average (this association is larger if we include earlier presidential elections, too.) These are substantial shifts in turnout that are not driven by presidential voting.
In interpreting our effects, we should also keep in mind that the underlying “intervention” we are studying, changing the identity of a party’s nominee from a moderate to an extremist, is quite powerful, even if we are studying House rather than presidential elections. GOTV effects are estimated conditional on the identity of the candidates in the race, while the effects we estimate here change who the candidate is. Since candidates appeal to voters in different ways, and run different campaigns, it is plausible that our design could estimate turnout effects that are much larger than the effects of a single GOTV intervention.
Validating the RD’s Identifying Assumption
For the RD results above to be valid, and not confounded by unobserved differences in the potential outcomes of the districts that nominate extremists versus those that nominate moderates, it must be the case that candidates cannot “sort” across the discontinuity. Past research has raised questions about the validity of this assumption in US House general elections, offering evidence that candidates who just barely win differ in observable ways (most notably, in terms of incumbency status) from those that barely lose (Grimmer et al. Reference Grimmer, Hersh, Feinstein and Carpenter2012; Caughey and Sekhon Reference Caughey and Sekhon2011; Snyder Reference Snyder2005). However, Eggers et al. (Reference Eggers, Fowler, Hainmueller, Hall and Snyder2015) presents evidence that these concerns do not typically apply to most electoral RD designs, finding no evidence of such sorting in any other electoral case.Footnote 16 Hall (Reference Hall2015), using the same close primaries RD design as the present study, finds no evidence of sorting, either. Following these studies, in the Online Appendix we present balance tests that suggest there is no sorting in close US House primary elections. Specifically, we reestimate the RD specifications above but using lagged turnout share as the dependent variable (since this is our main outcome variable of interest). We find no evidence that treated and control districts differ from each other, on average, in terms of lagged turnout share.Footnote 17
Replicating the RD with Administrative Data on Turnout
The CCES data are useful because they provide a wealth of additional information about individual voters, such as their self-reported ideology and partisanship, that we will exploit below. Before doing so, though, we need to make sure that our results are not driven by some of the undesirable aspects of the CCES sample. In particular, we might worry that the set of people who are willing to answer an exhaustive survey about politics are especially engaged individuals. Effects documented on this unusual sample of people may not generalize to the whole electorate, especially since the number of voters per district in the CCES sample is not particularly large.
To address this issue, we now reestimate the RD but using data on turnout by party from Catalist, which assembles voter files for all 50 states. We estimate turnout by party for 2014 using a 1% random sample of the Catalist database drawn in August 2015; for 2012 using a 1% random sample of the Catalist database drawn in September 2013; and for 2006 through 2010 using a 1% random sample drawn in November 2011. A few important peculiarities of the samples bear mentioning. First, both samples are random samples of registered voters in a given state. This means that voters who move across state borders are overrepresented in our data. The 2013 sample includes all observations for any sampled individual, so we can reweight the turnout statistics to remove this bias for the 2012 estimates, but we are unable to use this technique in earlier years. Second, 20 states do not include party information as a part of their voter registration process. For these states, we use a modeled Democratic party propensity variable that Catalist constructed to classify registrants in these states as Republicans and Democrats. Last, Catalist began gathering voter files between 2006 and 2008, so some voters who moved between 2006 and 2008 may be missing in the 2006 analysis.
Table 3 presents the results. Although the estimates are noisier, probably due to some of the data issues discussed above, we obtain very similar estimates when we use the full voter file instead of the CCES sample.
TABLE 3. Effect of Extremist Nominee on Party’s General-Election Turnout, US House, 2006–2014

Robust standard errors clustered by district in parentheses in columns 1–3; standard error in column 4 comes from the rdrobust package and is clustered by district. The running variable is the extremist primary candidate’s vote share winning margin in the primary.
RD Results Similar across Possible Scaling Techniques
We now examine the robustness of the results to using alternative contribution-based scalings. Table 4 replicates the RD estimates for every available contribution-based scaling. The first row reproduces the results from before, using the Hall–Snyder scalings and using the same four RD specifications we have used throughout. The second row uses the standard CFScore scaling from Bonica (Reference Bonica2014). The third row uses Dynamic CFScores, which are the same as CFScores except estimated separately for each year, so that candidate scalings can vary over time. The final row uses the DW-DIME scaling from Bonica (Reference Bonica2017). This scaling uses machine-learning techniques to predict Nominate scores as well as possible and is extremely highly correlated with Nominate within party. All three of these alternative scalings may suffer from some posttreatment bias, because they use contributions that candidates receive after winning office, unlike the Hall–Snyder scores. In addition, the DW-DIME scalings are likely to be less precise because they implicitly draw information from a smaller set of donors (those that are algorithmically found to be most predictive of roll-call votes). But they all provide useful differences from the Hall–Snyder scores and are useful for assessing the robustness of our results.
TABLE 4. Effect of Extremist Nominee on Party’s General-Election Turnout Across Scalings, US House, 2006–2014

Robust standard errors clustered by district in parentheses in columns 1–3; standard errors in column 4 come from the rdrobust package and are clustered by district. The running variable is the extremist primary candidate’s vote share winning margin in the primary. Each pair of rows represents the effect estimates from a different measure of ideology.
As the table shows, we tend to find similar results with all of the measures. In all sixteen specifications across all four scalings, estimates are negative and substantively meaningful (the smallest estimate is −0.04, which we would argue is still a fairly large effect in the electoral context.) Estimates appear to be larger with CFScores than with Hall–Snyder scores, and smaller with DW-DIME scores (the DW-DIME scores are also about 20% noisier, in terms of standard errors), but the overall pattern is fairly clear.
In the Online Appendix, we also attempt to validate our approach by reestimating the RD design with an entirely separate measure of candidate ideology that does not depend on donations. We use NP-Scores, based on state legislative roll-call votes from Shor and McCarty (Reference Shor and McCarty2011), and we focus on close House primary races between two state legislators. Unfortunately, there are simply not enough cases to generate a stable RD estimate, and the coefficient estimates vary massively across bandwidths. Although the lack of stability brings with it some implausibly large effect sizes, all of the RD estimates in this alternative approach are also negative. As such, we view this as a weak but useful validation exercise.
Given these robustness checks, we conclude that our findings are not driven by our choice of scaling from among the available options. The fact that we find similar estimates across the spectrum from no within-party correlation with Nominate to high within-party correlation with Nominate suggests to us that we are capturing something meaningful about extremist and moderate candidates.
Considering the Local Nature of the RD
To identify the effects of extremist nominees, the RD necessarily focuses on close primary races, which make the resulting estimates “local” to this context. In the present study, we have good reasons to think that this local estimate is more generalizable than is often possible. As Hall (Reference Hall2015) shows, close primary elections occur in a variety of districts. Unlike general-election RDs, which by definition only take place in competitive districts, primary election RDs are able to utilize both competitive districts and safe districts, because the dominant party in safe districts often has competitive primaries. In the Online Appendix, we offer some descriptive evidence to suggest that the RD sample is similar to the broader set of contested primary races, so we suspect that our estimates are not particularly local. Finally, since we also present similar results using the panel analysis (see Online Appendix), which relies on a much broader set of elections, we are relatively confident in the generalizability of the RD estimates.
WHO PUNISHES EXTREMISTS? EVALUATING MECHANISMS
Is the Penalty to Extremists Driven Mostly By Turnout and Not Swing Voters?
How much of the overall electoral penalty that extremists receive comes purely from the overall turnout effect, and how much comes from voters switching sides? There is no way to answer this conclusively without observing individual vote choices, but we can conduct a suggestive test. If the RD-estimated effects on partisan turnout share are very different from the effects on vote share, then we might have more reason to think swing voting is occurring.
To make these ideas clear, suppose for starters that all voters are either Democrats or Republicans (i.e., no independents, an issue we discuss below.) Suppose we observe a large effect on vote share and no effect on turnout share. This would directly rule out the hypothesis that all voters are rigid partisans, because if all voters were rigid partisans, then changes in vote share would have to accord with changes in turnout share. If, on the other hand, the effects are quite similar, then we might suspect that turnout and not swing voting is the main explanation. This would not be conclusive because compositional changes in the numbers of swing voters turning out in each party could coincidentally lead to similar changes in turnout and vote share, but it would be suggestive because in a hypothetical world with no swing voting, where every voter is a rigid partisan, the only pattern consistent with a vote share estimate is for there to be an equivalent change in turnout share.
Figure 3 plots the RD estimates on vote share and partisan turnout side by side for each specification. As a reminder, the outcome variable for the turnout analysis here is the partisan turnout share, the fraction of Democratic voters among all Democratic and Republican voters who cast votes. Since this is the same denominator as for vote share, effects for turnout share and for vote share are directly comparable.
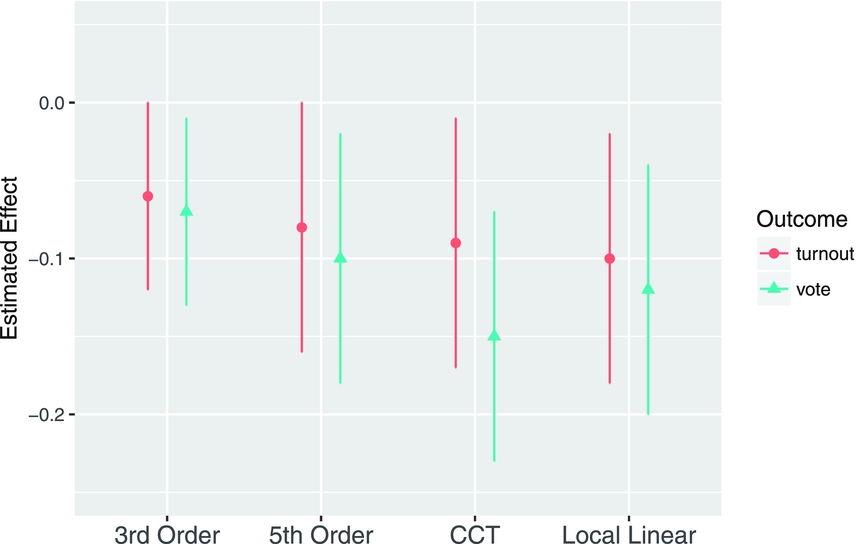
FIGURE 3. RD Effect of Extremist Nominees on Vote Share and Partisan Share of Turnout, US House, 2006–2014. The estimated vote-share penalty to extremists is similar to the estimated effect of extremists on their party’s share of turnout in the general, suggesting that much of the penalty to extremists may be driven by differential turnout.
As we see, the estimates are similar. Though we stress that this is not a dispositive test, it is consistent with the hypothesis that most of the effect of extremist nominees on electoral outcomes is driven by changes in turnout, with many voters fixed in their partisan loyalty. The first estimate in the plot, which uses a third-order polynomial that tends to be the most conservative estimate across specifications in the article, shows highly similar point estimates on turnout and on vote share, with extremist nominees estimated to cause roughly a six-percentage-point decrease in the turnout share and a seven-percentage-point decrease in vote share. Recall our hypothetical example from the Data section, where we supposed that 300 voters turned out, 100 of which were Democrats, so that the Democratic turnout share was 33% and, supposing that all partisans vote for their own party, the Democratic vote share would also be 33%. Now suppose that this hypothetical election occurred with a moderate nominee. The point estimate on turnout share here says that, on average, we would expect the Democratic turnout share to fall to 27%, a decrease of six percentage points, and we would expect the Democratic vote share to fall to 26%, a decrease of seven percentage points.
Subsequent estimates are similar, though the gap between the two effects does grow, particularly when we use CCT, which uses the least amount of data and is therefore the most variable in small samples. In all cases, the turnout effect is large in magnitude, and except for the outlier estimate of −0.15 on vote share in the CCT specification, the gap between the estimates is never more than two percentage points. As such, we conclude that the turnout of partisan voters appears to be a very important component of the overall vote-share penalty to extremist nominees. More than zero swing voting is no doubt occurring, but pundits and campaigners may be right that the turnout of the bases is particularly important.
Purely independent voters, voters who do not lean towards one party or the other, deserve a separate comment. As a reminder, we compute our partisan turnout share variable including leaners as members of each party, but we omit pure independents entirely; as such, they do not contribute to the turnout variable. On the other hand, we cannot remove them from the vote share estimate, so if they act as swing voters, then they may induce variation in the vote share variable that is separate from changes in the partisan share of turnout. Given our results, this could mean that the similarity in the turnout and vote-share estimates is a coincidence, with the vote-share penalty actually driven by swing voting among independents. This is not really a separate problem from what we already discussed above—namely, that in general we cannot rule out any level of swing voting. Because we find turnout share effects similar to vote-share effects, and because pure independents are a smaller portion of the sample, we conclude that a significant portion of the vote-share estimate is likely driven by the change in partisan turnout.
In the Online Appendix, we also estimate turnout effects for pure independents, who represent roughly 10% of CCES respondents. Given the small sample sizes, we are unable to say definitively how these voters respond to extreme candidates, but positive estimates of the effect of extremist nominees on the rate of independent voter turnout suggest to us that these voters behave similarly to opposing party voters and are galvanized to turn out when extremists are nominated.Footnote 18
Effects in Midterms versus Presidential Years
We have documented large overall turnout effects from nominating extremists in US House races. These effects could indicate individual voters making informed decisions about the candidates, or they could instead indicate coordinated campaigning effort among elites and parties that depends on the identity of the nominee. Isolating either of these mechanisms is extremely difficult and will require follow-up work in the future. That said, there is one simple test we can run that may be somewhat informative. If the penalty is larger in midterm years and smaller in presidential years, then it might suggest a voter-centric mechanism. In presidential years, voters are more likely to base their decision to turn out on the presidential race, while in midterm races voters might be more likely to turn out based on the identity of the House candidates themselves. If we still find a large penalty in presidential years, then it would suggest the overall results are not as much due to voter choices directly, since we would expect those choices not to hinge on the identities of the House candidates. On the other hand, if the penalty is much larger in midterm years, and smaller or null in presidential years, then it would suggest that the results could be mainly due to voter choices directly.
Table 5 replicates the RD estimates for midterm and presidential years, respectively. Cutting the data in half results in relatively unreliable estimates, so we do not place too much weight on these analyses, but the patterns are interesting. Effects look smaller in presidential years, but not by much (the sample sizes are not sufficient to provide an interesting test of the null that the effects are the same across the two contexts.) For three of four specifications, we find quite large turnout effects in presidential years. These speculative results suggest to us that much of the turnout penalty might result from coordinated campaign efforts among parties and elites who might be more willing to allocate scarce resources to moderates rather than extremists.
TABLE 5. Effect of Extremist Nominee on Party’s General-Election Turnout in Midterm and Pres Years, US House, 2006–2014

Robust standard errors clustered by district in parentheses in columns 1–3 and 4–7; standard errors in columns 4 and 8 come from the rdrobust package and are clustered by district. The running variable is the extremist primary candidate’s vote share winning margin in the primary.
Extremists Appear to Galvanize the Opposing Party’s Base
Who turns out in response to extremist versus moderate nominees? We have seen that extremist nominees seem to skew the electorate away from the party. This could be due to a number of possible compositional effects. For example, extremists could increase turnout in their own base but increase turnout in the opposing party’s base more, or extremists could depress turnout in their own base but depress it less (or increase it) in the opposing party’s base. Moreover, extremist nominees could affect party identification or registration—because significant numbers of voters register in between the primary and the general—and/or it could affect who chooses to turn out among those already registered or who already identify with a particular party.
Although we are inevitably limited by the amount of data we have, we can carry out some simple tests to see which party’s base seems to be affected more by extremist nominees. Specifically, we reestimate the RD with three new outcome variables, estimated for each of the two parties. The first is the rate at which members of each party turn out—so, in an observation corresponding to a Republican primary, for example, this variable would be the fraction of all CCES respondents identifying with the Republican party in that district and year who are validated to have turned out, and the other would be the analogous fraction for Democratic voters in the district. We stress that this rate variable is different from the turnout share variable we have been using as the outcome variable thus far in the article. Recall once more our example from the Data section. There we supposed that 100 Democrats and 200 Republicans turned out, so that the Democratic turnout share was 33% (100/(100+200)). But, we supposed that there were 250 members of each party sampled, so the Democratic turnout rate would be 40% (100/250). As we discussed in the Data section, we define Democrats as those on the seven-point scale who report being strong, not very strong, or leaning Democrats (and likewise for Republicans). The two remaining variables are simply the numerator and denominator of this turnout rate—the number of respondents who turn out for that party in the district and the number of respondents in the district who identify (at least weakly) with that party, respectively.
Table 6 presents the results. Though we are limited by the sample size and cannot draw strong conclusions, opposing-party voters appear to turn out at higher rates than own-party voters. That is, when a party nominates an extremist, voters of the other party turn out at a higher rate than the party’s own voters do. We cannot reject the null that the effects are the same, but the differences are consistent across all four specifications and are substantively large. For example, in the first and fifth columns, we see that the nomination of an extremist is estimated to increase own-party turnout by three percentage points but is estimated to increase opposing party turnout by nine percentage points.
TABLE 6. Effect of Extremist Nominee on Rates of Partisan General-Election Turnout, US House, 2006–2014

Robust standard errors clustered by district in parentheses in columns 1–3 and 5–7; standard errors in columns 4 and 8 come from the rdrobust package and are clustered by district. The running variable is the extremist primary candidate’s vote-share winning margin in the primary. In the first row, the dependent variable is the total number of CCES respondents in the party who turned out to vote divided by the total number of respondents identifying with the party. The second- and third-row dependent variables are the numerator and denominator of this ratio, respectively.
To investigate specifically whether the effect on opposing-party turnout is bigger than on own-party turnout, we can also reestimate the RD with the difference in the rate of turnout between opposing-party voters and own-party voters as the outcome variable. To convey the findings from this exercise succinctly, Figure 4 plots the resulting RD estimate across all possible RD bandwidths. We use the third-order polynomial specification for this because it is generally the most conservative specification in our analyses, and in this instance, as can be seen in Table 6, it finds the smallest difference in effects and thus biases us against finding a large difference. As the resulting figure shows, we find consistent, though still somewhat imprecise, evidence that extremist nominees affect opposing-party turnout more than own-party turnout.
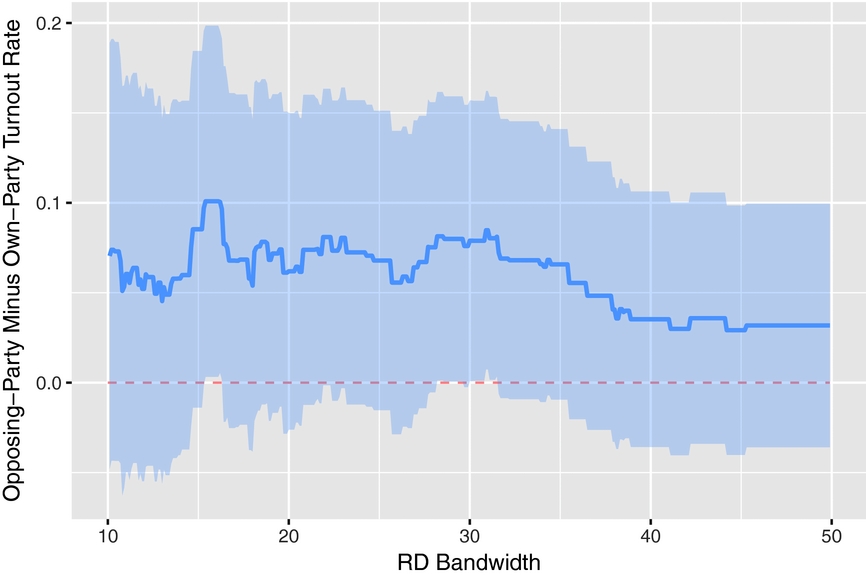
FIGURE 4. Difference in Effect of Extremist Nominee on Turnout Rate, Opposing-Party Voters Minus Own-Party Voters. Across bandwidths, we see consistent though imprecise evidence that extremist nominees affect opposing-party turnout more than own-party turnout.
The second row of Table 6 shows estimated effects on the number of voters from each party who turn out to vote, the numerator for the rate variable estimated in the first row. Here we find negative estimates for the party holding the primary and small but positive estimates for the opposing party—all insufficiently large or precise to reject the null of no effect. In the third row, we estimate effects on the number of respondents who identify with the party in the district, the denominator for the rate variable estimated in the first row. Fewer voters in both parties appear to identify with a party after an extremist nominee, though effects look quite a bit larger for the party holding the primary (first four columns.) Again, we cannot reject the null of no difference because of the limited sample sizes. Nevertheless, the negative estimates across both parties, and the fact that they are more negative for the party holding the primary, does seem consistent with the possibility that extremist nominees wage less effective, less active campaigns, with less support for party elites than moderate nominees do.
Putting these results together, it appears that the overall effect of extremist nominees on turnout is driven by a concentrated group of opposing-party voters who turn out at higher rates in response to extremists.
CONCLUSION
This article engages with a long-standing debate over the relative strengths of extreme legislative candidates, thought to boost turnout among their party’s base, and moderate candidates thought to attract hypothetical moderate swing voters. Academics, political practitioners, and pundits have long disagreed about how candidates of varying ideologies perform electorally, as well as about the mechanisms that determine these electoral outcomes. While the institutional literature suggests that more moderate candidates tend to do better, survey-based behavioral work has gone so far as to suggest ideology is entirely irrelevant, with moderate candidates receiving no electoral advantage whatsoever. Resolving these disagreements is key for understanding how the electoral process contributes to the gridlock and polarization among our elected officials.
We have added to this debate by examining how general-election voters respond to the nomination of more or less extreme candidates. Using several different empirical strategies, we have found consistent evidence that extremist nominees do poorly in general elections in large part because they skew turnout in the general election away from their own party and in favor of the opposing party. On the one hand, this result seems to be in keeping with the institutional literature’s findings that moderate candidates outperform extremist ones, electorally speaking, and contrary to claims in the behavioral literature that candidate ideology is irrelevant. On the other hand, the results suggest that much of moderate candidates’ success may actually be due to the turnout of partisan voters, rather than to swing voters who switch sides. In fact, our regression discontinuity estimates are consistent with the possibility that the bulk of the vote-share penalty to extremist nominees is the result of changes in partisan turnout. Seen in this light, the results are more consistent with the behavioral literature’s focus on turnout than they are with the institutional literature’s theoretical focus on swing voters. As such, we see this article as helping to link the behavioral and institutional literatures together, suggesting that moderate candidates do possess an electoral advantage but that this advantage may depend heavily on turnout-based mechanisms.
The article can also help revise formal theories that consider this same question of turning out the base. We have made the simple point that, under the standard kinds of utility functions that these theories suppose voters possess, voters in the opposite party should actually have a stronger incentive to turn out when an extremist is nominated, because the extremist is so far away from them ideologically. Our follow-up analyses on turnout among base voters and among self-identified extremist voters are consistent with our claim. Extremists appear to do little to galvanize turnout in their own party—although the precision of these estimates does not rule out the possibility that they increase own-party turnout—but they do seem to galvanize the opposing party.
In considering our results, we should be clear that they do not resolve the debate over how informed or “rational” voters are. It is entirely possible that extremist nominees increase the opposing party’s turnout because voters in the opposing party are aware of the extremist, are turned off by the extremist’s positions and other attributes, and turn out to vote as a result. But it is equally possible that other mechanisms are at play. Elites, party organizations, campaigns, and the media all play a role. Voter turnout is not only the result of individuals’ rational calculations but, we know, responds to the strategic activities of canvassers, advertisers, and others (e.g., Green and Gerber Reference Green and Gerber2008). Separating out these mechanisms is, we suspect, a very promising avenue for future research. But whatever the mechanism, more extreme candidates in our sample do worse than more moderate candidates in US House elections in large part because they fail to galvanize their own base and instead encourage voters in the opposing party to turn out and vote against them.
SUPPLEMENTARY MATERIAL
To view supplementary material for this article, please visit https://doi.org/10.1017/S0003055418000023.
Replication material can be found on Dataverse at: https://doi.org/10.7910/DVN/9ZYFBX


 Open access
Comments
No Comments have been published for this article.