


1. Introduction
The water-entry problem exists in many engineering fields, such as water entry of vehicles, the airdrop of aircraft, the water landing of seaplanes and spacecraft and the wave slamming of ships, etc. (Seddon & Moatamedi Reference Seddon and Moatamedi2006; Fang et al. Reference Fang, Ming, Wang, Meng and Zhang2022; Ju et al. Reference Ju, Sun, Shen, Chen and Zhang2023; Kong et al. Reference Kong, Liu, Ma and Zhang2023; Sun et al. Reference Sun, Sun, Zhang and Ren2023; Zhao, Yang & Ming Reference Zhao, Yang and Ming2023a). High-speed water entry is a transient and strongly nonlinear process involving crossing air and water interfaces, and many complex flows, such as violent water surface splashing and various characteristics of cavity evolution, always occur; these flows are strongly related to the strong impact loads and drastic motions of the body entering the water (Truscott, Epps & Belden Reference Truscott, Epps and Belden2014; Shi, Hua & Pan Reference Shi, Hua and Pan2020; Sui et al. Reference Sui, Ming, Wang and Han2023). Fully understanding the flow mechanism of the water-entry cavity is an important research direction. Cavity evolution includes the cavity formation, growth and collapse, and these phenomena have attracted much attention. Many studies have discussed the influence of various parameters on the cavity evolution, including the initial velocity, angle of water entry and geometry of the body, etc.
In experiments on the vertical water entry of spheres, physical phenomena such as free surface splashing, cavity formation and collapse were captured and analysed by photography for the first time (Worthington & Reynolds Reference Worthington and Reynolds1883). Then, considering many factors, such as the air density, impact velocity, added mass coefficient and critical speed, the elementary law of cavity evolution was gradually developed and an ideal cavity model was obtained (Gilbarg & Anderson Reference Gilbarg and Anderson1948; May & Woodhull Reference May and Woodhull1950; May Reference May1951, Reference May1952). Until the 1960s, the classical model of the independent expansion of cavity cross-sections was proposed based on the potential flow theory (Logvinovich Reference Logvinovich1972), and described the basic physical process of cavity cross-section expansion from a theoretical perspective. Then, the cavity dynamic analytical model during high-speed water entry of a sphere was established based on the energy conservation theorem (Lee, Longoria & Wilson Reference Lee, Longoria and Wilson1997). After some time, a dynamic model of a transient cylindrical cavity with a low Froude number was proposed that accurately predicted the existence of two different deep-closure types observed in the experiment (Duclaux et al. Reference Duclaux, Caillé, Duez, Ybert, Bocquet and Clanet2007). Subsequently, many researchers extended the application of the transient cavity dynamic model to a larger range of Froude numbers (Bergmann et al. Reference Bergmann, Van Der Meer, Gekle, Van Der Bos and Lohse2009; Aristoff et al. Reference Aristoff, Truscott, Techet and Bush2010; Guo et al. Reference Guo, Zhang, Xiao, Wei and Ren2012; Chen et al. Reference Chen, Ma, Wei and Wang2018). Bergmann et al. (Reference Bergmann, Van Der Meer, Gekle, Van Der Bos and Lohse2009) studied the asymmetry of radial expansion and contraction stages by introducing different parameter values controlling the timing of the cavity dynamics into the theoretical model and found better agreement between theory and the radial dynamics of the cavity at the cross-section in the deep-closure depth. However, these studies did not discuss the motion of the free surface and the details of the flows inside and outside the cavity closure area. In theoretical modelling, the gas flow inside the cavity is generally ignored, and it is assumed that the fluid around the free surface flows entirely in the radial direction. While these assumptions may have a negligible impact during low-speed water entry, estimating their influence becomes challenging during high-speed water entry with transient and complex flow phenomena.
Four distinct types of cavity seal and related dimensionless variable parameters during the water entry of spheres were revealed (Aristoff & Bush Reference Aristoff and Bush2009; Speirs et al. Reference Speirs, Mansoor, Belden and Truscott2019). With the use of particle image velocimetry, it is observed that the air jet caused by cavity deep collapse can even reach a supersonic speed when the disk enters the water at a low speed (Gekle et al. Reference Gekle, Peters, Gordillo, van der Meer and Lohse2010). Compared with the results of the incompressible hypothesis, the influence of the air compressibility on the cavity dynamics is crucial (Peters et al. Reference Peters, Gekle, Lohse and van der Meer2013). Moreover, the airflow caused by deep closure will suppress the downward jet, and the upward jet will further turn into an irregular and asymmetric jet (Mansoor et al. Reference Mansoor, Marston, Vakarelski and Thoroddsen2014). Researchers have also used different numerical methods to study cavity evolution under the influence of body shape and motion parameters and explored the characteristics of cavity flow and the coupling effect between the cavity and body (Erfanian et al. Reference Erfanian, Anbarsooz, Rahimi, Zare and Moghiman2015; Shentu et al. Reference Shentu, Zhao, Li and Zhao2019; Li et al. Reference Li, Zhao, Kong, Shentu, Wang and Huang2020; Sun & Wu Reference Sun and Wu2020; Du et al. Reference Du, Wang, Wang, Wang, Qiu and Huang2022; Yuan et al. Reference Yuan, Hong, Zhao and Gong2022; Zhang et al. Reference Zhang, Ming, Liu, Liu and Zhang2023b). The collapse of a jet in high-speed water entry affects the projectile motion according to the finite volume method (Zhang et al. Reference Zhang, Zong, Sun, Yu and Li2021). An improved multiphase fluid–structure coupling method was proposed to simulate high-speed water entry (Liu et al. Reference Liu, Zhang, Miao, Ming and Liu2023), and the formation mechanism of tail slamming of different nose-shaped vehicles entering water at high speed was investigated in detail for the first time.
Overall, for water entry at a low speed (e.g. less than  $20\ {\rm m}\ {\rm s}^{-1}$), the main concerns are the splashing of the free surface, the pinch-off of the cavity, etc. Influential factors such as the hydrophilic and hydrophobic properties of the body surface, the viscosity and surface tension of the fluid and gravity are important in this scenario (Aristoff & Bush Reference Aristoff and Bush2009; Truscott & Techet Reference Truscott and Techet2009a,Reference Truscott and Techetb; Yan et al. Reference Yan, Liu, Kominiarczuk and Yue2009; Enriquez et al. Reference Enriquez, Peters, Gekle, Schmidt, Lohse and van der Meer2012; Kintea et al. Reference Kintea, Breitenbach, Thammanna Gurumurthy, Roisman and Tropea2016; Vincent et al. Reference Vincent, Xiao, Yohann, Jung and Kanso2018). However, as the water-entry speed increases (e.g. more than $100\ {\rm m}\ {\rm s}^{-1}$), additional phenomena must be considered. These include cavity pulsation, cavity expansion and contraction and interactions between the cavity and the body, etc. In this case, the hydrophilic and hydrophobic properties, viscosity, surface tension and gravity are no longer the dominant factors for cavity evolution. Rather, the key factor is the inertial force, and the compressibility of the fluid becomes more apparent. This type of water entry can be referred to as high-speed water entry.
While researchers have extensively studied the radial evolution of high-speed water-entry cavities (Guo et al. Reference Guo, Chen, Mu and Zhang2020; Treichler & Kiger Reference Treichler and Kiger2020), little attention has been given to the asymmetry of cavity expansion and contraction durations and the factors contributing to this asymmetry. The cavity of water entry will also be affected by various boundaries, such as the free surface and solid walls, etc. (Mansoor et al. Reference Mansoor, Marston, Vakarelski and Thoroddsen2014; Guo et al. Reference Guo, Chen, Mu and Zhang2020; Li et al. Reference Li, Zhang, Cui, Li and Liu2023; Zhang et al. Reference Zhang, Li, Cui, Li and Liu2023a; Li et al. Reference Li, Zhao, Zhang and Han2024). Previous research, such as that by Treichler & Kiger (Reference Treichler and Kiger2020) and Zhang et al. (Reference Zhang, Zong, Sun, Yu and Li2021), has acknowledged the impact of the free surface on the cavity. Treichler & Kiger (Reference Treichler and Kiger2020) simply pointed out that the three-dimensional effect, in the form of axial flow near the free surface, will affect the cavity behaviour but did not undertake further in-depth research. Additionally, when the projectile impacts the water through the ice hole, the ice hole boundary suppresses the splash and jet, resulting in a change in the closure form of the cavity (Cui et al. Reference Cui, Zhang, Zhang and Sun2023). It has been observed that, during low-speed oblique water entry, the cavity evolution is influenced by free surface splashing (Zhao et al. Reference Zhao, Hong, Gong and Liu2023b). However, in the context of high-speed water entry, where the impact load is greater and the expansion and contraction of the water-entry cavity are more intense, in-depth investigations are still necessary to reveal the intricate mechanisms of how the free surface, as a natural physical boundary condition, affects the cavity dynamics.
In the present work, the Euler finite element method is used to investigate cavity evolution during high-speed vertical water entry. The free surface effect is confirmed through comparisons between the numerical results and the predicted results of transient cavity dynamics theory. This study reveals the asymmetry in the durations of cavity expansion and contraction during high-speed water entry. The effects of free surface motion and cavity closure on the expansion and contraction are discussed in detail, considering the velocity distribution of the flow field and the internal pressure inside the cavity. The remainder of the paper is organized as follows: in § 2, the numerical model is introduced and the calculation accuracy and convergence are verified. In § 3, the two categories of cavities are distinguished by applying previous classification methods and are discussed from the perspective of cavity cross-sections. Building upon this foundation, the effects of free surface motion on cavity expansion and contraction in high-speed water entry are emphasized and the origin of the asymmetry of the expansion and contraction durations is explained. Finally, the conclusions are presented in the § 4.
2. Numerical model
2.1. Governing equations and multiphase Eulerian finite element method
In high-speed water entry, the Froude number is usually very high and the inertial force is the key factor. Therefore, it is reasonable to ignore the influence of heat conduction, viscosity and surface tension. The Euler finite element method (EFEM) is an efficient and accurate approach for computational fluid dynamics simulations of water entry (Tian et al. Reference Tian, Zhang, Liu and Wang2021; Liu et al. Reference Liu, Zhang, Miao, Ming and Liu2023). The EFEM has the unique advantage of dealing with arbitrarily large deformations of interfaces and is suitable for solving multiphase flow problems when a body enters water at a high speed. The Euler governing equations of inviscid fluid (Anderson Reference Anderson1995) are as follows:
 \begin{gather} \frac{\partial\rho}{\partial {t}}+\boldsymbol{\nabla}\boldsymbol{\cdot}(\rho{{\boldsymbol{v}}})=0 , \end{gather}
 \begin{gather}\frac{\partial\rho{\boldsymbol{v}}}{\partial {t}}+\boldsymbol{\nabla}\boldsymbol{\cdot}(\rho {{\boldsymbol{v}}}\otimes{\boldsymbol{v}})=\rho{\boldsymbol{g}}+{\boldsymbol{f}}-\boldsymbol{\nabla}{p} , \end{gather}
 \begin{gather}\frac{\partial\rho{e}}{\partial {t}}+\boldsymbol{\nabla}\boldsymbol{\cdot}(\rho e {\boldsymbol{v}})={-}{p}\boldsymbol{\nabla}\boldsymbol{\cdot}{\boldsymbol{v}}, \end{gather}
where e is the internal energy,  $\rho$ is the fluid density, ${\boldsymbol {v}}$ is the fluid velocity, p is the fluid pressure, ${\boldsymbol {g}}$ is the gravitational acceleration and ${\boldsymbol {f}}$ is the body force due to the interaction between the fluid and the body.
The above Eulerian governing equations (Liu et al. Reference Liu, Zhang, Tian and Wang2019) can be written in a general conservation form
 \begin{equation} \frac{\partial\varPhi}{\partial {t}}+\boldsymbol{\nabla}\boldsymbol{\cdot}(\varPhi{{\boldsymbol{v}}})={\boldsymbol{S}} , \end{equation}
where  $\varPhi$ is the fluid conservation variable and ${\boldsymbol {S}}$ is the source term. According to the vector identity, (2.4) can be written as
 \begin{gather} \frac{\partial\varPhi}{\partial \textit{t}}+{\boldsymbol{v}}\boldsymbol{\cdot}\boldsymbol{\nabla}\varPhi+\varPhi\boldsymbol{\cdot} \boldsymbol{\nabla}{{\boldsymbol{v}}}={\boldsymbol{S}} , \end{gather}
 \begin{gather}\varPhi = \left[\begin{array}{c} \rho \\ \rho {v}_i \\ \rho {e} \end{array} \right] ,\quad {\boldsymbol{S}} = \left[ \begin{array}{c} 0 \\ \rho g_i+f_i-\left( \boldsymbol{\nabla} p\right)_i \\ -p\boldsymbol{\nabla}\boldsymbol{\cdot}{{\boldsymbol{v}}} \end{array} \right] , \end{gather}
where the subscript i indicates the three components in the three axial directions of the coordinate system  $(xyz)$.
In this paper, the volume of fluid (VOF) method is used to solve the multiphase flow in the water-entry process. The convection equation of the VOF (Hirt & Nichols Reference Hirt and Nichols1981) is
 \begin{equation} \frac{\partial\alpha_j}{\partial {t}}+{{\boldsymbol{v}}}\boldsymbol{\cdot}\boldsymbol{\nabla}\alpha_j=0 , \end{equation}
where the subscript  $j$ represents the fluid phase number and $\alpha _j$ is the volume fraction of a fluid phase $j$ and obeys $0 \leqslant \alpha _j \leqslant$ 1, $\sum _j \alpha _j =1$ in any one fluid cell. For the mixing fluid cell, the fluid can be considered a homogeneous mixture of different fluid phases, and the pressure and density of the mixed fluid are calculated as $\bar {p}=\sum \alpha _j {p}_j$ and $\bar {\rho } =\sum \alpha _j \rho _j$. By adding (2.7) to (2.4), the Eulerian governing equations for multiphase flows can be obtained. The conservation variable $\varPhi$ and the source term ${\boldsymbol {S}}$ in (2.4) take on the following forms:
 \begin{equation} \varPhi = \left[\begin{array}{c} \alpha_j \\ \alpha_j \rho_j \\ \bar{\rho}{v}_i \\ \alpha_j \rho_j {e}_j \end{array} \right] ,\quad {\boldsymbol{S}} = \left[ \begin{array}{c} \alpha_j\boldsymbol{\nabla}\boldsymbol{\cdot}{\boldsymbol{v}} \\ 0 \\ \bar{\rho} g_i+f_i- (\boldsymbol{\nabla}\bar{p})_i \\ -\alpha_j\bar{p}\boldsymbol{\nabla}\boldsymbol{\cdot}{{\boldsymbol{v}}} \end{array} \right] . \end{equation}
 Because the above equations are not closed, it is necessary to use the equation of state (EOS) to solve them. Air is assumed to be an ideal gas in the present work, and the  $\gamma$-law equation of state (Fedkiw et al. Reference Fedkiw, Aslam, Merriman and Osher1999) is used for the calculation of the gas state
 \begin{equation} p_g=\rho_{g} e_{g} \left( \gamma_{g}-1\right) , \end{equation}
where the subscript  $g$ represents the gas phase and $\gamma _g$ is the specific heat ratio. In the present work, the initial reference density of air is $\rho _{g}=1.29\ {\rm kg}\ {\rm m}^{-3}$, and $\gamma _g=1.4$. The EOS of water (Saurel et al. Reference Saurel, Le Metayer, Massoni and Gavrilyuk2007) is given by
 \begin{equation} p_l=\rho_{l} e_{l} \left( \gamma_{l}-1\right)-\gamma_{l}p_{w} , \end{equation}
where the subscript  $l$ is the liquid phase, $\gamma _{l}$ and ${P}_w$ are obtained from the shock Hugoniot experiment. For the water in the present work, the initial reference density is $\rho _{l}=1000.0\ {\rm kg}\ {\rm m}^{-3}$, $\gamma _l=7.15$, and ${p}_w =3.3089\times 10^{8}$ Pa.
Separation of the advection term from the Eulerian equation through the use of the operator split technique is the crucial step in the solution of the EFEM (Benson Reference Benson1992). With this solution method, (2.5) can be divided into the following two equations:
 \begin{gather} \frac{\partial\varPhi}{\partial {t}}+\varPhi\boldsymbol{\cdot}\boldsymbol{\nabla}{{\boldsymbol{v}}}={\boldsymbol{S}} , \end{gather}
 \begin{gather}\frac{\partial\varPhi}{\partial {t}}+{{\boldsymbol{v}}}\boldsymbol{\cdot}\boldsymbol{\nabla}\varPhi=0 . \end{gather}
 Therefore, two steps are carried out to solve the above equations. In the first step, the symbol  ${\partial }/{\partial t}$ in the (2.11) is replaced by ${{\rm D}}/{{\rm D}t}$, so that it becomes the standard Lagrangian governing equation. Due to the absence of a convection term in (2.11), the traditional explicit finite element method can be used to solve it; that is, the fluid material is fixed on the node of the element, and the element deforms with the motion of the fluid. In the second step, the nodes of deformed elements are moved back to their original positions. Equation (2.12) is solved by calculating the transported fluid volume between adjacent elements, and the related variables are updated through the transport equation. After solving the advection term, the pressure of the fluid is updated by the EOS. The detailed procedure for the solution of the EFEM is described in previous reports (Benson Reference Benson1992; Liu et al. Reference Liu, Zhang, Tian and Wang2019, Reference Liu, Zhang, Miao, Ming and Liu2023), and therefore it will not be discussed here.
2.2. Improved immersed boundary method and motion equations of a rigid body
In the numerical simulation, the penalty immersed boundary (IB) method is used to realize the coupling between the Lagrangian solid mesh of the body and the Eulerian mesh of the fluid (Benson & Okazawa Reference Benson and Okazawa2004; Aquelet, Souli & Olovsson Reference Aquelet, Souli and Olovsson2006; Wang & Guedes Soares Reference Wang and Guedes Soares2014). The IB method ensures a consistent motion at the coupling interface between the body and the fluid. The conservation of the total momentum is realized through the calculated coupling force. The basic idea of the improved IB method (Liu et al. Reference Liu, Zhang, Miao, Ming and Liu2023) adopted in the paper is illustrated in figure 1. By applying the force  ${\boldsymbol {F}}$ and reaction force $-{\boldsymbol {F}}$ on the fluid and the body along the outward normal direction of the body boundary, respectively, the coupling at the interface is realized. Moreover, momentum conservation and interface consistency are guaranteed.

Figure 1. A schematic of the IB method adopted in the paper. Lagrangian nodes represent the body boundary nodes, fictitious fluid points represent the fictitious fluid nodes corresponding to the body boundary nodes;  ${\boldsymbol {n}}$ is the outward unit normal vector of the body boundary, ${\boldsymbol {v}}_s$ is the body boundary velocity, ${\boldsymbol {v}}_f$ is the fictitious fluid node velocity and ${\boldsymbol {F}}$ is the coupling force. After the coupling force is applied, the fluid boundary at time $t$ will move to the same position as the body boundary at time $t+\Delta t$, and an equal and opposite force $-{\boldsymbol {F}}$ will be applied to the body.
During water entry, the body impacts the water at a velocity of  ${\boldsymbol {v}}_s$, and the original velocity of the fluid is zero. To ensure consistency at the interface and to eliminate the velocity difference between the fluid and body boundary, the coupling force ${\boldsymbol {F}}$ can be applied in a coupling element according to
 \begin{equation}
{\boldsymbol{F}}=\bar{m}\frac{({{\boldsymbol{v}}}_s-{{\boldsymbol{v}}}_f)}{\Delta
t}{\boldsymbol{n}} ,
\end{equation}
\begin{equation}
{\boldsymbol{F}}=\bar{m}\frac{({{\boldsymbol{v}}}_s-{{\boldsymbol{v}}}_f)}{\Delta
t}{\boldsymbol{n}} ,
\end{equation}
where  ${\boldsymbol {n}}$ is the outward normal vector of the body boundary and $\bar {m}$ is the mass of the fictitious fluid point on the body boundary at time $t$ obtained by the interpolation method
 \begin{equation} \bar{m}=\sum_\varOmega m \left( {\boldsymbol{x}}^{f}, t\right) \delta\left({\boldsymbol{x}}^{f}, {\boldsymbol{x}}^{s},t \right) , \end{equation}
where  $\delta$ is the distribution function that depends only on the distance factors and $m$ is the fluid mass of the mesh nodes in the coupling element. Here, ${\boldsymbol {x}}^{f}$ represents the position of the fluid mesh nodes of the coupling elements and ${\boldsymbol {x}}^{s}$ is the position of the body boundary nodes. Equation (2.14) contains the sum of the masses of the surrounding fluid mesh nodes in the coupling element. Thus, the coupling force ${\boldsymbol {F}}$ can be distributed to each node in the coupling element, and the coupling force ${\boldsymbol {f}}$ on the fluid nodes is given by
 \begin{equation} {\boldsymbol{f}}=m
\left( {\boldsymbol{x}}^{f}, t\right)
\delta\left({\boldsymbol{x}}^{f},
{\boldsymbol{x}}^{s},t \right)
\frac{({{\boldsymbol{v}}}_s-{{\boldsymbol{v}}}_f)}{\Delta
t}{\boldsymbol{n}} .
\end{equation}
\begin{equation} {\boldsymbol{f}}=m
\left( {\boldsymbol{x}}^{f}, t\right)
\delta\left({\boldsymbol{x}}^{f},
{\boldsymbol{x}}^{s},t \right)
\frac{({{\boldsymbol{v}}}_s-{{\boldsymbol{v}}}_f)}{\Delta
t}{\boldsymbol{n}} .
\end{equation}The improved IB method can solve the problems of multiphase flow with large density ratios during high-speed water entry, and has good computational applicability. More details about the improved IB method can be found in previous work reported in the literature (Liu et al. Reference Liu, Zhang, Miao, Ming and Liu2023).
A numerical model of a projectile entering water at a high velocity is established as displayed in figure 2. The initial water-entry velocity is  $v_{0}$. The computational domain size is $L \times W \times H$, and the water field depth is $d_w$. The boundary of the computational domain can be set as a rigid wall condition or non-reflecting boundary condition according to the actual situation. In addition, the local coordinate system and the global coordinate system are defined in figure 2. The rigid body motion equations in six degrees of freedom are used to solve the motion of the projectile, including translation and rotation equations (Fossen Reference Fossen1994), which are given as
 \begin{gather} M\left( \dot{{\boldsymbol{V}}}_{G}^{b}+\boldsymbol{\omega}^{b} \times {\boldsymbol{V}}_{G}^{b}\right) = {\boldsymbol{F}}_{0}^{b} , \end{gather}
 \begin{gather}\boldsymbol{J}_{G}\dot{\boldsymbol{\omega}}^{b}+\boldsymbol{\omega}^{b} \times \left( \boldsymbol{J}_{G} \boldsymbol{\omega}^{b}\right) = {\boldsymbol{T}}_{0}^{b} , \end{gather}
where the superscript b indicates the variable in the local coordinate system,  $M$ is the total mass of the rigid body, ${\boldsymbol {V}}_{G}^{b}$ and $\boldsymbol {\omega }^{b}$ are the translation and rotation velocities, respectively, at the gravity centre of the rigid body in the local coordinate system and $\boldsymbol{\mathsf{J}}_{G}$ is the inertia matrix in the local coordinate system relative to the gravity centre of the body. In addition, ${\boldsymbol {F}}_{0}^{b}$ and ${\boldsymbol {T}}_{0}^{b}$ are the resultant forces and resultant moments acting on the body in the local coordinate system, respectively; ${\boldsymbol {F}}_{0}^{b}$ and ${\boldsymbol {T}}_{0}^{b}$ are solved in the global coordinate system and are then transformed into the local coordinate system by the rotation matrix $\boldsymbol{\mathsf{R}}$
 \begin{gather} {\boldsymbol{F}}_{0}^{b}=\boldsymbol{\mathsf{R}}\left( {\boldsymbol{F}}_{f}+M{\boldsymbol{g}}\right) , \end{gather}
 \begin{gather}{\boldsymbol{T}}_{0}^{b}=\boldsymbol{\mathsf{R}} {\boldsymbol{T}}_{f} . \end{gather}
Figure 2. Schematic illustration of the computational model of the high-speed water entry of a projectile. The initial water-entry velocity of the projectile is  $v_{0}$. The dimensions of the computational fluid domain (including water and air) are $L \times W \times H$, and the water field depth is $d_w$. Local coordinate system ( $x^{b} y^{b} z^{b}$) is fixed with the gravity centre ${\boldsymbol {G}}$ of the projectile. Global coordinate system (xyz) is established at the cross-point of the projectile rotating axis and free surface. The diameter of the flat-nose projectile is D, and the length of the projectile is $L_{cyl}$.
Based on the mentioned IB method and rigid body motion equations, the trajectory and attitude of a projectile during high-speed water entry can be numerically solved in this paper.
2.3. Validations and comparisons
Regarding the cavity evolution of a revolving body during water entry, the transient cavity model was proposed by previous studies and the evolution process of the cavity was simplified into a typical Besant–Rayleigh problem. The cavity radius is given based on the potential flow theory and the assumption of independent expansion of the cavity cross-section. The model has been extensively used in the theoretical analysis of the water-entry cavity of revolving bodies such as spheres, cylinders, etc. In this paper, the formula for the cavity of a cylindrical projectile water entry is taken from previous studies (Duclaux et al. Reference Duclaux, Caillé, Duez, Ybert, Bocquet and Clanet2007; Guo et al. Reference Guo, Zhang, Xiao, Wei and Ren2012; Zhang et al. Reference Zhang, Zong, Sun, Yu and Li2021), as follows:
 \begin{equation} {R}_{c}^{2}={R}_{0}^{2}+2R_{0}\kappa {u}_{z}\left( t-t_{z}\right) -\frac{\Delta {P}}{\rho_{l}{N}}\left( t-t_{z}\right)^{2} . \end{equation}
 Equation (2.20) describes the cavity radial evolution at a certain depth z below the water surface. The time for the projectile to reach the water depth  $z$ is defined as $t_{z}$, where $R_{c}$ is the cavity radius, $R_{0}$ is the radius of the projectile, ${u}_{z}$ is the projectile velocity when its head reaches the underwater depth z, $\Delta {P}$ is the pressure difference between the ambient pressure $P_{\infty }$ at the underwater depth z plane and the internal pressure $P_{cavity}$ in the cavity (Aristoff & Bush Reference Aristoff and Bush2009; Bergmann et al. Reference Bergmann, Van Der Meer, Gekle, Van Der Bos and Lohse2009), N is the dimensionless geometric parameter that represents the disturbance range of the cavity evolution and $\kappa$ is the coefficient indicating the relationship between the initial cavity wall velocity and the projectile velocity and is smaller than 1.
To verify the accuracy of the numerical model and compare the theory with the numerical method, an experiment is conducted to observe a high-speed projectile entering water. Figure 3 illustrates the experimental set-up used in this study. The projectile is launched into the water tank using a gas gun, and a tachymeter is positioned at the outlet of the launch tube to measure the projectile's velocity. A high-speed camera ( $13\,000\ {\rm frames}\ {\rm s}^{-1}$) is used to capture the cavity evolution of the projectile entering the water tank. The experimental details are as follows: a flat-nose projectile with a diameter $D$ of 8 mm and a length $L_{cyl}$ of 40 mm enters the water vertically with an initial velocity of $v_{0} =71.5\ {\rm m}\ {\rm s}^{-1}$. The Froude number is defined as $Fr\equiv v_0/\sqrt {gD}$, and the corresponding Froude number of the experimental water-entry velocity is $Fr=255.4$. The projectile material is made of aluminium alloy and has a total mass is $m=5.5$ g. The centre of gravity is located at a distance of 20 mm from the head. The water tank used in the experiment has the dimensions of $L \times W \times H = 0.8\ {\rm m}\times 0.8\ {\rm m}\times 0.6 {\rm m}$, and it is filled with water to a depth of $d_{w}=0.5$ m, matching the computational domain shown in figure 2. The upper boundary of the computational domain is set as a non-reflecting boundary condition. The total pressure exerted on the boundary is equal to the sum of the atmospheric pressure and the dynamic pressure, as described in the literature (Liu et al. Reference Liu, Zhang, Tian and Wang2018). The other boundaries are set as rigid wall boundary conditions. The grid sizes of the computational flow field refinement region are selected as $D/ \Delta x =12, 20, 28$ and 36 to verify the convergence of the numerical model. As plotted in figure 4(a), the numerical penetration depth results of the projectile converge to the experimental data with decreasing grid size, with good agreement obtained for $D/ \Delta x =36$. That is, the numerical model shows good convergence and good accuracy. In addition, the cavity diameter evolutions at 40 and 120 mm below the water surface are compared in figures 4(b) and 4(c). The results based on the transient cavity theory are also plotted. The $\kappa$ and N coefficients are 0.57 and 1.67, respectively (Zhang et al. Reference Zhang, Zong, Sun, Yu and Li2021). While the numerical and theoretical results show good agreement overall with the experimental data, a certain difference between the numerical and theoretical results is observed in the later stage of the cavity evolution. This deviation is the problem that will be further investigated in the paper, and will be discussed in detail in the following sections.

Figure 3. Schematic illustration of the experimental set-up. The water tank is made of transparent acrylic material, making it easy to shoot with a high-speed camera. The gas gun is installed above the water tank centre perpendicular to the water surface. A set of lights is placed behind the water tank.

Figure 4. Comparisons of the experimental and numerical results: (a) the time history of the vertical penetration depth of the projectile, (b,c) the cavity diameter evolution on the cross-section. The underwater depths are 40 and 120 mm, respectively.
The cavity evolutions from the experimental and numerical results are depicted in figure 5. Overall, the numerical results exhibit good agreement with the experimental results. However, there are slight differences in the shapes of the tiny break-off bubbles. This may be attributed to the interface tracking algorithm in this small area, which necessitates a more refined mesh for accurate simulation. Unfortunately, such refinement is too expensive. Nevertheless, the tiny break-off bubbles will not impact the cavity evolution. In conclusion, the above comparisons demonstrate the high accuracy and convergence of the numerical model for high-speed water entry established in this paper.

Figure 5. Comparisons of the cavity shapes from the experimental results (in black and white) and numerical simulations (in colour) at different moments.
3. Results and discussions
3.1. Representative characteristics of cavity evolution in high-speed water entry
The representative characteristics of cavity evolution in high-speed water entry can be roughly divided into two categories: type I and type II. Type I refers to cavities that collapse consecutively after surface closure, while type II refers to cavities that experience deep closure. The evolution process of both types of cavities in this study is in agreement with the findings of previous studies reported in the literature (Gilbarg & Anderson Reference Gilbarg and Anderson1948; May Reference May1952; Zhang et al. Reference Zhang, Zong, Sun, Yu and Li2021). Figure 6(a) shows an example of a type I cavity, with an initial water-entry velocity of  $v_0=100\ {\rm m} {\rm s}^{-1}$ ( $Fr=357.1$). The dimensionless time is defined as $t^{*}=t{\cdot }( D/v_{0})^{-1}$. Figure 6(b) illustrates a type II cavity, with an initial water-entry velocity of $v_0=200\ {\rm m}\ {\rm s}^{-1}$ ( $Fr=714.3$). The early evolution ( $t^{*}=25.0\sim 100.0$) of the cavity of type II is similar to that of type I.

Figure 6. Representative characteristics of cavity evolution in high-speed water entry. (a) The initial impact velocity  $v_0=100\ {\rm m}\ {\rm s}^{-1}$ ( $Fr=357.1$). (b) The initial impact velocity $v_0=200\ {\rm m}\ {\rm s}^{-1}$ ( $Fr=714.3$). Here, $z$ is the measurement depth under the free surface, and D is the diameter of the projectile.
Nevertheless, for the type II cavity, the tail jet collides with the cavity wall, resulting in annular tail break-off. This is followed by deep closure, resulting in rapid collapse of the cavity both upwards and downwards from the closure area. When  $t^{*}=237.5$, the water jet caused by the deep closure also hits the projectile but with a lower impact force compared with the jet impact in the cavity of type I, as displayed in figure 7. In contrast to previous studies, the subsequent study will focus on the asymmetry of the cavity expansion and contraction durations, which will be shown to be related to the free surface motion and the cavity closure.

Figure 7. Time histories of the axial force coefficient of the projectile for various water-entry velocities. The axial force coefficient is  $C_{{\rm d}\kern0.7pt x}={8{F}_{xb}}/{\rho v_{0}^{2}{\rm \pi} D^{2}}$, where ${F}_{xb}$ is the force acting on the projectile on the $x^{b}$ axis of the local coordinate system (refer to the definition of the coordinate system in figure 2), $v_{0}$ is the initial water-entry velocity, the axial force opposite to the water-entry velocity is negative, $\rho$ is the water density and $D$ is the diameter of the projectile. The small interior plot displays the upward axial force of the projectile hitting the calm water surface at the early time of water entry. The larger plot shows the result of the jet impacting the projectile, forcing it downward.
The division of the cavity evolution stages in the transverse section with a measurement depth of  $z=-20D$ is shown in figure 8, and the cavity shape and the absolute pressure distributions in the cavity cross-section and the surrounding water at the measurement depth of $z=-20D$ at several characteristic moments are given in figure 9. The non-dimensional pressure is defined as $P^{*}=P/P_{\infty }$, where $P_{\infty }$ is the ambient pressure at a certain measurement depth and is defined as $P_{\infty }=P_0+\rho g z$, where $P_0$ is the atmospheric pressure above the water's surface. The diameter of the cavity is defined as $D_{c}$. At the moment $t^{*}=30.0$ plotted in figure 8(a), the projectile head reaches the cross-section of $z=-20D$. The cavity shape and the pressure distribution in the cavity section and surrounding water at the moment $t^{*}=30.0$ are displayed in figure 9(a). The kinetic energy lost by the projectile is transformed into the energy of liquid motion in all directions, giving rise to the outward movement of the water in this section and leading to cavity wall expansion. With the continuous movement of the projectile and the further evolution of the water-entry cavity, the energy supplying the radial expansion of the cavity continuously decreases. The cavity expansion gradually slows down. The cavity diameter on the section reaches a maximum at $t^{*}=55.0$, as shown in figure 8(b). Meanwhile, the pressure inside the cavity and around the cavity wall becomes significantly lower than the ambient pressure $P_{\infty }$ of the section, as shown in 9(b). Afterwards, the cavity wall of this cross-section enters the contraction stage, and the contraction speed increases sharply. At $t^{*}=77.5$, plotted in figure 8(c), the cavity in this cross-section basically collapses completely. An obvious high-pressure area is present at the rear of the cavity, as shown in figure 9(c), and its peak value is no less than that at the initial development of the cavity cross-section. The above process is essentially in agreement with the assumption of independent expansion of the cavity cross-section in the transient cavity theory model. In addition, the numerical results exhibit good agreement with the theoretical predictions. In the following discussions, the cavity period $t_p$ from cavity formation to cavity collapse is divided into the expansion time $t_e$ and contraction time $t_c$, that is $t_p=t_e+t_c$.

Figure 8. Division of cavity evolution stages in the transverse section with a water depth of  $z=-20D$, where $t_e$ is the time of the cavity expansion stage and $t_c$ is the time of the cavity contraction stage of the cross-section. The water-entry velocity is $v_0=100\ {\rm m}\ {\rm s}^{-1}$ ( $Fr=357.1$).

Figure 9. The cavity shape and the absolute pressure distributions in the cavity cross-section and the surrounding water at the measurement depth of  $z=-20D$ at several characteristic moments noted in figure 8. The water-entry velocity is $v_0=100\ {\rm m}\ {\rm s}^{-1}$ ( $Fr=357.1$), and the black line on the cross-section represents the cavity wall.
The evolutions of the cavity diameter in the cross-section at different measurement depths with  $v_0=100\ {\rm m}\ {\rm s}^{-1}$ ( $Fr=357.1$) are given in figure 10. As the measurement depth increases, the maximum cavity diameter first increases and then decreases. At shallow measurement water depths, the expansion time of the cavity cross-section is longer than the contraction time. For example, at a measurement depth of $z=-5D$, the expansion time is $t_e=1.8$ ms, and the contraction time is $t_c=1.2$ ms. However, when the cross-section is far from the free surface, the expansion time is roughly equal to the contraction time. At a measurement depth of $z=-20D$, for instance, the expansion time is $t_e=2.0$ ms, and the contraction time is $t_c=2.0$ ms. For measurement depths greater than $z=-40D$, the evolution of the cavity cross-section becomes significantly influenced by the rapid collapse of the cavity from its rear end, i.e. consecutive collapse. Consequently, the shape of the cavity cross-section becomes irregular with an abrupt drop in the diameter soon after the start of the expansion.

Figure 10. Cavity diameter evolutions of several cavity cross-sections at different measurement depths with  $v_0=100\ {\rm m}\ {\rm s}^{-1}$ ( $Fr=357.1$).
The flow fields of the cavity near the free surface and far from the free surface are selected for analysis. In figure 11(a), the cavity evolution and pressure distribution at  $z=-5D$ are shown in detail. When $t^{*}=6.25$, the projectile head reaches this section, and a high-pressure area is formed around the head that pushes away the water. During the cavity expansion process in this cross-section, the pressure inside the cavity and around the cavity wall continues to decrease and becomes significantly lower than the ambient pressure $P_{\infty }$. The cavity wall will reach the maximum diameter at $t^{*}=33.75$. Then, the cavity wall begins to contract under the actions of the internal and external pressure difference and inertia. Moreover, a downward jet forms from free surface closure, and its diameter increases continuously during the contraction process.

Figure 11. The cavity evolution and absolute pressure field at different measurement depths at  $v_0=100\ {\rm m}\ {\rm s}^{-1}$ ( $Fr=357.1$). The solid black line represents the cavity wall. (a) Measurement depth of $z=-5D$, (b) measurement depth of $z=-40D$.
Figure 11(b) shows the cavity evolution and pressure field in the section  $z=-40D$. When $t^{*}=91.25$, the high-pressure area around the projectile head is clearly weakened compared with that in the section $z=-5D$ because of the attenuation of the projectile velocity. The contraction process is clearly disturbed by rapid collapse and closed jet splashing. The cavity wall will first contract inwards and collapse to bubbly flow. Meanwhile, the cavity collapse also gives rise to high pressure. Moreover, the rebound occurs because of the high pressure in the gas created by the compression during the collapse.
The cavity diameters in the cross-sections at different measurement depths of  $v_0=200\ {\rm m}\ {\rm s}^{-1}$ ( $Fr=714.3$) are plotted vs time in figure 12. As in the case of $v_0=100\ {\rm m}\ {\rm s}^{-1}$ ( $Fr=357.1$), see figure 10, the maximum diameter of the cavity cross-section first increases and then decreases as the measurement depth is increased. However, this effect is significantly more pronounced in the higher Froude number case. For the cross-sections with small measurement depths, the duration of the expansion of the cavity diameter evolution is clearly shorter than the contraction duration. With increasing measurement depth, the durations of both the expansion and contraction of the cavity gradually approach equality. However, as the measurement depth is further increased, the contraction process becomes significantly prolonged, surpassing the duration of the expansion process. Experimental studies conducted by Guo et al. (Reference Guo, Chen, Mu and Zhang2020) have also reported these trends. Moreover, the time of the cavity collapse in cross-sections near the deep-closure area tends to be consistent, as shown in 12.

Figure 12. Cavity diameter evolutions of several cavity cross-sections at different measurement depths with  $v_0=200\ {\rm m}\ {\rm s}^{-1}$ ( $Fr=714.3$).
Figure 13 shows the cavity evolution process at a depth of  $z=-5D$ with $v_0=200\ {\rm m}\ {\rm s}^{-1}$ ( $Fr=714.3$). When the head of the projectile reaches the section, the cavity develops and expands rapidly until $t^{*}=100.0$. Then, the cavity in the section gradually contracts and collapses, accompanied by the formation of a downward jet at the cavity tail. Compared with the case of $v_0=100\ {\rm m}\ {\rm s}^{-1}$ ( $Fr=357.1$), the maximum pressure at the time when this section is reached clearly increases due to the higher initial velocity.

Figure 13. The cavity evolution and the absolute pressure field at a measurement depth of  $z=-5D$ with $v_0=200\ {\rm m}\ {\rm s}^{-1}$ ( $Fr=714.3$). The solid black line represents the cavity wall.
The cavity evolutions at depths of  $z=-30D$ and $z=-40D$ with $v_0=200\ {\rm m}\ {\rm s}^{-1}$ ( $Fr=714.3$) are shown in figure 14. At $t^{*}=115.0\sim 180.0$, the contraction of the cavity cross-section far from the free surface presents a synchronous trend at a depth of $z=-(30\sim 40)D$. The cavity exhibits a necking phenomenon, and the necking eventually develops into deep closure under the pressure of the ambient pressure $P_{\infty }$, as shown in 14. The depth of the deep closure is approximately $z\approx -(34.5\sim 39)D$. The rapid closure of the cavity shown in figure 14 produces a larger high-pressure area. As the section of $z=-40D$ is closer to the depth of deep closure, the closure occurs earlier than for the depth of $z=-30D$. After deep closure, the pinched-off cavity collapses upwards and downwards.

Figure 14. The cavity evolution and the absolute pressure field at different measurement depths with  $v_0=200\ {\rm m}\ {\rm s}^{-1}$ ( $Fr=714.3$). The solid black line represents the cavity wall. (a) The depth of $z=-30D$, (b) the depth of $z=-40D$.
The above discussion focuses on the typical characteristics of a cavity in high-speed water entry. The cavity evolutions in the cross-sections near the free surface and in the deep-closure area exhibit different characteristics. The influences of free surface motion and cavity closure on the cavity expansion and contraction durations have been identified.
3.2. Effect of the free surface on cavity evolution
Considering the independent expansion of the cavity cross-section, transient cavity dynamics theory predicts the radial evolution of the cavity diameter on the assumption that the cavity wall evolution is related to the projectile velocity and hydrostatic pressure. By contrast, the numerical simulation can describe the whole evolution process of cavity formation, expansion, contraction and collapse while taking into account the free surface motion and internal flow of the cavity. The results from the transient cavity dynamics theory and the numerical simulation of the cavity diameter in cross-sections at different measurement depths with Froude numbers of  $Fr=357.1$ and $Fr=714.3$ are compared in figure 15.

Figure 15. Comparisons between the theoretical predictions and numerical simulations of cavity diameter evolution at different depths. Panels show (a)  $v_0=100\ {\rm m}\ {\rm s}^{-1}$, $Fr=357.1$; (b) $v_0=200\ {\rm m}\ {\rm s}^{-1}$, $Fr=714.3$.
The cavity evolution curve calculated based on the transient cavity dynamics theory shows clear symmetry between the expansion and contraction stages. With increasing measurement depth, the maximum cavity diameter in the cross-section at each measurement depth decreases gradually. When the Froude number increases, the cavity evolution in cross-sections shows a larger diameter and a longer duration of cavity expansion and contraction. However, after considering the motion of the free surface, the numerical results show different phenomena. The cavity expansion and contraction stages at the measurement depths close to the free surface are asymmetric, but with increasing measurement depth, they tend to become symmetric, similar to the theoretical results. Compared with those of the theoretical results, the durations of the expansion and contraction stages of the cavity cross-sections close to the free surface are significantly shorter. This phenomenon was also reported in a previous experimental study of Treichler & Kiger (Reference Treichler and Kiger2020). Moreover, according to the numerical results, the maximum cavity diameter in the cross-sections first increases and then decreases with the measurement depth. The above behaviour can be found at both Froude numbers. In addition, the theoretical results cannot predict the sudden decrease in the cavity diameter caused by the consecutive collapse in the case of  $Fr=357.1$. When $Fr=714.3$, the complete collapse times of cavities at different measurement depths caused by deep closure tend to be consistent, and can also be predicted in the theoretical results. However, the characteristics of the cavity contraction time extension are not predicted by the theoretical results.
The analyses above show that the effects of the free surface and deep closure are not considered well in the transient cavity dynamics theory. To further investigate the cavity evolution law in high-speed water entry, three cases of  $v_0=150\ {\rm m}\ {\rm s}^{-1}$, $v_0=250\ {\rm m}\ {\rm s}^{-1}$ and $v_0=300\ {\rm m}\ {\rm s}^{-1}$ are calculated. Table 1 introduces the corresponding Froude numbers and the water-entry cavity categories with different Froude numbers.
Table 1. Summary of five cases’ calculation conditions and results.

The effect of the free surface on the cavity evolution is further examined, specifically in terms of the maximum cavity diameter and the cavity evolution period cross-sections of different measurement depths. Figures 16(a) and 16(b) present the theoretical and numerical results of the maximum cavity diameter and their ratios, respectively. The theoretically predicted maximum cavity diameter decreases monotonically with increasing measurement depth under the same Froude number. By contrast, the numerical results exhibit a non-monotonic trend, first increasing and then decreasing with increasing measurement depth (figure 16a). Notably, the values at the smaller measurement depths fall below the theoretical predictions, and the disparity is more pronounced for larger Froude numbers. These deviations can be attributed to the free surface effect. The agreement between the numerical and theoretical results improves for greater measurement depths. Measurement depths  $\lvert z/D \rvert$ more than 45 are not considered in this study, as cavities at those depths quickly collapse and form water jets.

Figure 16. Comparison of the maximum cavity diameters from the numerical results and theoretical results of the transient cavity dynamics theory. (a) The maximum cavity diameter of the cross-sections at different measurement depths. (b) The ratio of the maximum cavity diameters from the theoretical results and the numerical results, where  $D_{cmax-T}$ and $D_{cmax-N}$ represent the maximum diameter of the theoretical and the numerical results, respectively, and a ratio close to 1 means that the effect of the free surface is small.
Furthermore, the free surface effect becomes stronger with increasing Froude numbers, leading to larger maximum cavity diameters in the same cross-section. However, as shown in figure 16(b), the free surface effect gradually weakens with increasing measurement depth. The theoretical and numerical results demonstrate similar trends across different Froude numbers, but the differences between the two sets of results become more pronounced at smaller measurement depths. This is due to the absence of the free surface effects in the theoretical predictions, which only consider the projectile velocity and the hydrostatic pressure. These results demonstrate the significant effect of the free surface on the cavity evolution.
Figure 17 illustrates the evolution periods of the cavity cross-sections at different measurement depths based on the theoretical and numerical results. The theoretical results show a gradual decrease in the evolution period with increasing measurement depth. However, the numerically calculated period first increases and then decreases as the measurement depth increases, displaying a non-monotonic trend. For the same Froude number, the numerical results yield shorter periods near the free surface than the theoretical results, highlighting the free surface effect on the cavity evolution. With higher Froude numbers and shallower measurement depths, the deviation becomes more pronounced. Nevertheless, at greater measurement depths, the periods calculated by both methods tend to agree.

Figure 17. Comparisons between the numerical and theoretical results of the cavity evolution period. The measurement depths above the purple dashed line represent greater effects of the free surface, while those below the purple dashed line indicate smaller effects.
To further investigate the free surface effect on the cavity evolution in transverse cross-sections. Figure 18 displays the velocity distribution in the fluid field and the pressure field near the free surface. When the projectile impacts the water surface and enters the water, the free surface rises, forming a water mound. Due to the effect of gravity and the pressure difference between the inside and outside of the cavity, the free surface closes, creating a film on top of the cavity. Simultaneously, water collision within the film generates a high-pressure area and a water jet that flows in the vertical direction. In the initial stage, the water film is thin and may rupture at high Froude numbers, allowing the air to re-enter the cavity (see figure 18(b),  $t=2.6$ ms). The diameter of the downward jet increases as the water surrounding the top of the cavity folds inwards and flows into the jet, subsequently impacting the cavity evolution.

Figure 18. Flow details of the flow field evolution near the free surface. The velocity vector is on the left, and the pressure field is on the right. The black line represents the cavity wall. Panels show (a)  $Fr=357.1$; (b) $Fr=714.3$.
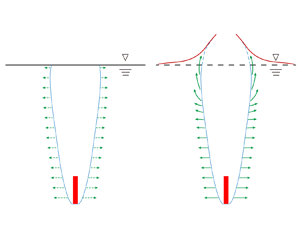
A schematic diagram comparing the flow fields obtained via theoretical and numerical calculations is shown in figure 19. The theoretical approach assumes that the expansion of each cavity cross-section is independent and radial, neglecting the free surface motion, while numerical simulations provide a more detailed view of the actual flow dynamics. The uplift of the free surface absorbs some energy, leading to the suppression of the expansion stages of the cavity cross-sections near the free surface. As a result, the maximum cavity diameters in these cross-sections decrease, and the expansion durations are shortened. Additionally, the high-velocity downward water jet resulting from free surface closure accelerates cavity collapse, reducing the overall period. These effects associated with free surface motion account for the differences observed in figures 16 and 17. As the measurement depth increases, the evolution of the cavity cross-sections progressively detaches from the influence of the free surface and approximates independent radial expansion. Consequently, the numerical results gradually converge with the theoretical predictions. These analyses can more accurately explain the three-dimensional motion effect near the free surface mentioned by Treichler & Kiger (Reference Treichler and Kiger2020), which will affect the cavity behaviour.

Figure 19. Schematic diagram of the flow differences between the transient cavity dynamics theory (a) and the numerical simulation (b) during high-speed water entry.
3.3. Asymmetry of period time of cavity cross-section evolution
As mentioned in § 3.1, the durations of the expansion and contraction are asymmetric due to the effects of the free surface and deep closure. To further investigate the asymmetry of the cavity expansion and contraction durations, the ratio of the contraction duration to the expansion duration is defined as the symmetry coefficient,  $s=t_{c}/t_{e}$. The symmetry coefficient is always equal to 1 according to the results of the transient cavity dynamics theory. However, in the numerical results, it is usually not equal to 1. The variation in the cavity expansion and contraction durations with respect to the measurement depth is plotted in figure 20. Correspondingly, the symmetry coefficient is presented in figure 21. As displayed in figure 20, both the expansion and contraction durations show similar trends under different Froude numbers, first increasing and then decreasing with the increasing measurement depth. Both durations increase with the increase in the Froude number for the same cross-section. With regard to the asymmetry of the expansion and contraction, three regions of variation in the symmetry coefficients can be identified, as shown in figure 21.

Figure 20. The durations of the expansion (a) and contraction (b) in the cavity cross-sections at different measurement depths. Here,  $t_{e}^{*}$ and $t_{c}^{*}$ indicate the dimensionless durations of the cavity expansion and contraction, respectively.

Figure 21. The symmetry coefficients of the cavity cross-sections at different measurement depths with different Froude numbers. The distribution of the symmetry coefficients can be divided into three regions:  $t_{c} \ll t_{e}$, $t_{c} \approx t_{e}$, $t_{c} \gg t_{e}$.
As presented in figure 21, in the cavity cross-sections at the depths close to the free surface, the duration of contraction is clearly shorter than the expansion duration, and the symmetry coefficient  $s$ is less than 1, i.e. $t_{c} \ll t_{e}$. Moreover, the coefficient in the same cross-section near the free surface decreases with higher Froude number $Fr$. As the measurement depth increases, which means that the cavity cross-section is further away from the free surface, the symmetry coefficient tends to be 1, i.e. $t_{c} \approx t_{e}$. For a smaller Froude number, i.e. $Fr=357.1$, the cavity evolution belongs to type I, and the coefficient $s$ is approximately equal to 1 under a wide measurement depth range. However, as the Froude number increases, the cavity has the evolutionary characteristics of type II, and necking and deep closure occur. The symmetry coefficient is close to 1 only in the medium measurement depth range. For higher Froude numbers, the duration of the contraction of the cavity cross-sections at the measurement depths close to the deep-closure area will be longer than the expansion duration, and the symmetry coefficient is much larger than 1, i.e. $t_{c} \gg t_{e}$. Moreover, as shown in figure 15(b), the expansion stages of these cavity cross-sections are consistent with the theoretical results and the contraction duration is longer than that of the theoretical results, which reflects that the necking phenomenon and deep closure mainly affect the contraction stages of the cavity cross-sections.
As discussed in relation to figure 18, a downward jet forms at the cavity tail once the free surface closes. Figure 22 further explores the jet's effects on the cavity evolution by presenting the velocity and pressure distributions at the cavity tail. Due to the pressure difference between the cavity's interior and exterior, the water near the tail accelerates and is funnelled into the jet, causing its gradual expansion during cavity contraction. This water jet drives the downward movement of the cavity wall and the internal air, thereby suppressing the expansion of the cavity cross-section and notably enhancing its contraction. Consequently, the symmetry coefficients of the cavity cross-sections near the free surface are less than 1. The expanded jet eventually strikes the lateral cavity wall, leading to the detachment of an annular cavity from the tail and a subsequent reduction in the jet diameter.

Figure 22. Development process of the downward jet formed from the free surface with the Froude numbers of (a)  $Fr=357.1$ and (b) $Fr=714.3$. The cavity tails are aligned for comparison.
The cavity evolution at the Froude numbers  $Fr=357.1$ and $Fr=714.3$ is shown in figures 22(a) and 22(b), respectively, to investigate the influence of the water jets generated from the free surface at different Froude numbers on the cavity evolution. For $Fr=357.1$, a small annular cavity detaches from the cavity at $t=5.2$ ms. Subsequently, the high-pressure water flow in the break-off area induces a new water jet at the cavity tail, along with a smaller annular cavity. This process leads to a reduction in the diameter of the water jet, resulting in weakened influences of the cavity tail jet at greater depths. Therefore, the symmetry coefficients of the cavity cross-sections far from the free surface remain approximately 1 until the cavity collapses. For $Fr=714.3$, the length, velocity and splash droplets of the water jet at the cavity tail are significantly greater. Annular cavity detachment can also be observed at $t=8.5$ ms, accompanied by a noticeable reduction in the water jet diameter and a weakening of its influence on the subsequent cavity evolution. More importantly, deep closure occurs below the cavity tail at the same time, affecting the contraction of the cavity near the pinch-off depth.
The velocity distribution and pressure field within the cavity necking region at  $Fr=714.3$ are depicted in figure 23, which provides additional details for further analysis of the impact of deep closure. After the cavity is pinched-off from the surface, it becomes a simply connected cavity. Necking of the cavity results in a radial inwards airflow, causing the airflow above the closure position to turn upwards. This increases the air pressure within the cavity and ultimately delays the contraction of the cavity near the closure position. This phenomenon can be observed in figure 24. As $Fr$ increases, the internal pressure within the cavity before complete pinch-off also increases, leading to a prolonged contraction of the cavity cross-section near the deep-closure region. Consequently, the symmetry coefficients of the cavity cross-sections near the deep-closure depth are greater than 1.

Figure 23. Evolutions of the velocity (left) and absolute pressure (right) fields in the necking region with a Froude number of  $Fr=714.3$.

Figure 24. Pressure evolution in the cavity necking region at the measurement depth  $z$. The measuring point of the internal pressure is located inside the cavity wall.
The velocity and pressure distributions of the whole cavity field during the deep-closure process are presented in figure 25. The necking of the cavity will develop into deep closure, and the cavity is pinched off and split into two parts at  $t^{*}=215.0$. The high pressure generated by deep closure is far greater than the hydrodynamic pressure at the projectile head and the high pressure in the area of annular cavity detachment. In addition, the high pressure in the deep-closure area further accelerates the upward and downward movement of the split cavity jets (Mansoor et al. Reference Mansoor, Marston, Vakarelski and Thoroddsen2014). Then, the upward water jet of the upper cavity moves rapidly and collides with the original downward jet at the tail, resulting in a greater collapse pressure at $t^{*}=225.0$, while the downward water jet of the lower cavity continues to accelerate the progress of the collapse, and strikes the projectile at $t^{*}=235.0$. It is clear that the new split cavity jets caused by deep pinch-off accelerate the collapse of the cavity rather than delay it. The results in figure 25 indicate that the prolongation of the contraction duration in the deep-closure region is mainly due to the increase of the pressure in the cavity during the necking process in the deep closure.

Figure 25. Evolutions of the velocity (a) and the absolute pressure (b) fields during the process of deep closure of the cavity with  $Fr=714.3$.
4. Conclusions
In this study, the Eulerian finite element method for multiphase flow was employed to explore the expansion and contraction of the cavity during high-speed water entry. Unlike previous research that focused primarily on categorizing cavity shapes, hydrodynamic loads and trajectories of water-entry bodies, our work focused mainly on analysing the effects of free surface motion and cavity closure on the cavity evolution, particularly with regard to the asymmetry of the cavity expansion and contraction durations and the underlying mechanisms.
The numerical simulation results presented in this paper reveal dynamic morphological characteristics of the cavities that deviate from conventional theoretical calculations. Notably, the maximum diameter of the cavity cross-sections exhibits a non-monotonic variation with the measurement depth, initially increasing and then decreasing as the measurement depth increases. Additionally, when the cavity is near the free surface, it undergoes asymmetric expansion and contraction with shorter durations than those predicted theoretically. This departure from theory is attributed to the lack of validity of the assumption of solely radial flow near the free surface, as highlighted by Aristoff & Bush (Reference Aristoff and Bush2009) in the construction of theoretical models for water entry of small hydrophobic spheres. As demonstrated by our calculations, the upward motion of the free surface plays a crucial role in suppressing cavity expansion. The downward jetting produced after free surface closure accelerates the cavity contraction near the free surface. These two phenomena emphasize the significant influence of the axial motion of the flow on the cavity evolution.
The asymmetry mentioned above is assessed using a symmetry coefficient, defined as the ratio between the durations of contraction and expansion of the cavity's cross-section at a specific measurement depth. When the effect of the free surface is considered, this coefficient consistently falls below 1.0 in the measurement depth close to the free surface. The degree of deviation increases as the measurement depth approaches the free surface. This heightened asymmetry is primarily attributed to the formation and progression of a downward jet produced after the closure of the free surface, which significantly facilitates cavity contraction. Conversely, the coefficient tends to approach 1 as the measurement depth increases. This may be attributed to the decrease in the influence of the jet. The jet has already impacted the cavity wall and merged with the surrounding liquid at smaller depths, reducing its remaining volume and lessening its effect in accelerating the contraction of the deeper part of the cavity.
Beyond jetting, deep closure is another factor that influences the symmetry between cavity contraction and expansion durations. The necking phenomenon in deep closure alters the airflow inside the cavity, leading to an increase in the gas pressure that inhibits cavity contraction. The prolongation of the contraction duration may result in the symmetry coefficients exceeding 1.0, particularly at deeper positions where the free surface effect is lower. This underscores the significance of considering the influence of the internal airflow on the cavity evolution. These findings provide new information for understanding cavity dynamics in high-speed water entry.
Acknowledgements
The authors sincerely appreciate A.P. Pu. Cui for the English writing improvement.
Funding
The work was supported by the National Natural Science Foundation of China (grant numbers: 51925904, 52071109, 52088102) and the Excellent Youth Science Fund Project of Heilongjiang Province, China (YQ2020E027).
Declaration of interests
The authors report no conflict of interest.
Data availability statement
Source data that support the findings of this study are openly available.


 Open access