


Policy Significance Statement
Decision-makers in the public and private sectors aim to take decisions on policy and project design based on a robust evidence base. This paper demonstrates that the analysis of data consisting of anonymized and de-identified call detail records (CDRs) provides new insights about patterns and trends of human mobility. Information is available on a highly localized level and in real time, but also requires investments into statistical capacity and special safeguards on data privacy. Findings from the analysis highlight population dynamics during COVID-19, and inform the government response to a quickly evolving health crisis, including the placement of health centers, testing facilities, and smart containment policies. Future data analysis supports urban planning and investment decisions in the public and private sectors.
1. Introduction
1.1. Unlocking the potential of mobile phone data
The COVID-19 pandemic has highlighted the value of real-time, high resolution data to inform decision-making in a crisis situation. External shocks, such as climate change, conflicts, and pandemics trigger population movements and displacement. In response, decision-makers require information about origins and destinations of refugees and migrants to inform rapid policy responses. Yet, survey and administrative data exhibit severe shortcomings which complicate any crisis assessment: traditional data are likely to be outdated during a quickly evolving crisis situation, and rapid data collection is expensive, slow in relation to how quickly crises tend to unfold, and often incompatible with a lockdown situation. By contrast, new data sources that are readily available have recently gained prominence--notably, satellite and location data. These offer real-time snapshots at a high level of spatial resolution.
Call detail record (CDR) data offer the potential to document population dynamics in near real time. CDR data are available as high-frequency, highly localized data which can be collected and processed in real time and at relatively low cost. In developing countries where smart-phone penetration is low, CDR is likely to have much more coverage than GPS data. The analysis of CDR data involves investments in technical capacity and information technology (IT) infrastructure. One defining characteristic of such data is that it is updated in near real time and requires terabytes of storage capacity, either on the cloud or servers on premise. A so-called data pipeline is required to automate the data flow. The raw data from the mobile network operators (MNO) is encrypted and shared with the regulator, who in turn aggregates it into indicators available for analysis. It is also essential to build the technical capacity of analysts in managing and analyzing data, ensuring the sustainability of the initiative.
The use of CDR data raises privacy concerns and requires a strong institutional framework to regulate access and ensure confidentiality. Researchers and governments have worked closely with regulatory authorities and MNOs to leverage CDR data in measuring changes in mobility patterns (Oliver et al., Reference Oliver, Lepri, Sterly, Lambiotte, Deletaille, De Nadai, Letouzé, Salah, Benjamins, Cattuto, Colizza, de Cordes, Fraiberger, Koebe, Lehmann, Murillo, Pentland, Pham, Pivetta, Saramäki, Scarpino, Tizzoni, Verhulst and Vinck2020). However, most of these efforts are concentrated in countries with established institutional frameworks, which also reflect recent efforts to integrate CDR data and other big data into the national statistical system.
1.2. Use-case: tracking mobility in The Gambia
This paper showcases the use of CDR data to track changes in mobility across The Gambia between March and May 2020, when COVID-19 led to an exodus of the capital city region. This project was undertaken in collaboration with the national regulator Public Utilities Regulatory Authority (PURA) and The Gambia Bureau of Statistics (GBoS) to establish a durable CDR data pipeline in The Gambia. This partnership allows for government ownership and sustainability, investing in both the necessary systems and technical capacity.
Analysis of CDR data suggests that economic lockdown measures reduced human mobility and pushed people to leave the capital city region and return to rural areas. We validate the use of CDR data against the known population distribution from the population census and WorldPop data. Our contribution demonstrates how a system-building approach can make timely, disaggregated analysis based on CDR data available for quick decision-making.
This use-case demonstrates how to build an end-to-end data pipeline for CDR data. This pipeline draws raw data produced by the mobile phone operators and encrypts and aggregates it on the regulator’s premise before making it available to researchers for analysis. Once automated, it can facilitate the production of rapid, high-resolution insights on population mobility patterns and their economic implications.
1.3. Roadmap
Section 2 positions our paper in the literature and describes the country context. Section 3 outlines the engagement model used to work with the PURA and the GBoS on access to CDR data and produces statistical information from CDR data in The Gambia. Section 4 presents the data and defines the methodology to analyze it. Section 5 showcases key results. Section 6 summarizes lessons learned from the ongoing engagement in The Gambia. Finally, Section 7 concludes and outlines the next steps.
2. Context and Literature Review
2.1. Policy relevance of CDR data
There is a rich and growing literature seeking to leverage the potential of CDR data to inform policy-making. With mobile penetration rising in developing countries (GSM Association, 2020), researchers have demonstrated the use of CDR data to create poverty maps (Blumenstock et al., Reference Blumenstock, Cadamuro and On2015), understand migration patterns, and estimate a household’s economic characteristics (Blumenstock, Reference Blumenstock2018). There have been sustained improvements in forecasting population density by combining high-resolution satellite data with powerful algorithms (Stevens et al., Reference Stevens, Gaughan, Linard and Tatem2015). WorldPop trains its algorithms on historical census data and projects annual population density at 100-m resolution in a publicly available dataset (Stevens et al., Reference Stevens, Gaughan, Linard and Tatem2015). However, these datasets rely on slow-moving indicators and are computationally intensive. Forward-looking projections are based on linear extrapolation and do not account for short- or medium-term population movement dynamics.
Researchers have harnessed mobile phone data to map population movements. Deville et al. (Reference Deville, Linard, Martin, Gilbert, Stevens, Gaughan, Blondel and Tatem2014) showed that the density of unique users in a cell tower’s catchment area scales with population density, and can be plotted on a logarithmic curve. Researchers can therefore extrapolate shifts in the number of unique users to predict shifts in population densities over time, day-by-day or week-by-week. Accordingly, CDR aggregates provide insights on population movements, which are useful for estimating regional connectivity and the impact of mobility restrictions (Wesolowski et al., Reference Wesolowski, Buckee, Engø-Monsen and Metcalf2016). It also helps to identify areas with higher risks of importation due to population flows from other regions, and develop spatial epidemiological models (Aledort et al., Reference Aledort, Lurie, Wasserman, Bozzette, Lurie-Nicole, Wasserman-Jeffrey and Bozzette-Samuel2007; Wesolowski et al., Reference Wesolowski, Eagle, Tatem, Smith, Noor, Snow and Buckee2012).
Combining CDR data with administrative and survey data offers insights on fast-moving health and well-being indicators. Drawing from survey data on the incidence of poverty in Rwanda, Blumenstock et al. (Reference Blumenstock, Cadamuro and On2015) use machine learning algorithms to predict poverty outcomes based solely on patterns in mobile network data. Zu Erbach-Schoenberg et al. (Reference Zu Erbach-Schoenberg, Alegana, Sorichetta, Linard, Lourenço, Ruktanonchai and Tatem2016) combine CDR data with public health datasets in Namibia to link mobility and malaria incidence. When compared with estimates using static maps, this leads to discrepancies of up to 30%. These applications showcase the value-added of high-resolution, high-frequency proxy data like CDR in the context of an epidemic such as COVID-19.
CDR data can also be used to rapidly update estimates of population distribution when a natural disaster leads to widespread displacement. Bengtsson et al. (Reference Bengtsson, Lu, Thorson, Garfield and von Schreeb2011) used CDR data from a major telecommunications company to track displacement in Haiti after the 2010 earthquake. This allowed them to track shifts in population distribution and estimate that up to 20% of the population of the capital city left in the 19 days after the earthquake. Lu et al. (Reference Lu, Wrathall, Sundsøy, Nadiruzzaman, Wetter, Iqbal and Bengtsson2016) used CDR data to track short-term mobility in the hours and days after Cyclone Mahasen hit Bangladesh in May 2013.
2.2. Methodological innovations CDR data
The most commonly used methods for processing CDR data are traditional data mining techniques. These include frequency-based analysis, data clustering using unsupervised machine learning, and geo-visualization techniques by mapping geolocation (Calabrese et al., Reference Calabrese, Ferrari and Blondel2014). In recent years, researchers have used de-identified CDR data to compute origin–destination (OD) matrices in order to better map patterns in travel behavior (Calabrese et al., Reference Calabrese, Di Lorenzo, Liu and Ratti2011). In combination with additional administrative or survey data, supervised machine-learning methods can inform the prediction of outcomes based on patterns in the cell network (Sundsøy et al., Reference Sundsøy, Johannes, Reme, Iqbal and Jahani2016).
The preprocessing of the raw CDR data is essential to accommodate positioning errors in data collection and the first step for processing. The oscillation problem of the user’s location is the leading cause of noise in position data collected from the cellular network as they transfer calls to the nearest base station for traffic management, creating imprecise and overlapping Voronoi polygons (Chen et al., Reference Chen, Ma, Susilo, Liu and Wang2016). The time-based filter is used to ignore oscillation and agglomerative (hierarchical clustering) methods to extract truthful location data from raw CDR.
However, handling such sensitive data requires appropriate protocols to address concerns around data privacy. While anonymizing data is necessary, Kondor et al. (Reference Kondor, Thebault, Grauwin, Gódor, Moritz, Sobolevsky and Ratti2015) show that it is theoretically possible to identify users based on their mobility patterns alone (Kondor et al., Reference Kondor, Thebault, Grauwin, Gódor, Moritz, Sobolevsky and Ratti2015). It is, therefore, best practice to restrict access to individual observations and use aggregated indicators for the purpose of analysis.
2.3. Country context: The Gambia
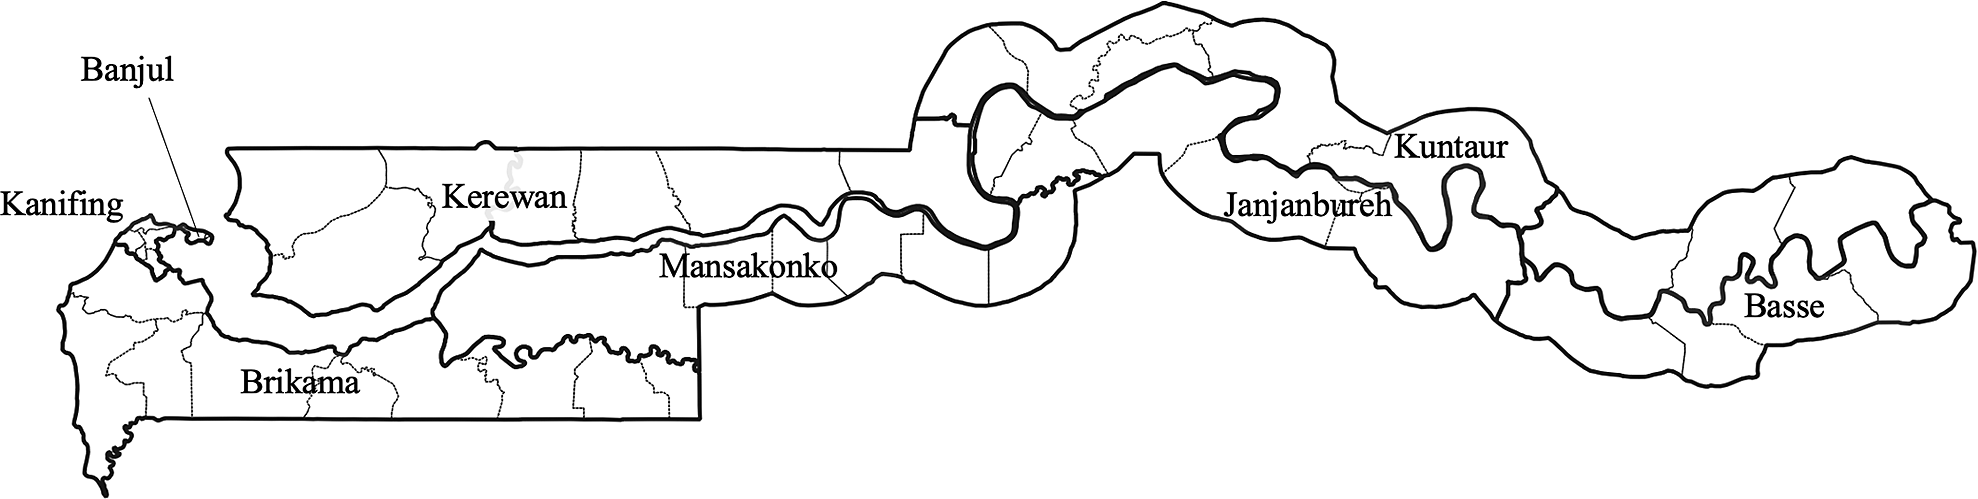
The Gambia is a West African country of 2.3 million people surrounded by Senegal. The country has experienced prolonged spells of violence and instability and is currently undergoing a transition process to restore its democratic institutions. With a Gross National Income (GNI) of 740 USD (current, Atlas method), The Gambia is classified as a low-income country, with more than 10% of the population living in extreme poverty. The capital city region at the mouth of the Gambia river encompasses Banjul city and the Kanifing region, with tourist resorts strung southwards along the coast (see Figure 1). Tourism and the civil service are the largest drivers of formal employment. Inland is largely rural, its economy is driven by agriculture, and largely dependent on the flow of domestic and international remittances from migrants. These disparities in access to services and opportunities have led to high levels of internal migration, especially among the young who left rural areas to look for better jobs in the capital city region (The World Bank, 2020).

Figure 1. Administrative boundaries of The Gambia. Source: Authors. Note: Names on the map indicate eight local government areas (LGAs). Boundaries present 48 Districts. LGA boundaries are highlighted in bold.
The Gambia confirmed its first case of COVID-19 on March 17, 2020. As an immediate response to prevent the spread of the disease, the government imposed a social-distancing policy on March 18. A state of emergency was declared on March 27 and extended on April 3 and May 19. In response to the spread of COVID-19 and the closure of international borders, the burgeoning tourism economy collapsed near the height of the tourist season, driving up unemployment. Many migrants returned to their home villages, creating an urban exodus. Trade and travel within the country were reduced to the strict minimum, as authorities enforced restrictions on movement. The period of analysis also includes Ramadan (April 23 and May 23), which, in this majoritarian Muslim country, is traditionally a time of reduced economic activity as many travel to be with family.
PURA is an autonomous government entity that oversees water, electricity, and telecommunication services in The Gambia. As part of its oversight activities, the regulator collects aggregated indicators from MNOs to monitor service quality. With technical support from the World Bank and the University of Tokyo, it has worked with mobile phone operators to expand the list of indicators routinely collected for the purpose of mobility analysis and store them in a secure on-site server. In this effort, it has collaborated closely with both The Gambia Bureau of Statistics (GBoS), and the Ministry of Health.
3. Building the Data Pipeline
3.1. Securing institutional and organizational access
The analysis of CDR data in The Gambia goes back to a dialog among The World Bank, the GBoS, and the PURA to explore the use of big data to create an evidence base for policy and project design in the context of economic and social development. The Gambia experiences high levels of domestic and international migration, which provides access to opportunities and services and triggers a steady flow of remittances. In 2019, the share of emigrants relative to the total population was around 5%, and personal remittances were equivalent to 16% of GDP (World Development Indicators, 2020). As survey and administrative data were outdated, the three parties agreed to pilot the use of de-identified, anonymized, and aggregated CDR data to identify locations with high levels of outmigration and describe patterns of human mobility. Initially, this analysis was based on summary statistics of incoming and outgoing international calls on the level of cell towers which overlap with known hotspots of international migration. This use-case relied solely on de-identified and aggregated data and allowed the team to demonstrate a proof of concept while building trust with government counterparts. The spread of COVID-19 prompted interest in internal mobility, altering the development objective for this partnership.
A workshop in February 2020 was instrumental to initiate a partnership on “Big Data for Development” that evolved around ownership and sustainability. A joint vision and a clearly specified use-case to focus the analysis on internal migration helped to coordinate expectations and build capacity using a practical example. Moreover, a broader audience during the initial workshop—involving stakeholders from the private sector, government ministries and agencies, academia, civil society, and development partners—confirmed the demand and interest for access to and analysis of CDR data. During this discussion, it was instrumental to convince the MNO to join this initiative, as they are collecting and providing the CDR data. Their agreement was based on the idea that training would also enhance their in-house capacity to analyze CDR data in order to improve their business operations and enhance customer relations. The workshop also offered a forum to discuss any institutional, organizational, or technical challenges, and to showcase how other countries have managed these concerns.
Once COVID-19 hit The Gambia in March 2020, all parties agreed to revisit the focus of the collaboration and explore the use of CDR data to respond to the health and economic crisis brought on by COVID-19. In light of limited viral testing and health facilities equipped to handle rising numbers of COVID-19 patients, the government announced a national health emergency with profound restrictions on human mobility (Hale et al., 2020). As part of this dialog, it became clear that prolonged social distancing would bear a high cost for households and firms (Gottlieb et al., Reference Gottlieb, Grobovsek, Poschke and Saltiel2020), and there was interest to create an evidence base for smart containment measures. Based on successful applications in other countries, the analysis then focused on the use of CDR data to understand patterns of human mobility during COVID-19.
3.2. Strengthening technical capacity
In addition to building a consensus about the analysis of CDR data, partners agreed to strengthen technical capacity and ensure knowledge transfer. Crucially, rather than building a system from scratch, efforts were directed at strengthening existing data collection protocols between the MNO and the PURA to include the necessary indicators. As part of its mandate to monitor the quality of calls, PURA already had established a centralized repository of data, which was plugged into the respective MNOs systems and updated in real-time. After securing the necessary approvals, the team worked with the system administrator to include additional indicators as part of this routine monitoring for use in the analysis. This minimized the reporting burden on MNOs, facilitating compliance. To ensure an additional level of security, the data collected for this project was firewalled and stored on a separate server on the premises, with remote access strictly limited to key researchers and system administrators. Capacity-building in the preparation and analysis of CDR data also built trust and offered an opportunity to discuss lessons learned from other countries. It helped to establish a platform to continue the work during the following month when all interactions between the counterparts in The Gambia and the team of researchers shifted online.
Throughout the partnership, PURA played a crucial role in working closely with the MNOs to obtain access to the CDR data. The regulator for telecommunication services used its convening power to discuss data sharing with MNOs while upholding national and international standards for data privacy. Two out of four MNOs agreed to provide access to their CDR data. After training in one-way encryption using a 160-bit hash function, they provided anonymized data to the regulator. In accordance with national regulatory requirements, the regulator set up a secure file transfer protocol (FTP), and all data were stored on-premise on a dedicated server. Aggregation of the data was conducted through highly restricted remote access into the server, which constrained computational capacity but kept the data secure and confidential. The team working remotely only had access to aggregate indicators for analysis which precluded any possibility of de-anonymizing the data.
3.3. Hardware requirements
A Hadoop platform was introduced as the primary system for data processing and analysis. Hadoop is a set of open-source software for data-intensive and distributed applications aiming to solve massive amounts of data and computation. Multiple machines work together as a cluster with parallel computation distributed among nodes. At the limit of storage and processing time, a cluster can be easily scaled by adding more machines to the cluster.
For the hardware requirements, a minimum of four machines is necessary to build up a cluster (see Figure 2). One works as a master node to keep metadata and manage processing jobs. The other three machines work as slave nodes or storage and computation nodes. The network connection among nodes must be at least a gigabit of ethernet to ensure no bottlenecking occurs on data transfer. An additional machine can be added for visualization, anonymization, and jump host to the cluster, which is located in a separate network ensuring data security and accessibility. The hardware can also be a virtual machine or physical machine depending on the existing infrastructure and additional cost calculations. In The Gambia, the team started with virtual machines on pilot data to provide preliminary results, and then upgraded to full hardware with the full dataset.

Figure 2. A Hadoop Cluster as a hardware solution to process CDR data. Source: Authors.
Allowing continuity and continual updating of the data, a well-defined data pipeline is essential. The data were provided by MNOs in a compressed or comma-separated file daily and uploaded to a secure FTP server under a private link or virtual private network. The task was run to extract data, import the Hadoop cluster, preprocess the data, and prepare of for analysis. The CDR data contain a rich set of information mainly used for network routing, usage accounting, and handset localization. The CDR Data consist of the following: the International Mobile Equipment Identity (IMEI), the International Mobile Subscriber Identity (IMSI) of the caller, a timestamp indicating when the session started, the usage duration, the base station identifier, and the activity type (call, short message service [SMS], and data communication). The base station ID is mapped onto the base station dataset according to the latitude and longitude of the cell tower. Ensuring privacy, the identifiable data fields such as the IMEI are encrypted and replaced with computer-generated random numbers before the analysis.
4. Data and Methodologies
4.1. CDR data descriptive
The mobile penetration rate of The Gambia was 94.2% in 2013 and rose to 140% in 2018, which was higher than the average of developed countries (ITU ICT-Eye, n.d.). As of 2018, 98.4% of households reported ownership of at least one mobile phone with limited variation across regions and between rural and urban areas. On the individual level, 85.1% of men and 74.1% of women in the age group between 15 and 49 years own a mobile phone (The Gambia Bureau of Statistics, 2019). According to PURA, the four major MNOs provide services to 2.59 million subscribers as of 2020, even allowing for persons with multiple SIM cards. In this paper, we use CDR data for a 3-month period between March 2 and May 31, 2020, offering a snapshot of changes in mobility during the COVID-19 lockdown.
Data were made available for two major MNOs, which cover approximately 70% of the market and include around 1.75 million subscribers. On average, the data comprise 18.8 million data points per day with very limited variations over the data period, which amounts to 2 billion anonymized observations in total. Hence, we assume that cell phone usage in terms of transaction volumes did not change fundamentally once COVID-19 hit the country. The average number of records per subscriber per day is 10.6 where approximately 2.6 records are used for calling. Like other developing countries, the practice of using multiple SIM cards is common in The Gambia. We expect a certain overlap between the two MNO subscribers, which might have resulted in over-representing the multiple-SIM-card holders. In this study, the impact of multi-SIM holding on the analysis result is considered to be limited since the two MNOs primarily market to different socio-economic groups. One of them is a leading MNO in The Gambia and is popular in urban areas with high-speed internet services. The other MNO provides only voice and SMS with inexpensive plans, which are much more popular in rural areas.
The preparation and analysis of CDR data under this project are based on a protocol to address concerns of privacy and confidentiality. Raw CDR data include several identifiers associated with each record, such as phone number, IMSI and IMEI. We employ a three-stage approach to anonymize these identifiers in order to protect data privacy.
-
1. First, identifiers are encrypted using a one-way function by the MNOs on their premises.
-
2. Second, the encrypted identifiers are replaced with the random numbers after the data are combined. Lists of cell towers and the locations provided by the MNOs are pooled in the regulator’s premise, and cell-tower locations are clustered using Ward’s hierarchical clustering, with a maximum distance constraint of 1 km from the centroid of the cluster.Footnote 1 We then use the centroid of the cluster to match and map the de-identified CDR data to their respective cell-tower locations. This process lowers the spatial granularity of cell-tower distributions.
-
3. Third, the results of all indicators are aggregated at the administrative unit level. There are certain concerns about reverse engineering for the re-identification of de-identified CDR data (Kondor et al., Reference Kondor, Hashemian, de Montjoye and Ratti2018) but the abovementioned aggregation process lowers the risk of reverse engineering.
4.2. Key indicators for the analysis of human mobility
The analysis of patterns of human mobility during COVID-19 in The Gambia is based on a set of mobility indicators, which are calculated based on CDR aggregates. The indicators capture changes in population movements during the baseline, under COVID-19 and post-intervention periods, and results can be updated continuously as additional CDR data become available. We used the first 2 weeks of March before the lockdown as baseline to obtain indicators about routine mobility levels.
The standardized indicators were proposed by the World Bank COVID-19 Mobility Task Force and build on a framework developed by Flowminder to support MNOs in producing basic indicators from telecom data (see Flowminder COVID-19 Resources—Mobility indicators, n.d.). Methodologies for computing indicators were designed to minimize computational intensity in resource-scarce settings. The indicators are fully anonymous and contain no information about individual subscribers, ensuring that the privacy of subscribers is maintained at all times. They are robust to sparse tower distribution and to infrequent phone usage, both of which are common in low- and middle-income countries. Eleven key indicators provide proxies for population, location of residence, distances traveled, and daily mobility trends across regions at different geographic and time levels. For this project, we selected 4 out of the 11 indicators. Table 1 summarizes the selected indicators based on information on the World Bank COVID-19 Mobility Task Force repository on GitHub.Footnote 2
Table 1. Summary of key indicators for the analysis a

a Source: Authors’ adaptation based on the World Bank COVID19 Mobility Task Force repository on GitHub.
Abbreviation: SMS, short message service.
4.3. Application in The Gambia
This paper makes use of the proposed indicators from the World Bank COVID-19 Mobility Task Force and applies them to the country context of The Gambia to analyze patterns of human mobility during COVID-19. More specifically:
-
1. Indicator 3 shows changes in the population distribution over time. As subscribers are accounted for in every region in which they use their phones, it overestimates subscribers who visit multiple regions in a day when computed at the administrative unit level. The value of this indicator can be also affected by load-sharing where several cell towers jointly cover a certain area due to network optimization. This impact is mitigated by the cell-tower clustering, which was described as part of data preprocessing in the previous section. We compute this indicator at the national level for examining how the number of active subscribers as a whole country changes over time and for adjusting the result of other indicators.
-
2. Indicator 6 illustrates changes in the location of residency, which could infer the incidence of migration over the data period. For mapping the residential distribution, there are various methodologies and algorithms (Ahas et al., Reference Ahas, Silm, Järv, Saluveer and Tiru2010; Deville et al., Reference Deville, Linard, Martin, Gilbert, Stevens, Gaughan, Blondel and Tatem2014) which provide more accurate estimates compared to the proposed method. We consider it still useful for detecting a flexible home location reflecting weekly changes as the estimation result is used at the administrative unit level. In addition, the proposed method is relevant under resource-scarce settings as it is not computationally intensive.
-
3. Indicator 7 demonstrates changes in levels of mobility over the data period. The value of this indicator is defined as the average distance traveled per person residing in a region. This indicator has limitations in detecting mobility particularly in rural areas due to lower cell-tower density. Mean values for regions in rural areas tend to be affected by extreme values generated from distant cell towers, which are much longer distance than can be traveled. In addition, median values for rural areas tend to be zero because short-distance travel is not detected when a wide area is covered by a cell tower. We use the value of the 75th percentile. It results in representing the mobility patterns of people whose mobility is relatively higher. However, the value enables us to capture changes without being affected by extreme values.
-
4. Indicator 10 describes the sizes of population inflow and outflow. We use this indicator for examining changes in population inflows. This indicator can be used for constructing OD matrices but has limitation in capturing long-distance trips. This is because a trip for constructing an OD matrix is defined by each consecutive pair of records, meaning that a long-distance trip is transformed into a set of several short trips, and thereby a link between the origin and destination of the long trip is missed.
The four indicators above are selected for application in The Gambia to inform COVID-19 responses. These indicators are useful for capturing changes in mobility patterns, occurring in a relatively short period in response to mobility restrictions, and for understanding the mobility patterns, directly affecting the spread of infectious diseases. We highlight that the use of Indicator 3 is critical for mitigating the impact of changes in active subscribers over time. Overall, the proposed methodology for the indicators is relevant to COVID-19 particularly in resource-scarce settings as it enables the generation of actionable statistics even with limited capacity and computing resources, which is a common state in many developing countries.
The following section summarizes key findings based on the set of four indicators outlined above and demonstrates how mobility statistics produced from CDR data can be used for understanding dynamic changes in population distribution and movements.
5. Results
5.1. Validation against known population distribution
As a first step in the analysis, we examine the validity of CDR data to measure population movements in The Gambia. We compare the known population density for each district to the density of unique subscribers as defined by their anonymized identifiersFootnote 3 during the baseline period in early March 2020. In Figure 3, we plot population density computed from the 2019 WorldPop dataFootnote 4 (Pwpop), and the 2013 Population Census (Pcensus) is plotted against the population density computed from CDR data (Pcdr).

Figure 3. Correspondence between Log (population density) and Log (unique subscriber density), using two different known measures of population density. (a) Log (WorldPop density). (b) Log (Census density). Source: Authors. Points represent districts, clustered by LGAs.
The correspondence was estimated using ordinary least squares given the following equations:
 $$ \log\ \left[\mathrm{Pwpop}\right]=\unicode{x03B1} 1+\unicode{x03B2} 1\times \log\ \left[\mathrm{Pcdr}\right]+\unicode{x03BC} \_\mathrm{k}+\unicode{x025B}\ 1, $$
 $$ \log\ \left[\mathrm{Pcensus}\right]=\unicode{x03B1} 2+\unicode{x03B2} 2\times \log\ \left[\mathrm{Pcdr}\right]+\unicode{x03BC} \_\mathrm{k}+\unicode{x025B}\ 2, $$
where α1 and α2 are constants, β1 and β2 are coefficients of interest, μ_k is a regional fixed effect allowing for inter-regional variation in the relationship between density and population, and ε is the error term. The fixed effect allows us to distinguish between urban and rural regions. As shown in Table 2 and Figure 3, subscriber density is highly correlated with the known population density. The β is within the margin of error of that found by Deville et al. (Reference Deville, Linard, Martin, Gilbert, Stevens, Gaughan, Blondel and Tatem2014) for France and Portugal, 0.77 ± 0.055, suggesting a stable relationship across countries. In addition, the R 2 value suggests that 85% of the variation in density in the WorldPop data is explained by variation in the CDR data. The R 2 is lower for the census, given that the data are older. These results confirm that CDR data are valid for examining the population distribution in terms of their residential locations. By extension, shifts in CDR data can capture both short term and long-term shifts in population over time, with implications for disaster risk management and urban planning.
Table 2. Correspondence between known population data and call detail records (CDR) data a

a Standard errors are reported in parentheses.
* Significance at 90% level.
** Significance at 95% level.
*** Significance at 99% level.
Source: Authors’ calculations.
5.2. Patterns of phone usage remained near-constant in terms of the number of active subscribers
Overall cell-phone use remains stable over the period of observation. We use the number of active subscribers computed for Indicator 3 to examine whether the pattern of phone usage changed against interventions and events over the period of observation. Figure 4 shows the number of active subscribers, which is presented as the ratio to the baseline. We use the average of the number of active subscribers for the first 2 weeks of March as the baseline. While we observe a short-term, sharp decrease at the beginning of the pandemic, with some erratic behavior in the following weeks, these fluctuations soon subside with a return to baseline levels of activity on average.

Figure 4. The number of active subscribers in The Gambia—ratio to the baseline. Source: Authors’ calculations.
This stability in the number of users suggests that people kept using their phones during the lockdown and that fluctuations in activity reflect population shifts rather than differential use patterns. Table 3 shows the descriptive statistics of the number of active subscribers for the period in between the interventions/events. It illustrates that mean activity levels stayed stable, while standard deviation decreased slightly, suggesting increased stability. Based on this indicator, we consider the fluctuations in overall phone activity to be random and not part of a significant increasing or decreasing trend. The value of this indicator is used for mitigating the impact of fluctuations caused by the changes in the number of active subscribers.
Table 3. Descriptive statistics of the number of active subscribers for four periods in between the interventions/event (presented as the ratio to the baseline) a

a Ratio defined during the baseline period during the first 2 weeks of March.
5.3. Mobility patterns suggest an initial urban exodus
We use the location of residence computed for Indicator 6 to examine shifts in population distributions at the district level and between urban and rural areas. The Gambia is divided into eight LGAs and subdivided into 48 districts. Three districts are omitted as no cell-tower clusters are located within their administrative boundaries. The districts are classified into four groups to compare changes in numbers of residents among districts based on rural/urban LGAs and whether it is an LGA capital. Three LGAs, Banjul, Kanifing, and Brikama, are classified as urban LGAs, all of which are located in the western part of The Gambia and include nearly half of the national populations. The remaining five districts are classified as rural LGAs. For each LGA, the administrative center is classified as the LGA-capital and the remainder grouped as non-LGA-capital districts. This is to allow for differential effects in local secondary cities, since non-capital districts differ from the administrative center in access in population density, access to services, and structure of economic activity. The classification result is presented in Table 4.

We convert the number of residents to the ratio to the baseline to examine changes from the normal period. The average number of residents of the first 2 weeks of March is used as the baseline. The ratio is scaled using Indicator 3 at the national level to mitigate the impact of fluctuations in the number of active subscribers. Indicator 3 at the administrative unit level is not used as it can introduce certain urban-rural biases; Indicator 3 overestimates the number of active subscribers in urban areas where cell-tower density is higher and people are relatively mobile compared to rural areas. Though this process helps mitigate the impact of the fluctuations on Indicator 6 to a certain extent, Indicator 3 cannot sufficiently address the impact. For instance, when the significance of population decreases at the district level is greater than that of active subscribers at the national level, the value of Indicator 6 computed as the ratio to the baseline cannot not sufficiently inflated.
Figure 5 shows an increased number of people moving to non-capital districts in rural LGAs in the last weeks of March as the State of Emergency was extended. It uses the number of residents for the four groups, which is calculated as the ratio to the baseline and adjusted using indicator 3. In contrast, districts in urban LGAs and LGA-capital districts show decreasing trends. This suggests that many people in urban areas shifted to rural areas as a result of the lockdown, returning to their hometown in rural areas because of decreased job opportunities in urban areas. During Ramadan, there was a brief spike of activity pronounced in urban LGAs. This reflects mobility patterns seen elsewhere, with an initial burst of out-migration from urban to rural areas, and a gradual trickle back as restrictions were lifted.

Figure 5. Numbers of residents at the district level in urban and rural areas—ratio to the baseline. Source: Authors’ calculations.
Interestingly, non-capital districts in urban LGAs are distinctive in that the estimated population remained almost unchanged in April and May after an initial decrease in activity, perhaps in anticipation of lockdowns. This might reflect populations living in sub-urban areas with more stable jobs and established homes, which are more reliant on local economic drivers than civil service and tourism. In contrast, the sharp decrease in capital districts in urban LGAs could represent the behaviors of migrants without stable jobs or homes, who were particularly vulnerable to the economic downturn.
5.4. Mobility decreased most in rural areas
We use the distance traveled computed for Indicator 7 to compare changes in levels of human mobility in urban and rural areas between March and May 2020. In addition to the mean distance defined in Table 1, we computed 50th- and 75th-percentile distances because the mean values tend to be affected by the sparse density of cell towers, which generate longer distances traveled than actual ones. For this analysis, we use 75th-percentile distances as the median resulted in zero in many districts. It means that the results of this indicator represent people whose mobility is relatively high.
Figure 6 illustrates changes in distance traveled at the district level in urban and rural areas, which is presented as the ratio to the baseline. We use the average distance traveled for the first 2 weeks of March as the baseline. The distances traveled of all groups remain less than the baseline after the restriction imposed except on 23 May, which is the end of Ramadan. It suggests that the mobility of people decreased overall. Among the non-capital districts, districts in urban areas show the most significant decreases, and those in rural areas have similar trends with smaller magnitudes. These trends indicate more significant impacts on activities in rural areas that rely heavily on mobility for the purposes of temporary migration and trade.

Figure 6. Distance traveled at the district level in urban and rural areas—ratio to the baseline. Source: Authors’ calculations.
5.5. Population inflow
We use the population inflow computed for the Indicator 10 to compare population inflow attracted to urban and rural districts. Figure 7 shows the population inflows to urban and rural areas at the district level, which is presented as the ratio to the baseline. We use the average of population inflows for the first 2 weeks of March as the baseline. After the state of emergency declared on March 27, population inflow to the rural districts of rural LGAs increased relative to the baseline. In contrast, population inflow to the capital districts of urban LGAs sharply declined and remained at lower levels compared to the baseline, suggesting a reversal of the usual trends toward urban migration. During the period of Ramadan, trends of urban and rural LGAs significantly diverged; population inflows to both capital and non-capital districts in urban LGAs gradually increased and exceeded the baseline level toward the end of the observation period, suggesting that many people gradually returned to the urban agglomerations as the holiday ended and COVID-19-related restrictions on movement and economic activity were lifted.

Figure 7. Population inflows to urban and rural areas at the district level—ratio to the baseline. Source: Authors’ calculations.
6. Policy Recommendations
6.1. Policy dialogue: first, find a use-case
This use-case highlights that CDR data are particularly useful in countries with limitations to frequency, timeliness, and coverage of administrative and survey data. Although the mobility statistics have constraints in terms of capturing all aspects of human mobility, our results show that statistics produced from CDR data capture changes in population distribution and movements, which continue to vary in a short period. This is particularly useful during an emergency like COVID-19, where traditional data collection methods may be too slow to capture the rapidly evolving situation.
The successful implementation of this use-case on COVID-19 is based on an early engagement with PURA and GBoS, which also established a platform to strengthen the policy relevance of the analysis. The workshop in February 2020 offered an opportunity to discuss with stakeholders their ideas, expectations, and concerns regarding the use of CDR data. Furthermore, building consensus among all stakeholders and using strategic alliances and champions embedded in the country dialog helped to foster ownership and sustainability of the project. When the COVID-19 crisis struck, the groundwork was already in place, and the team could quickly produce analytics focused on the impact of COVID-19 on patterns or human mobility.
6.2. Engagement model: bring decision-makers on board
As results from the use-case on COVID-19 became available, PURA and GBoS used these findings to inform their participation in the government task force for COVID19. The early dissemination of results helped to inform decision-makers and prompted requests for a scaled-up version providing real-time data during a quickly evolving health and economic crisis. Unfortunately, efforts to quickly turn this case-study into a fully functional data pipeline were delayed due to constraints in implementation capacity until late 2020. However, once the necessary hardware and training were provided, the CDR data pipeline became operational in early 2021.
Throughout the dialog with decision-makers, presentation of findings in an easily accessible format and identification of specific policy recommendations strengthened the support and the interest in the project. Maps created an entry point for dialog with a technical and non-technical audience as they were visually appealing but still contained important lessons (see Figure 8). Moreover, interpretation of results and specific applications in the context of the pandemic supported communication. For instance, the team argued that findings from the use-case on COVID-19 could inform targeted testing initiatives, by concentrating efforts in areas of high mobility. When a full lockdown is not possible given the economic costs, this can also inform where social-distancing policies should be enforced given higher mobility and associated with these increased risks of transmission. In addition, results demonstrated that the lockdown disproportionately affected urban areas by restricting economic activity, and relief and recovery efforts should therefore aim to address these adverse effects. These are but a few of the policy-relevant insights CDR data can deliver.

Figure 8. Weekly averages of distances traveled at the district level—ratio to the baseline. Source: Authors’ calculations.
6.3. Big Data for development: partnership, innovation, and capacity
The partnership on “Big Data for Development,” and the analysis of CDR data in the context of COVID-19, highlight that real-time data and analysis are valuable, but only when produced in close collaboration with local counterparts. Rather than aiming for shortcuts, the project brought together a statistics agency (GBoS) and government regulator (PURA), two entities who rarely collaborated in the past. In its engagement, the project also sought to play to the respective strengths of its counterparts. PURA brought the regulatory mandate and technical capacity to collect and process the data, while GBoS contributed in guiding and motivating the analytics. Positive feedback from other government entities, including the Ministry of Finance, has created incentives for GBoS and PURA to continue exploring opportunities to collaborate and innovate.
Through this project, the team introduced its counterparts to an innovative approach to handling big data while also following strict protocols on how to preserve the privacy and confidentiality of this new type of information. Recommended privacy practices include establishing appropriate encryption, maintaining file transfer and storage protocols to ensure the security of highly confidential data, and ensuring adherence to regulatory requirements and best practices. This sort of direct engagement model fosters innovation and ownership, helping to build capacity through continued engagement. This included training the MNO operators in one-way encryption protocol, and installing a stand-alone server on PURA premises to hold the data, with strict remote access protocols.
Finally, working in a limited-capacity context required flexibility, and from time-to-time involved compromises. In terms of hardware, an initial server provided to PURA for piloting purposes became the go-to for data storage when COVID-19 impeded the acquisition of additional server capacity. In terms of analytics, although there was a tool for producing standardized mobility statistics available on the GitHub repository, we chose to write our own script. This was to accommodate the system parameters on PURA’s premises. Since much of the analytical work was done through remote access, it was restricted by network capacity and could be interrupted by electrical outages. This required breaking computationally-intensive tasks into multiple steps with intermediate results, so that any interruption would only disrupt the current computation and not the whole script.
7. Conclusion
In this paper, we demonstrate the uses of four indicators for examining how interventions and events under COVID-19 are reflected in the patterns of phone usage, population distributions, levels of mobility, and population flows. Results show that CDR aggregates are relevant for capturing changes in these indicators, which continue to vary every few months. It indicates that CDR data provide timely and granular population statistics that can complement conventional statistics.
The use of CDR data in the context of COVID-19 in The Gambia demonstrates the hidden potential of big data, including CDR data, to inform decision-making. Due to lack of investments in statistical systems, severe data deprivations are likely to remain a challenge for governments, the private sector, and civil society, and this approach offers an opportunity to leapfrog, and exploit data which are available in real-time, re highly localized, and are accessible at relatively low cost. However, the use of CDR data will require future investments into the institutional and organizational framework of national statistical systems, including improvements of IT infrastructure and technical and statistical capacity. The analysis also demonstrates that CDR data are unlikely to substitute for traditional data, such as administrative and survey data, as linkages between telecommunication data and individual-level and household characteristics need to satisfy strict technical and ethical requirements.
This application focuses on a well-defined use-case, and further work is necessary to scale up the existing structure and ensure interoperability. This paper demonstrates that the analysis of CDR data can support decision-making during a crisis situation. This scaling up will require a commitment to include the analysis of CDR data into the standard set of planning instruments, including for the allocation of human capacity and financing.
Future work in The Gambia will build on existing partnerships and experiences. While valuable, CDR data on its own can only offer limited insights. We propose to build on this analysis by overlaying it with additional datasets. This includes validation of observed patterns against mobility data from Facebook. We also propose to overlay the mobility trends against price data to infer whether shifts in population drove food prices up in rural areas relative to urban areas. Finally, we would draw on recently available survey data, including the 2019 migration survey, to unpack the correlation between ward-level mobility metrics and underlying patterns of internal migration. Notably, did the areas that depend most on internal migrants see a large number of returns? This would allow us to infer how the COVID-19 induced lockdown differentially impacted vulnerable populations in rural and peri-urban areas.
From a policy perspective, the future analysis of CDR data could inform urban planning, particularly investments into infrastructure such as roads, schools, and hospitals. In addition, the private sector has also shown interest in using this information to better understand commuting and clustering patterns in order to exploit untapped market potential.
Abbreviations
- COVID-19
-
Coronavirus disease 2019
- CDR
-
call detail records
- FTP
-
file transfer protocol
- GBoS
-
Gambia Bureau of Statistics
- GNI
-
Gross National Income
- IMEI
-
International Mobile Equipment Identity
- ISMI
-
International Mobile Subscriber Identity
- IT
-
Information Technology
- LGA
-
local government area
- MNO
-
mobile network operator
- OD
-
origin–destination
- PURA
-
Public Utilities Regulatory Authority
- SIM
-
subscriber identification module
- SMS
-
short message service
Acknowledgments
We thank Horeja Cham, Lamin Dibba, Kristen Himelein, Kai Kaiser, Johan Mistiaen, Ryosuke Shibasaki, Matarr Touray, Tara Vishwanath, and participants at the UN 2020 conference on Big Data for official statistics, World Bank Poverty & Equity Brown Bang Lunch, and reviewers for helpful comments.
Funding Statement
This study received support from the World Bank Trust Fund for Statistical Capacity Building III (TFSCB-III) which is supported by the United Kingdom’s Foreign, Commonwealth & Development Office, the Department of Foreign Affairs and Trade of Ireland, and the Governments of Canada and Korea. This study was partially supported by Japan Society for the Promotion of Science (JSPS) Grants-in-Aid for Scientific Research (KAKENHI) Grant Number 20 K10447.
Competing Interests
We declare that we have no relevant or material financial interests that relate to the research described in this paper. The findings, interpretations, and conclusions expressed in this work do not necessarily reflect the views of the World Bank or any affiliated organizations, its Board of Executive Directors, or the governments they represent. The World Bank does not guarantee the accuracy of the data included in this work.
Author Contributions
Conceptualization, M.M., E.K., A.A., and A.W.; Methodology, A.A., A.W., E.K., and M.M.; Formal Analysis, E.K., M.M., and A.A.; Writing-original draft, E.K., A.A., M.M., and A.W., Writing-review & editing, E.K., A.A., and M.M.; Supervision, M.M.; Funding Acquisition, M.M. and A.A.
Data Availability Statement
The program codes and the aggregated statistics (if possible and currently under negotiations) will be made available through the GitHub platform (link here: https://github.com/worldbank/covid-mobile-data/tree/1b9f114abc9231964d9109f62df29a146912b4a2/cdr-aggregation#summary-of-indicators).


 Open access
Comments
No Comments have been published for this article.