


Introduction
The rise of China is making everyone scramble around the world. The semiconductor industry is no exception. Its rapid growth in chip sales and potential to close the technological gap have set off alarm bells for many governments and businesses. China has made it a top priority to enrich and upgrade its chip capabilities across the value chain—design, manufacturing, packaging, material inputs, and finished products—so that it can be less reliant on foreign producers. To many outside China, the Middle Kingdom is no longer “hiding its brightness (tāoguāng)” as it has “bided its time (yǎnghuì)” sufficiently enough to take the leading position in the global tech market.Footnote 1
It is well documented that China has ramped up efforts to enhance its chip capabilities through generous research and development (R&D) subsidies, tax and procurement incentives, and other preferential measures as illustrated by the homegrown innovation strategy known as “Made in China 2025 (MIC 2025).”Footnote 2 According to a report from the US Semiconductor Industry Association (SIA), “If China's semiconductor development continues its strong momentum … and assuming growth rates of industries in other countries stay the same, the Chinese semiconductor industry could generate $116 billion in annual revenue by 2024, capturing upwards of 17.4 percent of global market share,” surpassing Taiwan's and closing in on Europe's and Japan's, only to be surpassed by the United States and South Korea.Footnote 3
Other observers remain skeptical about China's tech self-sufficiency, let alone supremacy. Despite the quantitative growth of the Chinese semiconductor industry, China's technological competitiveness lags behind industry leaders. China's chip campaign has certainly made neck-breaking progress, but at the same time revealed structural weaknesses. In the past, China used cheap labor and accepted foreign technology and capital. Yet China's chip industry is running out of cheap labor with its workforce population in decline and has reached a saturation point of diminishing returns to adding more capital.Footnote 4 To China, technology acquisition either through equipment purchasing from or through technology licensing agreements with foreign companies used to be a principal way of adding productivity gains and innovation. Yet foreign technology is no longer a sustainable option as the United States is taking a series of restrictive measures against Chinese access to US technology and the technologies of its allies. Only recently has China begun to develop a greater capacity for indigenous technology.Footnote 5
This study begins with the following questions that remain unanswered in the existing literature: Is the Chinese semiconductor industry a game-changer or a paper tiger? Is there any significant gap between China's homegrown chip technology and foreign technology? Is China's indigenous chip technology attractive to, and usable by, foreign technology? One way to look into these half-empty/half-full questions is to track integrated circuits (IC)–related patent publications, which are deemed a good indicator of technological capacities. A glance at IC-related patent data available from the US Patent and Trademark Office (USPTO), the European Patent Office (EPO), and the China National IP Administration (CNIPA) shows that the growth in the number of publications for the past decade has been consistently translated into intellectual property assets. It is notable that the number of publications by China has been rising sharply.Footnote 6 A dramatic increase in the number of Chinese patents in some areas reflects China's rise on the world semiconductor stage. Yet the number of patent publications alone cannot be considered conclusive evidence of China's superior strength in chip technology.
Using a modified forward citation index as a proxy for technological innovation and impact, this study examines whether and to what extent existing IC-related patents published by the United States, South Korea, Japan, Taiwan, and China have interacted with each other. The target domain of this study is thin-film-transistor (TFT) technology, where China has recently registered a remarkable growth in patent publications. The panel display sector, where this technology domain is mainly utilized, is closely related to the IC technology that has been emphasized by the MIC 2025 strategy, especially at the local government level. For instance, Guangdong Province aims to establish “new-type panel display” as a future growth engine by fully utilizing its existing competitive edge in panel display manufacturing. In a similar vein, Hubei Province lists “new panel display” as part of its key MIC 2025 sectors.Footnote 7
The remainder of this study is organized as follows. Section 2 discusses the empirical and conceptual background and presents reasons why modified forward citation counts are useful in measuring the technological quality and intellectual value of a patent. Section 3 develops an estimation model to predict the way in which Chinese panel display-related IC patents interact with those of other countries. This study uses the zero-inflated negative binomial regression model for the following reasons: (1) the modified forward citation frequency is count data with overdispersion—that is, the presence of greater variability in a dataset than would be expected based on a mean–variance relationship; (2) at the same time, it is zero-inflated data with more than half of the data having a value of 0—that is, a majority of patents being never cited by other patents. Section 4 discusses the estimation results that support the proposed hypothesis: Despite the quantitative growth, Chinese semiconductor patents have weaker digital and intellectual footprints than their foreign counterparts. Section 5 draws conclusions and policy implications regarding the fact that China faces the challenge of achieving higher productivity and greater self-reliance, while having to survive in the escalating technological competition with other advanced countries. It concludes that China's push for chip supremacy has not been entirely successful in terms of patented knowledge creation and diffusion beyond its borders.
Empirical and conceptual background
China's dream for semiconductor technology
China's dream of becoming a semiconductor powerhouse traces back to the first decade of the Communist Party's victory and takeover of the mainland. As illustrated by the publication entitled “Outline for Science and Technology Development, 1956–1967,” China's State Council initiated industrial plans for semiconductor manufacturing and invested in factories and human resource training programs. However, its ambition and capacity-building effort were geared toward import-substitution-industrialization (ISI). For the first three decades, its semiconductor industry was characterized by the separation of R&D into state-run labs and manufacturing in state-owned enterprises (SOEs), showing limited capabilities for technology diffusion and integration.Footnote 8
It was only after Deng Xiaoping consolidated his power to carry out his radical economic reform that the modernized and IC-driven semiconductor industry began to make significant strides in catching up with more advanced nations. As part of the 6th Five-Year Plan (1981–1985) for the national economic and social development of the People's Republic of China, the State Council created the “Computer and Large-Scale IC Lead Group” chaired by Vice Premier Wan Li. The 6th Five-Year Plan effectively laid the foundation for the Chinese version of export-oriented industrialization (EOI). In the 1990s, partnership between the Chinese semiconductor industry and foreign companies became active, although the imported technology was not fully utilized by Chinese engineers. Before the new millennium, the development of and progress in the Chinese semiconductor industry were steady but slow, occasionally hindered by international export control regimes that restricted exports of conventional weapons as well as dual-use goods and technology to communist countries.Footnote 9
At the turn of the new millennium, China's rise in the global manufacturing market attracted ever more multinational corporations, especially in the semiconductor sector. During this period, technology acquisition either through equipment purchasing from or through technology licensing agreements with foreign firms was an important avenue for adapting its chip industry to global value chains.Footnote 10 Such a jump-start allowed China to become an increasingly visible chip producer on the world stage. China also became the world's largest importer of chips in 2005. In addition, notable progress was made in its homegrown technologies, although much of the intellectual property of what China exported was yet to be developed or financed by domestic actors.Footnote 11
Indeed, China has both significant technological advantages and disadvantages as a latecomer in the semiconductor industry. It has rapidly moved up the developmental ladder by accepting foreign technology and capital as well as using cheap labor. However, such a factor-driven approach may only work in the early stage of economic and technological development. Its cheap labor is running out and additional capital investment shows signs of diminishing returns. To China's further dismay, foreign technology is no longer a reliable option for building up national tech champions in the face of America's trade restrictions and a global campaign to blacklist its tech firms.Footnote 12 Standing against such headwinds, China is now pursuing technological self-sufficiency and innovation.
The second decade of the twenty-first century has marked a significant milestone for the Chinese semiconductor industry. Today, China imports more semiconductor chips than crude oil. China had a trade deficit of USD 233 billion in chips in 2020 by which time it produced only 16 percent of what it consumed domestically.Footnote 13 The buying power that comes from a one-third share of global semiconductor imports has given China an effective means for the weaponization of chips. At the same time, a sense of infancy and vulnerability has instigated the pursuit of technological self-reliance, as illustrated by the Guidelines to Promote National Integrated Circuit Industry (2014), Made in China 2025 (2015), and the Made in China 2025 Technical Area Roadmap (2015, 2018). In the semiconductor sector, Beijing has set a target of manufacturing 70 percent of its own use by 2025. It also set up a USD 23 billion National Semiconductor Fund in 2014, to which another USD 30 billion was added in 2019. Local governments have poured in an equivalent amount of funds as well. Its 14th Five-Year Plan (2021–25) has selected IC as one of seven core technologies to foster.Footnote 14
President Xi Jinping is one of the most pronounced advocates for technological self-sufficiency. His calls for self-sufficiency or dual circulation (shuāng xúnhuán) strategy reflect his concern about hidden risks that come with core technologies not being mastered domestically. He believes that China has become too reliant on Western technologies and institutions, especially those of America, which are allegedly jealous of China and thus willing to undermine its economic prosperity.Footnote 15 For him, silicon supremacy and self-sufficiency are different sides of the same coin: China has to establish a commanding position in high-tech products and to rely less on increasingly hostile Western partners so that no one can disrupt the “China dream.”Footnote 16 Under his push to establish silicon supremacy and self-sufficiency, the Chinese government has implemented aggressive industrial policies in support of core technologies and the most advanced chip manufacturing. Equally notable is the number of new firms in China rushing into the core chip sector. In 2020 alone, about 15,000 Chinese entities registered as semiconductor companies. Many of these new firms are fabless startups specializing in higher-end chip designs without owning manufacturing capacities. They are known to develop advanced chips, designing and taping out devices on bleeding-edge process nodes.Footnote 17
Chinese chips patent publications also show significant growth in size and importance.Footnote 18 Most notably, the share of patent publications based within China grew dramatically in the past decade. According to the USPTO, the total number of IC-related patents (H01L 27) issued from 2012–16 was 37,508, only 1,159 of which were Chinese.Footnote 19 For the same Cooperative Patent Classification (CPC) code, the total number of patents issued from 2017–21 was 51,606, 6,412 of which were Chinese.Footnote 20 Between these two periods, the number of Chinese patents increased more than fourfold, while the total number of patents increased about 38 percent. Such a sharp increase in the number Chinese patents perfectly fits the emerging image of China as a new semiconductor powerhouse. However, the quantitative aspect alone cannot suggest that it is only a matter of time for China to achieve greater technological self-reliance.Footnote 21 The following section discusses this issue separately.
Why patent citation analysis?
Patents allow their holders to benefit exclusively from their invention without having to worry about others replicating and selling their patented knowledge and technology. At the same time, knowledge spillover is an important aspect of patented invention. Disclosed patents serve as a source of technology transfer as well as future innovation.Footnote 22 In patent-related studies, simple patent counts (henceforth SPCs) have been widely used. Despite the intuitive appeal of SPCs, however, their scholarly utility is limited in that it cannot determine whether and to what extent a certain patented invention has any knowledge spillover effect.Footnote 23 Today, more consistent and comprehensive information is available and various measures—such as backward and forward citations, number of claims, and patent renewals—are used selectively depending on the analytical needs and the field of application.Footnote 24
A backward citation is a reference of a previously published document cited in the new patent application. Because patent citation serves to demarcate intellectual property rights enjoyed by patent holders, a backward citation includes not only a citation specified by the applicant but also a citation additionally identified by the patent examiner. The high frequency of backward citations means that the patent cites many previously published patents. As with the citations in academic literature, patent applicants describe existing patents without which the present patent would not have been possible. The omission of citations and references causes legal problems because patent citations limit the scope of profits that the right-holder appropriates from the patent.Footnote 25 It is patent examiners who determine what is missing and what should appear in the reference list of a newly submitted patent. References cited in patent citation data include both “application citations” and “examiner citations.”Footnote 26
Even if the omission of patents to be cited is addressed by examiner citations, the number of patent citations can still be biased, depending on the nature of the patent or the applicant's behavioral characteristics.Footnote 27 For instance, when a company files an application for a patent that has continuity with its previous patents, the company will have incentive to make self-citations. Some applicants may have a tendency to cite more prior patents than others. This kind of problem can arise not only with backward citations but also with claims, which are determined by the applicant. The Japan-based Semiconductor Energy Laboratory Co., Ltd., a transistor and semiconductor devices manufacturing company, offers a good example. The company's patents frequently cite its own patents as well as others’, and almost all its patents have more than 200 backward citations—a much higher frequency than other applicants in the same technical classification.
A forward citation is less sensitive to applicants’ deliberative behavior or inclination to cite their own patents than a backward citation as well as other assessment criteria. A patent's forward citation is by and large made by other patents, thus making it more difficult, if not completely impossible, to cite a patent applicant's published patents at the time of filing and application. A patent with a high forward citation count is thus likely to have high influence on, and value to, the technology involved. For this reason, the forward citation count of a patent is widely used to assess the ability of a patent to create knowledge spillover and to contribute to the capacity of innovation systems. Previous studies have demonstrated that a patent's forward citation is significantly correlated with the value of innovation.Footnote 28
However, a forward citation is not completely free from the inflated ratings and biases resulting from self-citations. This study modifies the conventional forward citation indexing method to measure the net diffusion effect of patented invention. The modified approach simply subtracts self-citations of patents filed by the same applicant from the total number of forward citation counts. In so doing, the modified forward citation index is capable of assessing the patent's spillover effect in both vertical and horizontal terms without having to worry about individual patents’ self-centric biases.
Estimation model
Dependent variable
The main goal of this study is to assess the performance of Chinese chip technology in terms of patented knowledge creation and diffusion beyond its borders compared to its competitors in the United States, South Korea, Japan, and Taiwan. The target variable is operationalized as an individual patent's forward citation counts excluding self-citations. To construct the dataset, this study uses the USPTO patent database under the field of H01L 27—the CPC code for integrated circuits—and the WIPS ON database.Footnote 29 Despite the rapid rise of Chinese patents in this technology field, they account for only 12 percent of the entire patents granted during the period of 2017–21—that is, 6,412 out of 51,606. Yet the subgroups under the H01L 27/1214 category have registered a shaper increase in Chinese patents than other subgroups, not only in terms of number but also in terms of patentability. Especially in the H01L 27/1288 subgroup below the H01L 27/1214 category, the ratio of Chinese patents increased from 6.8 percent in 2012 to 63.3 percent in 2019 and remains over 50 percent after 2017 onward.Footnote 30 This study thus focuses on this specific subgroup as it best illustrates the remarkable growth of China's chip patents granted under the USPTO during the period of 2017–21.Footnote 31
It should be noted that each patent's CPC coding is not mutually exclusive. One patent may have multiple CPC codes that are technically similar, or related, to the one at hand. For instance, patents with H01L 27/1288 as the CPC code are likely to have other CPC codes in different subgroups within the H01L 27/1214 category. This study focuses on the H01L 27/1288 subgroup (see Figure 1).Footnote 32

Figure 1. An illustrative structure of H01L 27 in the USPTO database
This study constructs modified forward citation indices for 952 patents granted under the H01L 27/1288 subgroup during the period of 2017–21 by subtracting self-citations of patents previously filed by the same applicant from the total number of the patent's forward citation counts.Footnote 33 Individual patents’ forward citation counts were collected from the WIPS ON database.Footnote 34 For example, US 9543329 and 9543338 are USPTO patents that have the same issue date—10 January 2017. The assignee of US 9543329 is the Mitsubishi Electric Corporation in Japan with three inventors of Japanese nationality. As of 5 October 2021, the search results for the WIPS ON database showed that US 9543329 had three forward citations, none of which were self-citations. US 9543329 is therefore coded with a value of 3 for the modified forward citation index. In contrast, US 9543338, which has a Chinese assignee (BOE Technology Group Co., Ltd.) with three Chinese inventors, has only one forward citation from a patent filed by the same assignee. Therefore, this patent is coded 0.
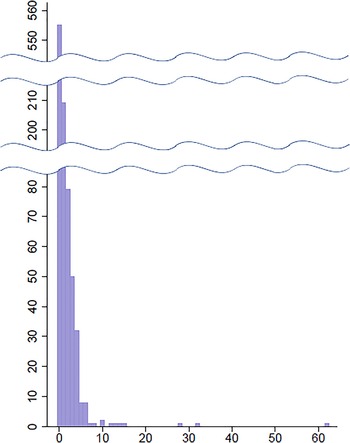
Table 1 presents the modified forward citation indices collected for this study. As with previous studies using forward citation counts, modified forward citation indices in the semiconductor industry have a highly skewed distribution, meaning that large variance exists in patents’ performance in terms of knowledge creation and diffusion beyond their national borders. A total of 555 cases out of 952 observations had a value of 0. In contrast, one patent in the dataset has been cited sixty-two times by other patents. The number of patents decreases as the value of the index increases, and only nine patents have been cited ten times or more. As illustrated in Figure 2, the modified forward citation index has a minimum value of 0 and a maximum value of 62 with an average value of 0.99.

Figure 2. Distribution of modified forward citation indices of 952 patents.
Table 1. Modified forward citation index of patents under H01L 27/1288 during the period of 2017–21.

Independent variable
Do semiconductor patents of Chinese national origin have a higher or lower technological spillover effect than others? For this study, a patent's national origin is the independent variable that predicts the way in which a patent interacts with other patents. Two separate but related models are estimated to systematically examine the spillover effect of individual countries’ semiconductor patents: China versus non-China (Model 1) and China versus four individual countries including the United States, South Korea, Japan, and Taiwan (Model 2). The main hypothesis to be tested is as follows: Semiconductor patents with Chinese national origin have a lower knowledge creation and diffusion effect as measured by modified forward citation counts than their counterparts of non-Chinese national origin.
The patent assignee's national origin is treated as the patent's national origin. The USPTO patent database provides not only assignees’ national origin but also that of inventors; however, here the two nationalities are identical for most patents, so there is no benefit in treating them separately. If a patent has assignees of multiple national origins, the country holding the majority is coded as the patent's national origin. In contrast, if there is no country holding such a majority, the patent inventor's nationality is used.Footnote 35
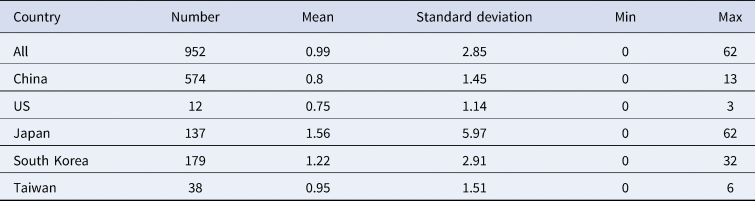
Patents with Chinese national origin accounted for 574 of the 952 cases (60.3 percent) in the H01L 27/1288 subgroup. The next most frequent national origin after China is South Korea, which has 179 cases (18.8 percent), followed by Japan (137 cases, 14.4 percent), Taiwan (38 cases), the United States (12 cases), and others (12 cases). On average, Chinese patents have been cited 0.80 times by others—slightly fewer than the overall average—and the maximum number of citations is 13. For patents of US origin, the number of citations ranges from 0 to 3, with an average of 0.75. Patents of Japanese origin are cited 1.56 times on average, more often than any other country's patents in this subgroup. South Korean patents are cited between 0 and 32 times, with an average of 1.22, the second most after Japan. Taiwanese patents are cited 0.95 times on average. Table 2 summarizes descriptive statistics of modified forward citation counts of individual countries.
Table 2. Descriptive statistics of modified citation indices by country.
This study uses a zero-inflated negative binomial regression model to estimate parameters, which fits overdispersed count data with most values equaling 0. The choice of model is based on the characteristics of the patent citation data, in which the number of times a patent is cited by other patents can be regarded as count data that records “citation” events. Thus, the modified forward citation index in this study is a count variable and, because there is an overdispersion among observations, the negative binomial distribution is more appropriate than the Poisson distribution to represent its distribution. In addition, only a small number of patents are frequently cited by other patents, while most patents have never been cited by other patents since filing. The modified forward citation indices of most patents are coded 0 accordingly (see Figure 2).Footnote 36
Control variables
A patent is likely to have more forward citations than other patents when it is older and has more patent claims, assignees, and inventors. To control the potential influence of such factors on the dependent variable, the estimation model includes dummy variables for the patent application year, number of patent claims, and number of patent assignees and inventors.
A patent's age is treated as an exposure variable in the negative binomial regression model. A patent for which an application has been submitted can be cited by others even before its registration. Therefore, the period of exposure to the forward citation event depends on when the patent is filed rather than when it is granted and registered. For this reason, this study uses the patent application year as a proxy for a patent's age. It is measured in terms of time lapse between the year of application and the year 2021, the year when the dataset was pooled and collected. For example, an application year variable has a value of 1 if the patent was filed in 2020 and a value of 2 if filed in 2019. It usually takes more than 18 months for a patent to be registered after application. The youngest patent is one year old—filed in 2020 and registered in 2021—and the oldest patent is ten years old—filed in 2011 and officially registered in 2020. The average age of the patents under the H01L 27/1288 subgroup is 4.64.
The numbers of patent claims, assignees, and inventors were pooled and collected as they appear in the USPTO database. The number of claims for all the patents under the H01L 27/1288 subgroup ranges from one to thirty-six, with an average value of 12.97. The number of patent assignees is one or two (average value of 1.23). If two or more companies jointly invest in developing technology and apply for a patent, they become joint assignees of the patent. The number of patent inventors ranges from one to eighteen, with an average value of 3.03. Table 3 presents descriptive statistics for control variables.
Table 3. Descriptive statistics of control variables.

Results
The estimation results support the hypothesis that Chinese semiconductor patents have a lower diffusion and spillover effect than other countries’ patents. This indicates that the rapid quantitative growth in the number of Chinese semiconductor patents has yet to be translated into a gravitational force to pull others within its sphere of influence.
First, the estimation results for Model 1 show that the estimated coefficient for Chinese national origin is –0.558 (p < 0.001), which means that a Chinese patent has a decreased expected number of modified forward citation counts by a factor of 0.573 (= e −0.558) compared to a non-Chinese patent. The estimated coefficients for the number of claims, inventors, and assignees are –0.0003, –0.020, and –0.001, respectively, but are not statistically significant. Table 4 summarizes the estimation results.
Table 4. Results of zero-inflated negative binomial regression (Model 1).
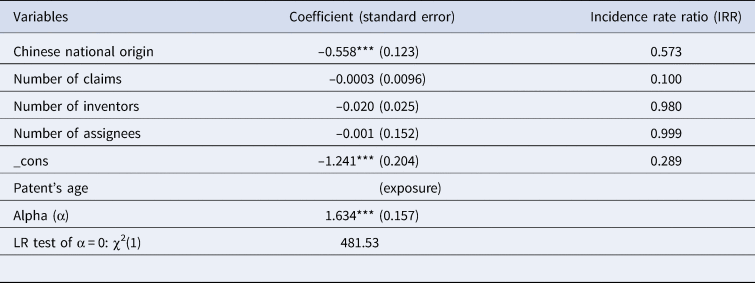
*** p < 0.001; ** p < 0.01.
Second, the estimation results for Model 2 also support the main hypothesis. In this model, China is the reference for patents’ national origin. The estimated coefficient for Japanese national origin is 0.770 (p < 0.001). Other things being equal, a Japanese semiconductor patent has an increased expected number of modified forward citation counts by a factor of 2.159 (= e 0.770) compared to a Chinese patent. The estimated coefficient for South Korean national origin is 0.471 (p < 0.01), meaning that a South Korean patent has an increased expected number of modified forward citation counts by a factor of 1.602 (= e 0.471) compared to a Chinese patent. The coefficients for US and Taiwanese national origins compared to China are –0.091 and 0.265, respectively. However, these estimated coefficients are not statistically significant. In Model 2, the estimated coefficients for the number of claims, inventors, and assignees are 0.0034, –0.008, and –0.160, respectively, which are not statistically significant. For both models, the α values are 1.634 and 1.597, respectively, rejecting the null hypothesis of α = 0. There is significant evidence of overdispersion in Model 1 (χ2 = 481.53, p < 0.001) and Model 2 (χ2 = 456.04, p < 0.001) according to likelihood tests of α. Therefore, the negative binomial regression model is preferred to the Poisson regression model.Footnote 37 Table 5 reports the detailed estimation results.
Table 5. Results of zero-inflated negative binomial regression (Model 2).
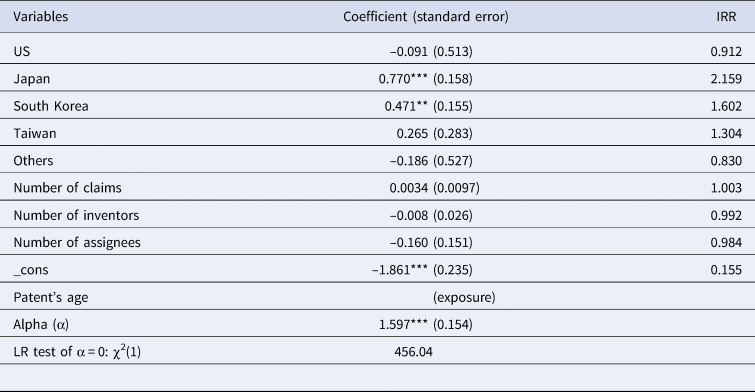
*** p < 0.001; ** p < 0.01.
The difference in the modified forward citation indices among 952 patents indicates not only the gap in technological value-added but also the difference in the potential for knowledge diffusion. Patents with higher modified forward citation indices have more opportunities to become technological ancestors of newly applied patents. For instance, US 9985055, which was filed by Sharp Kabushiki Kaisha (Sharp Corporation) on 15 August 2014 and registered on 29 May 2018, has H01L 27/1288 as one of its CPC codes and a value of 10 for the modified forward citation index as of 5 October 2021. Among those patents citing this Japanese patent, US 9954014 and US 10361229 have H01L 27/1288 as one of their CPC codes. In terms of the modified forward citation index, the latter has a value of 0. In contrast, the former shows quite an achievement considering its patent age.Footnote 38 Filed by LG Display Co., Ltd., it has three forward citations from the patents of Taiwanese company Innolux Corporation (US 10191345, US 10732475, and US 11003039) as of 5 October 2021. This illustrates knowledge diffusion across Japan, South Korea, and Taiwan. In this manner, patents which are frequently cited would have a large number of technological descendants over time. However, a patent with an index of 0 would not contribute to the spread of knowledge and remain isolated if the citation by others is maintained at 0 over some period, though a window of opportunity for forward citation is still open in the case of newly registered patents.
With these results alone, it is hard to tell whether China's technological advancement is stagnating due to the troubled and inefficient state capitalism. However, it is clear that China's pace of technological supremacy is overstated, especially outside China. Aside from their aspiration for technological supremacy, some Chinese patent applicants have a strong incentive to apply for multiple patents using the same technological content so that they can get more public funds by increasing their visibility. However, the USPTO strictly examines and monitors applicant's strategic behaviors such as divisional applications and continuation-in-part applications. Therefore, Chinese patent applications encouraged by generous subsidies have not always been translated into successful patent publications. There are also an increasing number of reports that many of those ambitious projects to catch up to the world's most advanced semiconductor makers have gone nowhere due in large part to reckless investment decisions and widespread corruption. The major suspect is state and party intervention in the governance of SOEs and the private sector as well as in the allocation of resources. It remains to be seen whether Chinese leadership will successfully transform its focus to promote high-value applications.Footnote 39 In this critical sector and others, the intensifying technological competition between China and other major countries will continue, not necessarily in favor of China.Footnote 40
Conclusion and implications
China has long dreamed of becoming a semiconductor powerhouse since the first decade of the Communist Party's takeover of the mainland. Yet it was only decades after reforming and opening its economy that China became the world's largest semiconductor consumer and emerged as a new semiconductor manufacturer. Especially for the past decade, the Chinese government has invested enormous amounts of funds and provided immense support to its semiconductor industry. In accordance with the government's aggressive and intensive campaign to mobilize both the public and private sectors to develop indigenous technology, the Chinese semiconductor industry has registered sharp quantitative growth as illustrated by a surge in IC-related patent registrations both within and outside mainland China.
This study attempted to answer the question that remains clouded by the sheer quantitative growth of the Chinese chip industry: Is Chinese semiconductor technology attractive to foreign inventors and their inventions? The impact of Chinese semiconductor technology on chip technology owned by other countries was analyzed through the lens of modified forward citation indices of panel display-related IC patents filed to and registered by the USPTO. A dataset of modified forward citation indices was constructed for 952 patents granted to applicants from the United States, South Korea, Japan, Taiwan, and China under the H01L 27/1288 subgroup during the period of 2017–21. The particular subgroup—H01L 27/1288—was selected because it represents not only the quantitative rise in Chinese patents but also its patentability during the period concerned.
The forward citation index is not a perfect measure by any means to determine the quality of patents. But tracking IC-related patent publications offers a reliable way that can capture the status of China's technological capabilities. As some studies have found, the growth in the number of patent publications has been translated into intellectual property assets across the world. It is therefore reasonable to hypothesize that an increase in the number of Chinese patents may portray China's growing inventiveness. The null hypothesis here is that the number of patent publications alone does not provide conclusive evidence of China's strength in chip technology.
For the past few decades, China has marked a milestone achievement in the target domain of this study, namely TFT technology, as reflected in the remarkable growth in patent publications. However, the estimation results of the zero-inflated negative binomial regression analysis revealed a different story: The Chinese semiconductor industry is not a game-changer as of yet in terms of its ability to influence knowledge creation and diffusion in other countries. This finding indicates that, aside from advanced production capacity gained through the acquisition and mastery of production skills, China's technological capability is yet to lead the industry.
Perhaps the Chinese chip industry is a paper tiger due in large part to reckless investment decisions and widespread corruption. However, this does not necessarily mean that the Chinese government's ambitious campaign for chip supremacy has gone nowhere. As with most things, the answer may lie somewhere in between. The Chinese economy has numerous strengths and opportunities with strong flexibility in terms of resilience and adaptability. There is little doubt that China will achieve near self-sufficiency, if not supremacy, in some key technologies. Yet China's push for more self-sufficient chip technology has not been entirely successful in terms of patented knowledge creation and diffusion beyond its borders.
This study has several limitations. First, hundreds of different knowledge domains are involved in the creation of semiconductors. However, the technology domain examined in this study covers only the panel display-related IC patents. Second, due to difficulties in data collection, this study analyzed only the forward citations of one subgroup among many IC-related patents. Future research will benefit from the utilization of other performance indicators such as yield and throughput. Third, as patents’ forward citations increase over time, the potential spillover effect of the latest patents is not fully captured and reflected in the estimation model. Accordingly, a follow-up study with a more comprehensive dataset is required for more precise analysis.
Conflict of interest
None.


 Open access