


1. Introduction
Tip vortex cavitation is the first type of cavitation that emerges in marine propellers, the generation of which is related to the low pressure at the vortex centre (Arndt Reference Arndt2002; Zhang et al. Reference Zhang, Zhang, Peng, Wang and Shao2015). The emergence of tip vortex cavitation is usually accompanied by a significant increase in noise radiation and large pressure fluctuations of the ship hulls, which influences the comfort level of passenger liners and the health of marine animals (Duarte et al. Reference Duarte2021). In addition, tip vortex cavitation also leads to a reduction of propulsion efficiency and possible erosion at the surrounding surface of the bubble collapse (Jahangir et al. Reference Jahangir, Ghahramani, Neuhauser, Bourgeois, Bensow and Poelma2021).
The inception of cavitation is related to the complex vortex system around the hydrofoil tip, featuring multiple streamwise vortices (Devenport et al. Reference Devenport, Rife, Liapis and Follin1996; Felli, Camussi & Di Felice Reference Felli, Camussi and Di Felice2011). The rolling up of the vortex induces a strong axial velocity and pressure gradient within the core region, and the vortex undergoes a decay process and breakdown due to vortex instability (Ganesh, Schot & Ceccio Reference Ganesh, Schot and Ceccio2014). The nuclei caught in the vortex filament grow rapidly at the centre with minimum pressure, resulting in a continuous cavity structure or intermittent elongated bubbles (Rood Reference Rood1991). The onset of cavitation further weakens the pressure gradient in the vortex core, resulting in a reduction in axial velocity (Park et al. Reference Park, Kim, Paik and Seol2021; Xie et al. Reference Xie, Liu, Jiang and Huang2021). The inception of cavitation depends on the distribution of the nuclei and the local pressure. The former reflects the local water quality or the tensile strength of the liquid (Arndt & Keller Reference Arndt and Keller1992). The latter is determined by the structure of the tip vortex.
The tip vortex is usually described by a semi-empirical Lamb–Oseen model, addressing the distribution of the azimuthal velocity. The model is based on the assumption that the vortex is of columnar shape and has zero velocity gradient in the streamwise and azimuthal directions. The viscous effect of the vortex core leads to a linear increase of the azimuthal velocity along the radial direction (Moore & Saffman Reference Moore and Saffman1973; Phillips Reference Phillips1981). However, the tip vortex is highly three-dimensional in nature near the tip, due to the strong interaction with the boundary layer and neighbouring vortical structures (Stinebring, Farrell & Billet Reference Stinebring, Farrell and Billet1991; Taira & Colonius Reference Taira and Colonius2009; Zhang et al. Reference Zhang, Hayostek, Amitay, He, Theofilis and Taira2020). Since the vortex is not axisymmetric in its initial development stage, it is challenging to predict the shape, strength and trajectory with existing vortex models even in the wetted flow (Pennings, Westerweel & Van Terwisga Reference Pennings, Westerweel and Van Terwisga2015b; Asnaghi, Svennberg & Bensow Reference Asnaghi, Svennberg and Bensow2020a).
After the inception of cavitation, the bubbles undergo volume oscillation and centreline displacement, promoting the generation of multi-scale vortical structures and flow unsteadiness. The velocity and pressure fluctuations induced by unsteady vortical structures are among the major sources of noise generation. Early studies mainly used the forms of cavities to identify the distribution of vortices. Arndt, Arakeri & Higuchi (Reference Arndt, Arakeri and Higuchi1991) show a series of cavitating vortex structures on the suction side of the hydrofoil under a low cavitation number. Besides the tip vortex, a secondary vortex is formed near the tip region due to flow separation (Maines & Arndt Reference Maines and Arndt1997b). The secondary vortex sheds from the tip, followed by a strong interaction with the tip vortex. In a recent large eddy simulation performed by Asnaghi et al. (Reference Asnaghi, Svennberg, Gustafsson and Bensow2020b), the mutual interaction between the multiple streamwise vortices and flow separation leads to the generation of a smaller-scale flow structure around the tip vortex. Bosschers (Reference Bosschers2019) speculated that the interaction between tip vortex cavitation and flow separation could be responsible for the collapse and rebound of the former structure. The flow separation over the hydrofoil is related to the supply of nuclei, and therefore influences the inception of the cavitation. Considering the interaction of multiple vortices, Choi, Oweis & Ceccio (Reference Choi, Oweis and Ceccio2003) found that the weaker secondary vortex is stretched and entwined with the tip vortex, anticipating the cavitation inception (Chang et al. Reference Chang, Choi, Yakushiji and Ceccio2012). Chang et al. (Reference Chang, Yakushiji, Dowling and Ceccio2007) visualized the interaction between co-rotating streamwise vortices experimentally and found the connection between the former structure by radial vortex bridges. The co-rotating vortices fluctuate and break into smaller-scale structures at the merging location, increasing the complexity of the flow features. Although basic guidelines have been provided on the distribution and interaction of vortical structures during the development stage of cavitation, more detailed quantitative experimental and numerical evidence is essential to further understand the unsteady vortex dynamics induced by cavitation.
The instability and breakdown of the tip vortex are related to the development of ‘Kelvin vortex waves’, featuring surface waves over the vortices (Thomson Reference Thomson1880). For non-cavitating conditions, the vortex instabilities of both airfoils and propellers have been extensively investigated. The instability modes for the vortex filament are arranged according to the azimuthal wavenumber. The first mode perturbs the vortex structure with an axisymmetric standing wave, leading to streamwise varicose variation of the vortex radius and vorticity (Saffman Reference Saffman1995). The second mode type is represented by a plane wave, which leads to sinusoidal centreline displacement of the vortex and is referred to as the ‘bending mode’ (Widnall, Bliss & Tsai Reference Widnall, Bliss and Tsai1974). The third mode with a higher azimuthal wavenumber yields a quadripolar disturbance, resulting in a double helix pattern and azimuthal deformation of the vortex (Moore & Saffman Reference Moore and Saffman1975; Tsai & Widnall Reference Tsai and Widnall1976). Roy et al. (Reference Roy, Leweke, Thompson and Hourigan2011) revealed the existence of these three mode types by performing experiments and linear stability analysis on the streamwise vortex pairs. They found the coherent structures obtained from the proper orthogonal decomposition (POD) are consistent with the result of linear stability analysis. The free-stream velocity affects the dominant disturbance patterns of the vortex, changing from the displacement mode to a coupling of the axisymmetric and double-helical modes. In order to select the dominant mode type, Edstrand et al. (Reference Edstrand, Davis, Schmid, Taira and Cattafesta2016) performed both linear stability and POD analyses and found that the bending mode leads to monotonic growth of the disturbance energy for an isolated vortex, resulting in the low-frequency wandering motion of the streamwise vortex centres. Recently, Qiu et al. (Reference Qiu, Cheng, Xu, Xiang and Liu2021) found both bending mode and double helix mode undergo asymptotic growth in space. The growth of the mode depends on the relative radius of the perturbed area of the mode compared with the vortex core.
For cavitating flow, the cavity could lead to the growth of vorticity fluctuations due to surface oscillation. A potential correlation is speculated between the instability mechanisms of the cavity and vortex, as both can be described and classified by ‘Kelvin waves’ (Fabre, Sipp & Jacquin Reference Fabre, Sipp and Jacquin2006). The patterns of the first three perturbation modes of cavity oscillation are similar to that of the isolated vortex, leading to volume variation, centreline position displacement and shape change, respectively. Bosschers (Reference Bosschers2008) derived the dispersion relation of the inviscid cavitating vortex with constant free-stream velocity. The resonance frequencies of the ‘breathing mode’ involving volume variation show good agreement with that of the generated abnormal noise obtained by Maines & Arndt (Reference Maines and Arndt1997a), which is called the ‘singing vortex’. The negative oscillation frequency indicates an interaction between the sheet and vortex cavity, which may cause a high disturbance amplitude. Pennings et al. (Reference Pennings, Bosschers, Westerweel and Van Terwisga2015a) further compared the theoretical solution of the cavitating vortex modes with the wavenumber–frequency diagram of the cavity structure obtained by high-speed videos. The fluctuations of cavity diameter match well with the dispersion spectrum of the breathing mode. Recent work by Liu & Wang (Reference Liu and Wang2019) deduced the dynamic equations of the surface modes for a cylindrical cavitation bubble. They suggested that the oscillation caused by the initial radial velocity triggers the onset of surface mode, which could produce narrowband noise. Although the vortex dynamics is significantly influenced by cavitation (Long, Long & Ji Reference Long, Long and Ji2020; Zhao, Wang & Huang Reference Zhao, Wang and Huang2015), to the best of our knowledge, the vortex instability under cavitating conditions has rarely been studied before. Particularly, there is the necessity to identify the dominant flow features that contribute to the vortical instability mechanism and its relation to cavity oscillation.
The vortex properties in two-phase flow can be obtained with the help of advanced optical instruments. The velocity fields of the tip vortex under cavitating and wetted flow conditions were compared by Dreyer (Reference Dreyer2015) using particle image velocimetry (PIV). It was found that the tangential velocity increases linearly outside the cavity and tends to be equal in the region beyond three times the vortex radius for both conditions, indicating that cavitation does not affect vortex circulation. However, due to the reflection of the cavity, the velocity field within the cavity is not captured. Pennings et al. (Reference Pennings, Westerweel and Van Terwisga2015b) further studied the streamwise development of the cavitating vortex by stereoscopic (stereo) PIV. A decay process of the axial velocity downstream of the hydrofoil was observed, similar to that of the wetted flow condition. The velocity distribution outside the cavity was well described by the Proctor vortex model, which can be used to predict the cavity size. Peng et al. (Reference Peng, Xu, Liu, Zhang, Cao, Hong and Yan2017b) captured a clear vortex wandering phenomenon under the wetted flow condition by employing stereo PIV. The offset trend of the tip vortex trajectory coincides with that of the cavitating condition. They indicated that the cavity emerges at the position of a smaller vortex radius, larger circulation and stronger turbulent kinetic energy. Despite the statistical analysis of tip vortex cavitation, further analysis of three-dimensional instantaneous flow organizations is still necessary to provide insight into the physical mechanisms of tip vortex cavitation.
The present study focuses on the effect of cavitation on the tip vortex dynamics generated by an NACA $66_2$-415 elliptic hydrofoil. Three-dimensional flow organization is captured by using time-resolved tomographic PIV. Experiments under different cavitation numbers are conducted to obtain various cavitation modes and to establish the connection between the cavity morphology and unsteady vortical structures. The measurement domain covers the range from the leading edge to the wake of the hydrofoil to address the full evolution of the structure. The streamwise vortex system and axial velocity distribution are analysed by the time-averaged flow field. The influence of cavitation on unsteady flow features and vortex wandering is analysed by the instantaneous flow organization. A POD analysis is performed to obtain the dominant unstable spatial mode of the vortex, shedding light on the instability mechanisms attributed to cavity surface oscillation.
2. Experimental set-up and flow conditions
2.1. Test facility and flow conditions
The experiments were conducted in the cavitation tunnel at the Institute of Fluid Engineering, Zhejiang University. The cross-section of the tunnel is  $200.5 \times 200.5$ mm $^2$ with a total length of 1020 mm. The contraction of the nozzle is 9, resulting in a maximum velocity of 10 m s $^{-1}$. The turbulent intensity is controlled below 0.5 %. The tip vortex cavitation was produced by an NACA
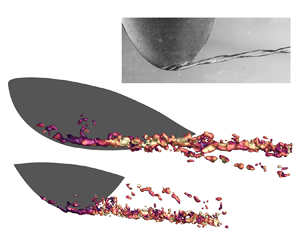
  $66_2$-415 elliptic hydrofoil, mounted along the symmetry plane of the sidewall of the test section, as shown in figure 1. The maximum chord ( $c$) and span ( $s$) of the model were 83.7 mm and 100.1 mm, respectively. The free-stream velocity $u_{\infty }$ was set to 5.0 m s $^{-1}$ for all the test cases, giving a chord-based Reynolds number of $Re_{c}=u_{\infty }c/\nu =4.3\times 10^{5}$, where $\nu$ is the kinematic viscosity of the fluid. The cavitation number is defined as $\sigma =(\,p_{\infty }-p_{v})/0.5\rho u_{\infty }^{2}$, where $p_{\infty }$ is the static pressure at the central location of the water tunnel, $p_{v}$ is the vapour pressure which is determined by the water temperature and $\rho$ is the water density. For the $p_{\infty }$ of 100 kPa and $p_{v}$ of 2.6 kPa at a temperature of 294 K, the cavitation number $\sigma$ is 7.8. The angle of attack was set to $9^{\circ }$ to anticipate vortex cavitation. The $x$,
$x$,  $y$ and $z$ axes correspond to the streamwise, wall-normal and spanwise directions, respectively. The origin of the coordinate system ( $o$) is located at the hydrofoil tip.

Figure 1. Conceptual sketch of tomographic PIV set-up: (a) laser illumination and imaging system, (b) fields of view (FOVs).
The tip vortex cavity is visualized by a high-speed camera (Phantom VEO-340L,  $2560\times 1600$ pixels) from the suction side of the hydrofoil, illuminated by a backlight LED. The camera is equipped with objectives of 105 mm focal length. The camera sensor was cropped into $1920\times 1080$ pixels, resulting in an acquisition frequency of 1.5 kHz. The cavity boundary is extracted based on the light intensity gradient, obtained by the Canny edge detection method (Canny Reference Canny1986). The cavity diameter is determined by the wall-normal distance between the top and bottom boundaries of the cavity at each streamwise location.
2.2. Tomographic PIV
The tomographic PIV system features four high-speed cameras (two Photron FASTCAM Mini AX100 and two Photron FASTCAM SA4,  $1024\times 1024$ pixels) arranged in a cross-like configuration with a maximum aperture angle of $40^{\circ }$, as shown in figure 1(a). The cameras were equipped with objectives of 105 mm focal length, which were tilted to match the Scheimpflug condition. The aperture was set at $f_{\#} = 22$. In order to eliminate the influence of laser reflection caused by the cavity interface, the flow is seeded with fluorescent particles with a density of 1188 kg m $^{-3}$ (Rhodamine B dye, $35\,\mathrm {\mu }{\rm m}$ average diameter). The particle concentration is 0.02 ppp to avoid the opaqueness effect. The tracer particles were illuminated by an Nd:YLF high-speed laser (Vlite-Hi-527–50, 50 mJ per pulse at 1 kHz). The fluorescent dye emits red light of 584 nm wavelength when illuminated by the 527 nm laser. The camera lens was equipped with long-pass filters, eliminating light with wavelengths below 560 nm. As a result, only the light emitted by the fluorescent particles was received. The laser sheet was expanded to 15 mm in the spanwise direction to capture the tip vortex. A mirror was set above the tunnel to reflect the laser sheet back, increasing the illumination intensity above the hydrofoil. The pulse separation time was set to $100\,\mathrm {\mu }{\rm s}$, yielding a particle displacement of approximately 10 pixels in the free stream for all flow conditions. In order to capture the development of tip vortex cavitation, two domains of interest were measured. The fields of view were both $53.4(x)\times 28.6(y)\times 15(z)$ mm $^{3}$. The streamwise range covers from upstream of the hydrofoil leading edge until 0.9 times the hydrofoil chord in the wake ( $x/c = [-0.3, 0.9]$), as shown in figure 1(b). The camera sensors were cropped in the vertical direction for both measurement domains, yielding an active size of $1024\times 512$ pixels. The resultant digital image resolution is 24.6 pixels mm $^{-1}$. The ensemble size of the dataset is 500 snapshots, acquired at 3200 Hz.
The system synchronization, image recording and processing were performed using LaVision Davis 10. The relation between object and image space is obtained by three-dimensional physical calibration using a dual-plane (Type 585) calibration target. Volume self-calibration was performed to further reduce the calibration disparity to less than 0.1 pixels (Wieneke Reference Wieneke2008). The camera simultaneous multiplicative reconstruction technique was used for volume reconstruction (Atkinson & Soria Reference Atkinson and Soria2009). Within the cavity, whose diameter is around 75 % of the vortex diameter, the particle concentration becomes relatively sparse, yielding 4–6 particles. The motion tracking enhancement algorithm in time-marching mode (Novara, Batenburg & Scarano Reference Novara, Batenburg and Scarano2010; Lynch & Scarano Reference Lynch and Scarano2015) was applied to further reduce the ghost particles and improve the reconstruction quality for low particle concentration conditions using several successive exposures. The velocity field is initially calculated, providing estimation for the following snapshots. The volume correlation has a final window size of  $32\times 32\times 32$ voxels ( $1.48\times 1.48\times 1.48$ mm $^{3}$) with 75 % overlap, resulting in a vector pitch of 0.37 mm. With the tip vortex diameter of approximately 4 mm in the current experiment, more than 10 vectors are obtained along the radial direction of the vortex, enabling the detection of the tip vortex system. The final uncertainty of the velocity field of each condition is summarized in table 1, which is estimated following Ye, Schrijer & Scarano (Reference Ye, Schrijer and Scarano2016) and Sciacchitano & Wieneke (Reference Sciacchitano and Wieneke2016).
Table 1. Uncertainty parameters of 500 snapshots for three flow conditions, where  $\varepsilon _{u}$ represents the uncertainty of the mean velocity, $\varepsilon _{(u')}$ is the uncertainty of the root mean square (r.m.s.) of the velocity fluctuations and $U_{\omega _{x} }$ represents the random errors of the streamwise vorticity.

2.3. Proper orthogonal decomposition
Proper orthogonal decomposition is an effective reduction technique for flow analysis (Berkooz, Holmes & Lumley Reference Berkooz, Holmes and Lumley1993), which decomposes the velocity fluctuation fields into multiple spatially correlated orthogonal modes, representing the spatial distribution of the most energetic fluctuation component (Van Oudheusden et al. Reference Van Oudheusden, Scarano, Van Hinsberg and Watt2005). In this work, the snapshot POD method (Sirovich Reference Sirovich1987) is applied to decompose the streamwise vorticity fluctuations ( $\omega ^\prime$) into orthonormal modes $\varphi _{n}(x,y,z)$ and time-dependent amplitude coefficients $\alpha _{n}(t)$ as
 \begin{equation} \omega^{\prime}(x, y, z, t)=\sum_{n=1}^{N} \alpha_{n}(t) \varphi_{n}(x, y, z), \end{equation}
where  $N$ represents the number of snapshots. Each instantaneous vorticity fluctuation obtained by PIV is aligned to one column of a data matrix X= $[\omega ^\prime (t_1), \omega ^\prime (t_2),\ldots, \omega ^\prime (t_N)]$. And each mode can be written as a combination of snapshots:
 \begin{equation} \varphi_{n}(x, y, z)=\frac{1}{N \lambda_{n}} \sum_{i=1}^{N} \alpha_{n}\left(t_{i}\right) \omega^{\prime}\left(x, y, z, t_{i}\right). \end{equation}
Here,  $\lambda _{n}$ values represent the energy contributions of POD modes and are automatically sorted in descending order.
3. Cavitation modes
The cavitation modes of different patterns are obtained by carefully adjusting the cavitation number. The dynamics of the tip vortex cavity is captured by high-speed images shown in figure 2. Initially, the free-stream static pressure of the flow was set below standard atmospheric pressure. Strong tip vortex cavitation incepts when the cavity is attached to the foil at  $\sigma = 4.1$, with the sheet cavity shedding from the suction side. The pressure was then continuously increased until the cavity features a stationary double helix, as shown in figure 2(a), referred to as ‘double-helical cavitation.’ A similar vortex cavity shape was observed in previous experimental research (Arndt et al. Reference Arndt, Arakeri and Higuchi1991; Pennings et al. Reference Pennings, Bosschers, Westerweel and Van Terwisga2015a; Peng et al. Reference Peng, Wang, Li, Xu and Song2017a). Peng et al. (Reference Peng, Wang, Li, Xu and Song2017a) found that this cavitation mode occurs before the vortex singing phenomenon. The cavity showed a twisted structure in space. The cross-section at the largest diameter features an elliptical shape. Arndt et al. (Reference Arndt, Arakeri and Higuchi1991) suggested that such a cavity shape originated from the initial twisting at the tip region. The temporal evolution of the cavity is provided in the supplementary material as movie 1, available at https://doi.org/10.1017/jfm.2023.465.

Figure 2. Instantaneous visualization of cavitation modes at four sequential times, (a) double-helical cavitation and (b) breathing mode cavitation. The time interval  $\Delta t$ is 2 ms.
As we continued to increase the static pressure, the cavity dimensions are reduced. The long and short axes of the ellipse tend to equalize. During the evolution, a particular cavitation mode emerges, with periodic contraction and expansion of the cavity, as shown in figure 2(b) and supplementary movie 2. The cavity shape corresponds to the ‘breathing mode’ of cavity oscillation, leading to significant cavity volume variations (Bosschers Reference Bosschers2008; Pennings et al. Reference Pennings, Bosschers, Westerweel and Van Terwisga2015a). As proposed by Maines & Arndt (Reference Maines and Arndt1997a), the breathing mode cavitation is the main contributor to the vortex singing phenomenon, generating abnormal acoustic noise (Peng et al. Reference Peng, Wang, Li, Xu and Song2017a). Pressurization was performed until the disappearance of cavitation. The cavitation number and static pressure of the current experiments are summarized in table 2. Cavitation disappears at  $\sigma =11.9$ due to the hysteresis phenomenon (Amini et al. Reference Amini, Reclari, Sano, Iino, Dreyer and Farhat2019; Zhang et al. Reference Zhang, Feng, Wang, Guo, Kang and Huang2022). Good repeatability of the cavitation pattern was achieved for the specified cavitation numbers.
Table 2. Cavitation number  $\sigma$ and corresponding static pressure $p_{\infty }$ for different test conditions.

The spatial and temporal variations of the cavity diameter are quantitatively analysed for both double-helical and breathing mode cavitation, as shown in figure 3(a). The spectral analysis of cavity diameter fluctuations is performed to identify the peak frequency of volume variation (figure 3b). For double-helical cavitation (figure 3ai,bi), the twisted shape results in diameter variation along the streamwise direction, exhibiting alternative peaks and valleys. The energy level of diameter fluctuations is trivial. On the other hand, the breathing mode cavitation exhibits a periodic variation in diameter both spatially and temporally. The most intense diameter fluctuation level appears close to the tip ( $x/c = [0.15, 0.4]$). The power spectrum of the cavity diameter fluctuations exhibits a fundamental peak frequency of 227 Hz and its harmonics, as shown in figure 3(b ii).

Figure 3. Spatial-temporal variation of cavity diameter (a) and spectral analysis of cavity diameter fluctuations (b); (i) double-helical cavitation; (ii) breathing mode cavitation.
It has been found that the oscillation frequency and the dominant stationary wave pattern are directly related to the cavity size (Maines & Arndt Reference Maines and Arndt1997a; Pennings et al. Reference Pennings, Bosschers, Westerweel and Van Terwisga2015a). The relation between wavelength and maximum cavity diameter at the present cavitating conditions is compared with previous results, as shown in figure 4. The trends for both cavitating conditions are similar to that of the stationary cavity measured in previous studies.

Figure 4. Comparison of the cavity size in the present experiment with the stationary cavity shape obtained from previous studies. The data are reproduced from Pennings et al. (Reference Pennings, Bosschers, Westerweel and Van Terwisga2015a), including their results at Delft and measurements from Maines & Arndt (Reference Maines and Arndt1997a) at SAFL and Obernach. The stars represent the cavitating conditions in figure 2.
4. Time-averaged flow field
The occurrence of cavitation influences the evolution of tip vortices. The time-averaged flow field is firstly examined by the iso-surfaces of non-dimensional streamwise vorticity  $\omega _{x}^{\ast }= \omega _{x}c/ u_{\infty }$ for wetted flow, breathing mode and double-helical cavitation, as shown in figure 5. For each flow condition, the vorticity fields of two measurement domains are combined to interpret the spatial evolution of the tip vortex. The cross-planes of $\omega _{x}^{\ast }$ at selected streamwise locations ( $x/c = 0, 0.12, 0.24 , 0.72)$ are presented in figure 6. The edge of the cavity extracted from the flow visualization is superimposed by the red dashed line. For all three conditions, a system of two streamwise vortices can be identified. The tip vortex originates from the leading edge, wrapping around the hydrofoil and developing downstream following the streamwise direction after passing the tip. The tip vortex is mainly caused by the effect of differential pressure, rolling up above the suction side of the hydrofoil. High vorticity magnitude is sustained over the measurement domain. A weaker secondary streamwise vortex emerges at the trailing edge of the hydrofoil, closer to the root area in the spanwise direction compared with the tip vortex. The former vortex is produced by the flow separation close to the trailing edge (Arndt et al. Reference Arndt, Arakeri and Higuchi1991). Following the three-dimensional nature of the wake separated from the finite-aspect-ratio hydrofoil, the secondary vortex aligns in the streamwise direction (Zhang et al. Reference Zhang, Hayostek, Amitay, He, Theofilis and Taira2020). When evolving downstream, the secondary structure spatially detaches from the tip vortex with decreasing magnitude and size, indicating the insignificance in the wake region.

Figure 5. Iso-surfaces of non-dimensional streamwise vorticity  $\omega _{x}^{\ast }=20$ for three flow conditions: (a) wetted flow, (b) breathing mode cavitation and (c) double-helical cavitation. The dash-dot line indicates the neighbouring edge of the two measurement domains.

Figure 6. Cross-plane contour of non-dimensional streamwise vorticity: (a) wetted flow, (b) breathing mode cavitation and (c) double-helical cavitation; (i–iv)  $x/c = 0, 0.12, 0.24$ and 0.72. The white dashed line represents the cross-sectional profile of the hydrofoil at the maximum span location. The red dashed line represents the edge of the cavity.
For the wetted flow (figures 5a and 6a), the tip vortex has an elliptical shape around the tip due to the interaction with the boundary layer. The former vortex develops rapidly into a cylindrical-shaped structure when moving downstream. The tip vortex gradually deflects upward and toward the wing root after detaching from the hydrofoil. The magnitude of streamwise vorticity increases at this stage, reaching the maximum of  $\omega _{x}^{\ast }=140$ at $x/c = 0.24$ (figure 6aiii), followed by monotonic decay downstream (figure 6aiv). The vortex decay process has also been found by Garmann & Visbal (Reference Garmann and Visbal2017b) and Edstrand et al. (Reference Edstrand, Sun, Schmid, Taira and Cattafesta2018). The vortex core area can be regarded as solid body rotation where the vorticity is concentrated and the viscous effect is negligible (Phillips Reference Phillips1981). The vortex radius, being defined as the distance from the vortex centre to the point that has the maximum azimuthal velocity, remains relatively constant at approximately 0.014 $c$ from $x/c = 0.4$.
For breathing mode cavitation, the tip vortex deforms from the cylindrical shape downstream of the tip due to the volume and diameter variation of the vortex cavity (figures 5b and 6bii–biv). The vorticity magnitude is significantly lower due to the onset of cavitation (Dreyer Reference Dreyer2015; Pennings et al. Reference Pennings, Westerweel and Van Terwisga2015b; Xie et al. Reference Xie, Liu, Jiang and Huang2021), yielding a maximum value of  $\omega _{x}^{\ast }=95$ at $x/c = 0.12$ (figure 6bii). The onset of the decay process of the streamwise vortex moves upstream to $x/c = 0.24$ (figure 6biii). The vortex radius increases in the range of $x/c = [0, 0.12]$, reaching an invariant value of approximately 1.4 times that in the wetted flow condition.
For the double-helical cavitation (figures 5c and 6c), for which the cavitation number is the lowest, the tip vortex features a helical shape until the most downstream region, which does not diffuse into the circular cylinder pattern. The wavelength  $\lambda _{helical}/c$ of the helical structure is 0.3, being identical to that of the cavity (see figure 2a). The topological similarities indicate that the tip vortex structure is strongly influenced by vortex cavitation. The cross-sectional shape of the vortex varies in the streamwise direction, yielding a vortex radius of 1.5 times that of the wetted flow condition (figure 6c). Lower vorticity magnitude and a faster decay process are observed compared with the other conditions.
The streamwise evolution of the tip vortex trajectory is provided to quantify the spatial variation of the vortex centre, as shown in figure 7. The vortex centre is calculated by the weight of vorticity (Bertényi & Graham Reference Bertényi and Graham2007; Cheng et al. Reference Cheng, Qiu, Xiang and Liu2019), defined as
 \begin{equation} y_{c}=\frac{\iint y \omega_{x} \,{{\rm d} y}\, {\rm d} z}{\iint \omega_{x} \,{{\rm d} y} \,{\rm d} z},\quad z_{c}=\frac{\iint z \omega_{x} \,{{\rm d} y} \,{\rm d} z}{\iint \omega_{x} \,{{\rm d}y} \,{\rm d} z}. \end{equation}
Figure 7. Trajectory of the time-averaged tip vortex: wetted flow (green), breathing mode cavitation (red) and double-helical cavitation (blue); the solid and dashed lines correspond to the positions of the  $y$ and $z$ axes of the vortex centre, respectively.
For wetted flow, the initial trajectory of the vortex develops along the leading edge of the hydrofoil, which gradually deflects towards the root after reaching the tip in the spanwise direction. In the wall-normal direction, the tip vortex reaches the lowest position at  $x/c=0.1$ where the vortex detaches from the trailing edge, rising upwards downstream. After the onset of cavitation, the tip vortex further lifts away from the hydrofoil and deflects closer to the root after $x/c=0$ with decreasing cavitation number. Compared with the breathing mode, the tip vortex in double-helical cavitation has a spatially periodic bending feature, consistent with the cavity morphology.
In order to further quantify the effect of cavitation on the tip vortex, azimuthal velocities along the vortex diameter in the wall-normal direction are extracted for three conditions at  $x/c = 0.72$, as shown in figure 8. The Lamb–Oseen model (Caflisch & Lamb Reference Caflisch and Lamb1993) for the non-cavitating condition is compared with the results (Dreyer Reference Dreyer2015), which is given by
 \begin{equation} u_{\theta}=\frac{\varGamma}{2 {\rm \pi}r}(1-\exp({-\alpha(r / r_{v})^{2}})), \end{equation}
where  $\varGamma$ is the circulation, $r_{v}$ is the viscous core radius and $\alpha =1.256$, shown by the black dashed line in figure 8. The tip vortex under cavitating conditions has a larger viscous core radius and a smaller maximum azimuthal velocity. Away from the vortex centre $|r/c |> 0.04$, the profile of the three conditions tends to collapse, indicating equal circulation (Dreyer Reference Dreyer2015). Both the maximum azimuthal velocity and vortex radius over the suction side of the hydrofoil exceed those in the opposite wall-normal direction. As a result, the azimuthal velocity distribution agrees with the Lamb–Oseen model around the vortex centre ( $-0.01< r/c<0.02$), but is smaller than the predicted value on the negative side.

Figure 8. Time-averaged azimuthal velocities at  $x/c = 0.72$ in comparison with Lamb–Oseen model.
The instability and breakdown of vortex structure are related to the axial velocity distribution at the vortex core (Hall Reference Hall1972; Leibovich Reference Leibovich1978; Smith & Ventikos Reference Smith and Ventikos2021). The streamwise vortices produce momentum transport between the pressure and suction side of the hydrofoil, leading to modification of the mean flow field. The cross-plane contours of non-dimensional axial velocity difference  $u_{d}/u_{\infty }=(u-u_{\infty })/u_{\infty }$ at $x/c$ = 0.12, 0.24, 0.48 and 0.72 are shown in figure 9, indicating similar patterns for all three conditions. Close to the tip ( $x/c$ = 0.12, figure 9ai,b i ci), the development of the tip vortex is accompanied by an increase in the circulation, overwhelming the momentum defect caused by the hydrofoil boundary layer, inducing the velocity excess region and featuring a ‘jet-like’ axial velocity distribution (Dreyer et al. Reference Dreyer, Decaix, Münch-Alligné and Farhat2014). The maximum velocity excess varies from $u_d/u_{\infty }$ = 0.09 (figure 9bi) to $u_d/u_{\infty } = 0.12$ (figure 9ai,ci). Moreover, velocity deficit is induced on top of the jet-like flow. The velocity deficit reduces with the decrease of cavitation number at $x/c$ = 0.12 (figure 9ai,bi,ci).

Figure 9. Streamwise development of non-dimensional axial velocity difference  $u_{d}/u_{\infty }$: (a) wetted flow, (b) breathing mode cavitation and (c) double-helical cavitation; (i–iv) $x/c = 0.12, 0.24, 0.48$ and 0.72. The grey dashed line represents the cross-sectional profile at the maximum span of the hydrofoil. The red dashed line represents the edge of the cavity. Jet-like (JL), wake-like (WL) and velocity deficit (VD) are noted.
For the wetted flow condition, the magnitudes of velocity excess and deficit increase to  $u_{d}/u_{\infty } = 0.16$ and $-$0.1 downstream at $x/c = 0.24$, respectively, as shown in figure 9(aii). A new low-speed region of comparable magnitude forms at $y/c = -0.1$, $z/c = 0$, similar to the ‘wake-like’ profile, corresponding to the active area of the secondary vortex. Further downstream at $x/c = 0.48$ and 0.72 (figure 9aiii,aiv), the jet-like axial velocity at the vortex core is weakened by the adverse pressure gradient in the wake (Pennings et al. Reference Pennings, Westerweel and Van Terwisga2015b), corresponding to the decay process of the streamwise vortex and the increase in vortex diameter at this stage.
For the breathing mode condition, the amplitude of velocity exceed increases to  $u_{d}/u_{\infty }$ = 0.13 at $x/c = 0.24$ (figure 9bii) and is followed by a rapid decrease when evolving downstream (figure 9biii,biv). A lower magnitude is obtained compared with the wetted flow condition. The presence of the cavity increases the vortex radius, accompanied by a pressure increase around the cavity and a decrease in velocity excess (Batchelor Reference Batchelor1964; Garmann & Visbal Reference Garmann and Visbal2017a). The pressure in the cavity is approximately equal to the vapour pressure, thus reducing the axial pressure gradient (Xie et al. Reference Xie, Liu, Jiang and Huang2021). On the other hand, the velocity deficit regions evolve downstream with comparable intensity to the wetted flow condition.
For double-helical cavitation, the twisted vortical structure with spatial variation leads to a quasi-periodic change of axial velocity in the streamwise direction (figure 9cii,civ), indicating a strong link between the cavity morphology and axial velocity. The stretching and compression behaviour of the tip vortex results in periodic transitions between the velocity deficit and exceed at the vortex core when evolving downstream, inducing a stagnation point along the vortex core. The velocity deficit sustains a high intensity of  $u_{d}/u_{\infty } = -0.09$ at the most downstream station (figure 9civ). As a result, faster growth of vorticity disturbances is expected for double-helical cavitation (Ragab & Sreedhar Reference Ragab and Sreedhar1995).
5. Instantaneous flow organization
5.1. Unsteady vortex structures
The emergence of vortex cavitation leads to unsteady flow features in and around the tip vortex. The subscale vortical structures contribute to the production of velocity and pressure fluctuation energy. The instantaneous flow organization of vortex structures both upstream and downstream is visualized using the  $\lambda _{2}$ criterion (Jeong & Hussain Reference Jeong and Hussain1995) and colour coded by the non-dimensional streamwise velocity $u/u_{\infty }$ for three flow conditions in figure 10–12. The tip vortex originating from the hydrofoil leading edge remains the dominant flow feature for all conditions. According to the instability analysis of the streamwise vortex, Kelvin waves propagate over the surface of the vortex due to the strain effect, leading to the vortex internal displacement and deformation (Moore & Saffman Reference Moore and Saffman1975; Leweke, Le Dizes & Williamson Reference Leweke, Le Dizes and Williamson2016).

Figure 10. Instantaneous flow organization for both upstream (left) and downstream (right) domains of wetted flow, detected by the  $\lambda _{2}$ criterion and colour coded by the non-dimensional axial velocity $u/u_{\infty }$: (a) side view, (b) top view and (c) zoomed side view.

Figure 11. Instantaneous flow organization of breathing mode cavitation: (a) side view, (b) top view and (c) zoomed side view.

Figure 12. Instantaneous flow organization of double-helical cavitation: (a) side view, (b) top view and (c) zoomed side view.
For the wetted flow case in figure 10, wavy motion develops over the cylindrical-shaped tip vortex surface (figure 10c), similar to the observation of previous numerical simulations (Asnaghi et al. Reference Asnaghi, Svennberg and Bensow2020a; Cheng et al. Reference Cheng, Long, Ji, Peng and Farhat2021; Xie et al. Reference Xie, Liu, Jiang and Huang2021). Vortex shedding appears over the suction side of the hydrofoil due to flow separation (figure 10(a,b) side and top view). The former structures move towards the hydrofoil tip and interact with the tip vortex around  $x/c = 0.1$, leading to noticeable streamwise undulation and diameter variation of the streamwise vortex. The time sequences of the unsteady motion are provided in supplementary movies 3 and 4. The secondary vortices shed from the trailing edge with discontinuous character and decay rapidly downstream. From the top view, periodic shedding of spanwise substructures forms due to flow separation in the hydrofoil wake. The former substructures originate from the secondary vortex filaments, being entrained into the tip vortex in the range of $x/c$ = [0.2, 0.4] and leading to local stretching of the tip vortex structure. (see figure 10(b), top right and supplementary movies 3 and 4).
Under cavitating conditions, the complexity and unsteadiness of the three-dimensional structure increase noticeably with the decrease of cavitation number (figures 11 and 12), indicating the contribution of cavity surface fluctuations on the unsteadiness of the vortical structures. Stronger vortex shedding is produced over the hydrofoil with decreasing cavitation number (top view), leading to more intense interaction and vortex stretching. Arndt et al. (Reference Arndt, Pennings, Bosschers and Van Terwisga2015) claimed that the waves over the cavity surface travel upstream and interact with the boundary layer near the tip, causing violent flow instabilities (Arndt et al. Reference Arndt, Pennings, Bosschers and Van Terwisga2015). For breathing mode cavitation (figure 11a,b), the tip vortex exhibits strong vortex deformation at the interaction point. Hairpin-like structures emerge over the tip vortex due to the intensified shear layer instability around the cavity interface, featuring an arch shape (Stinebring et al. Reference Stinebring, Farrell and Billet1991; Asnaghi et al. Reference Asnaghi, Svennberg and Bensow2020a). These structures appear when the tip vortex detaches from the hydrofoil ( $x/c > 0.1$). The latter vortex bifurcates into two branches at $x/c = 0.2$ and 0.4, which quickly reconnect into a single vortex (figure 11c). The legs of the hairpin vortex align in the streamwise direction with a distance of 0.04 $c$. Different from the cylinder-like structures in wetted flow, the tip vortex in breathing mode cavitation is closer to a prismatic shape with an apparent spiral around the vortex centreline. The notable temporal shape and diameter variations of the tip vortex are produced (see supplementary movies 5 and 6). However, its periodic character is not as clear as the volume variation of the cavity shown in figure 2(b).
For the double-helical cavitation (figure 12a,b and supplementary movies 7 and 8), the separated vortex structures become more populated and rather dominant. The intensified interaction between flow separation and tip vortex contributes to more prominent streamwise undulation and deformation of the streamwise vortical structure. The spatial periodic shape variation of the twisted cavity leads to vortex stretching (Ji et al. Reference Ji, Luo, Arndt and Wu2014). The notable growth of Kelvin–Helmholtz instability over the tip vortex produces highly populated hairpin vortices with increased size compared with that of the breathing mode cavitation. The former vortex grows into a complete hairpin shape. The legs of the hairpin ride over the tip vortex, yielding a size of 0.05 $c$ (figure 12c). Both the fluctuations of the cavity surface and the interaction between the tip vortex and the separated vortices should be responsible for this phenomenon. The deformation of the tip vortex implies faster growth of elliptical instability in the cavitation flow (Kerswell Reference Kerswell2002). Although the twisted shape corresponding to that of the cavity (figure 2a) can still be identified, the smaller-scale features prevail in the unsteady flow field, revealing the effect of the elliptical-shaped cavity on perturbation growth.
5.2. Tip vortex wandering
The development of an unsteady tip vortex with streamwise undulation leads to displacement of the vortex centre, corresponding to the wandering motion. The vortex centre is calculated by the (4.1a,b). The spatial distributions of the vortex centres of 500 snapshots at three different streamwise locations  $(x/c=0.4, 0.6, 0.8)$ are shown in figure 13. The distribution of vortex centres falls in the range of elliptical shapes for all streamwise locations. Under the wetted flow condition, the vortex centre distribution of the selected three streamwise cross-sections ( $x/c=0.4, 0.6, 0.8$) appears to be a round shape, as shown in figure 13(a). The lengths of the long and short axes of the 90 % confidence ellipses are both 0.007 $c$.
$c$.

Figure 13. The vortex centre distribution at different streamwise locations with 90 % confidence ellipses: (a) wetted flow, (b) breathing mode cavitation and (c) double-helical cavitation. The red star is the centre of each ellipse, denoting the mean vortex centre.
For cavitating conditions in figure 13(b,c), the vortex centre becomes more dispersedly distributed, revealing a stronger wandering motion (Edstrand et al. Reference Edstrand, Davis, Schmid, Taira and Cattafesta2016; Qiu et al. Reference Qiu, Cheng, Xu, Xiang and Liu2021). The cavity volume and shape variation leads to an elliptical distribution of the vortex centres. For the breathing mode cavitation (figure 13b) the long axis of the ellipse aligns at an angle of  $7^{\circ }$ and $20^{\circ }$ with respect to the horizontal axis at $x/c = 0.4$ and 0.6, respectively, indicating spanwise wandering motion. For double-helical cavitation, the angle increases to approximately $80^{\circ }$. The long axis aligns closer to the wall-normal direction, indicating a significant change in the dominant wandering direction (figure 13c). The mean vortex centre moves closer to the root at the selected locations with decreasing cavitation number, revealing a faster initial vortex growth and spanwise development. The trajectory of the tip vortices is varied by cavitation onset in both instantaneous and time-averaged flow fields (§ 4), which is different from the previous assumption of the invariant trajectory (Arndt et al. Reference Arndt, Arakeri and Higuchi1991).
6. Vorticity fluctuations
To distinguish the effect of cavitation mode on the growth of the vorticity disturbance, the integrated disturbance energy of the tip vortex is applied to quantify the magnitude of the perturbation (Ergin & White Reference Ergin and White2006; Ye, Schrijer & Scarano Reference Ye, Schrijer and Scarano2018), as
 \begin{equation} \varepsilon_{r m s}(\omega_{x})=\iint_{S}(\omega_{x_{r m s}}^{\prime} c / u_{\infty})^{2} \,\mathrm{d}\left(\frac{y}{c}\right) \,\mathrm{d}\left(\frac{z}{c}\right), \end{equation}
where  $\omega _{x_{r m s}}^{\prime } c / u_{\infty }$ represents the non-dimensional streamwise vorticity fluctuations.
The streamwise evolution of the integrated disturbance energy is shown in figure 14. Logarithmic growth is produced at the early formation stage of the tip vortex close to the leading edge ( $x/c = [-0.17, -0.14]$) (stage I), corresponding to a rapid accumulation of vorticity at the leading edge. Downstream around the hydrofoil tip area of $x/c = [-0.14, 0.12]$, the second growth of $\varepsilon _{r m s}$ is produced with lower growth rate (stage II). The magnitude of the disturbance energy curves almost collapses for all three conditions in the former stages. Further downstream in stage III, the disturbance energy decreases for the wetted flow condition due to vortex decay. On the other hand, for the breathing mode, the disturbance energy continues to grow, reaches the maximum at $x/c = 0.18$, and is followed by a plateau downstream. The maximum disturbance energy is 1.3 times that for the wetted flow condition, which confirms the effect of cavitation on the growth of unsteadiness of the vortical structures. For double-helical cavitation, an even higher disturbance energy is achieved. A periodic growth and decay is observed when $x/c > 0.33$ corresponds to the peaks and valleys of the surface wave over the tip vortex (see figure 5c).

Figure 14. Streamwise evolution of integrated disturbance energy of the vortex for upstream: I, logarithmic growth; II, mild growth and III, plateau or decay. The dashed lines in the range of  $x/c= [ 0.26, 0.33 ]$ correspond to the boundaries of FOVs A and B, where the disturbance energy is contaminated by the measurement uncertainty.
7. The POD analysis of the tip vortex
The snapshot POD analysis was performed for the streamwise vorticity fluctuations  $\omega _{x}^\prime$ to reveal the most energetic vorticity fluctuation pattern. The unstable eigenmode could lead to vortex displacement, deformation or breakdown. The wetted flow and breathing mode conditions are analysed. The latter case exhibits large cavity-induced volume variation and is related to the vortex singing phenomenon (Peng et al. Reference Peng, Wang, Li, Xu and Song2017a). The double-helical cavitating condition is not discussed in detail due to the similarity of the mode pattern. The analysis is performed separately for the upstream and downstream measurement domains. To address the unstable mode of the tip vortex, limited streamwise ranges of $x/c = [0, 0.28]$ and $[0.38, 0.83]$ are selected for the upstream and downstream domains, respectively. The domain is also cropped in the spanwise and wall-normal directions to remove the measurement noise at the boundary. An ensemble size of 500 snapshots is used in the analysis for each flow condition.
The energy distribution of the first 100 POD modes is plotted in figure 15. Only a small energy variation between low- and high-order modes is observed in the current analysis, which is due to the presence of multi-scale flow structures that play a role in the development of the tip vortex, especially under cavitating conditions. A similar flat energy distribution has also been observed in the streamwise vortex over a slender delta wing (Ma, Wang & Gursul Reference Ma, Wang and Gursul2017), the unsteady base flow at supersonic conditions (Humble, Scarano & Van Oudheusden Reference Humble, Scarano and Van Oudheusden2007) and the transitional boundary layer induced by isolated roughness (Ye et al. Reference Ye, Schrijer and Scarano2018).

Figure 15. Relative energy distribution of the first 100 POD modes: (a) upstream domain and (b) downstream domain.
As a result, the relative disturbance energy of every single mode does not directly represent its importance to the coherent structures. On the other hand, the agreement between the pattern of POD modes, the development of specific unsteady flow features and related vortex instability modes becomes critical in identifying the relevance of the modes of the tip vortex. Two major types of modes are selected: the first type corresponds to the centreline displacement perturbation of the tip vortex and is related to the vortex wandering phenomenon; the second type corresponds to the deformation of the tip vortex, specifically the change of shape and size of the tip vortex along the streamwise direction.
7.1. Patterns of POD modes
7.1.1. Wetted flow condition
For the wetted flow condition, the modes 1, 2 and 15 are selected as the representative POD modes in the upstream domain, as shown in figure 16 by the iso-surface of the streamwise vorticity fluctuation component ( $\phi /u_{\infty }$). Cross-sections at the featured location of each mode are extracted for ease of interpretation. Mode 1 with the highest disturbance energy exhibits a pair of vorticity fluctuation patches of alternating sign, corresponding to the displacement mode, as shown in figure 16(a). This mode is responsible for the wandering motion of the vortex centre (Del Pino et al. Reference Del Pino, Lopez-Alonso, Parras and Fernandez-Feria2011). It is similar to that induced by the dipole surface oscillation mode of the cavity (Bosschers Reference Bosschers2008) and the streamwise vortex (Leweke & Williamson Reference Leweke and Williamson1998; Chen, Wang & Gursul Reference Chen, Wang and Gursul2018). The vortex filament changes the vorticity distribution on both sides of the vortex core, leading to serpentine centreline displacement (Fabre et al. Reference Fabre, Sipp and Jacquin2006). Mode 2 demonstrates a similar pattern with a node around $x/c = 0.1$ (figure 16b). For both modes, the centreline displacement appears in the vertical direction when $x/c < 0.08$ due to the blockage of the three-dimensional hydrofoil (figure 16ai,bi). The patches detach from the hydrofoil at $x/c = 0.1$ and rotate to an angle of $45^{\circ }$ when $x/c > 0.2$ (figure 16aii,bii), in accordance with the rotation direction of the vortex. The spanwise displacement motion at this stage (figure 16aii,bii) also agrees with the trajectory of the tip vortex in figure 7.

Figure 16. Vorticity fluctuation component of POD modes for the wetted flow condition ( $\phi /u_{\infty } =2\times 10^{-3}$) in the upstream domain: (a) mode 1, (b) mode 2 and (c) mode 15. Cross-plane contours are superimposed at $x/c=0.08,0.2$.
The first clear appearance of the deformation perturbation is in mode 15 in the upstream domain with much lower disturbance energy. It exhibits a quadrant distribution of positive and negative vorticity fluctuation components shown in figure 16(c), following a similar pattern to the most unstable Kelvin modes with a constant axial flow (Lacaze, Ryan & Le Dizes Reference Lacaze, Ryan and Le Dizes2007). The pattern leads to the surface deformation of the tip vortex (Roy et al. Reference Roy, Leweke, Thompson and Hourigan2011), including both size and shape. The deformation mode initially occurs near the trailing edge of the hydrofoil ( $x/c > 0.08$), associated with the stress effect caused by the hydrofoil boundary layer. This mode causes the tip vortex to develop into an elliptical shape.
In the downstream domain, modes 1 and 7, which correspond to the first appearance of the two perturbation types, are selected to show the dominant unsteady vortical patterns, as shown in figure 17. Similar to the upstream domain, the most energetic mode 1 (figure 17a) corresponds to the vortex displacement with a pair of elongated vorticity fluctuation patches of opposite sign, undergoing counterclockwise deflection along the streamwise direction. Consistent with the previous studies of the tip vortex, delta-wing vortex or afterbody vortex (Ma et al. Reference Ma, Wang and Gursul2017; Chen et al. Reference Chen, Wang and Gursul2018; Gursul & Wang Reference Gursul and Wang2018), such modes have a very large wavelength due to the transient growth of the perturbations. The deformation mode makes an earlier appearance in mode 7 for the downstream domain (figure 17b), indicating its increased contribution to the fluctuation energy downstream. Vorticity fluctuation patches evolve downstream following a helical trajectory, as shown in figure 17(b). The energy distribution of POD modes indicates that the displacement mode leads to the most energetic perturbation growth of the tip vortex in the wetted flow.

Figure 17. Vorticity fluctuation component of POD modes for the wetted flow condition ( $\phi /u_{\infty } =1\times 10^{-3}$) in the downstream domain: (a) mode 1, and (b) mode 7. Cross-plane contours are superimposed at $x/c = 0.42, 0.76$.
7.1.2. Breathing mode cavitation
The first three POD modes of breathing mode cavitation in the upstream domain are shown in figure 18. The unsteady vortical structure undergoes periodic pulsations due to the volume variation of the cavity. As a result, the disturbance energy represented by the deformation modes (modes 1–3) significantly increases, revealing a close connection between the tip vortex instability and cavity oscillation. For mode 1 shown in figure 18(a), the vortical fluctuation pattern is constrained by the hydrofoil surface when  $x/c < 0.1$, leading to a displacement in the vertical direction (figure 18ai). However, the deformation pattern appears downstream ( $x/c > 0.1$) and becomes dominant (figure 18aii). The perturbation patterns of modes 2 and 3 resemble the quadrupole distribution, as shown in figure 18(b,c), indicating the importance of the vortex deformation. The pattern of mode 2 has a phase difference of $90^{\circ }$ compared with mode 1 (see figure 18bi,aii). Their linear combination allows for the vortex deformation in all azimuthal directions (Gentile et al. Reference Gentile, Schrijer, Van Oudheusden and Scarano2016).

Figure 18. Vorticity fluctuation component of POD modes for the breathing mode cavitation ( $\phi /u_{\infty } =2\times 10^{-3}$) in the upstream domain: (a) mode 1, (b) mode 2 and (c) mode 3. Cross-planes are selected at $x/c = 0.08, 0.24$ for mode 1 and $x/c = 0.2$ for modes 2 and 3.
In the downstream domain, the first mode with the highest energy still represents vortex elliptical deformation induced by radial volume variations of the cavity, shown in figure 19(a), similar to that in the upstream domain. The pattern reveals vortex deformation and rotation that coincide with cavity diameter change obtained by the high-speed camera (figure 2b). The patches extend over the entire measure domain, which is much larger compared with that of the wetted flow condition (see mode 7, figure 17b). Different from the upstream domain, the displacement mode of the vortex first appears in mode 3 (see figure 19b), indicating that the bending or wandering motion of the tip vortex intensifies downstream even in the cavitating flow. The vorticity fluctuation patches show very little rotation compared with similar modes for wetted flow conditions in figure 17(a).

Figure 19. Vorticity fluctuation component of POD modes for the breathing mode cavitation ( $\phi /u_{\infty } =1\times 10^{-3}$) in the downstream domain: (a) mode 1 and (b) mode 3. Cross-plane contours are superimposed at $x/c = 0.48, 0.78$.
For the breathing mode condition, the POD modes of high fluctuation energy mainly represent the vortex deformation, indicating its dominant role in the growth of vortex instability.
7.2. Power spectral density of POD modes
In order to analyse the spectral content of the POD modes, the power spectral density of the time coefficient matrix of the selected modes is performed, shedding light on the dominant vortex perturbation frequency and the correspondence with the cavity unsteadiness, as shown in figure 20. For the wetted flow (solid black line) and double-helical cavitation (dash black line) conditions, no dominant peak was found for displacement and deformation modes, indicating the absence of periodic motion. The overall spectra indicate a broadband pattern.

Figure 20. The power spectral density (PSD) functions of the most energetic modes for the three flow conditions.
For breathing mode cavitation, distinct peak frequencies are observed for the deformation mode 1 in both upstream (red line) and downstream (dash blue line) domains. The periodic deformation yields a frequency of 220 and 237 Hz, respectively, similar to that of the periodic cavity volume variation obtained by the high-speed videos in figure 2(b). In order to investigate the mechanism of the breathing mode cavitation, the natural oscillation frequency of a cylindrical bubble (Choi et al. Reference Choi, Hsiao, Chahine and Ceccio2009) is calculated by
 \begin{equation} f=\frac{\varGamma }{4{\rm \pi}^{2}r_{c}^{2}\sqrt{\ln(r_{D}/r_{c})}}, \end{equation}
where  $\varGamma$ represents the circulation and equals 0.03 m $^{2}$ s $^{-1}$, $r_{c}=1.25$ mm is the mean cavity radius and $r_{D}$ represents the half-width of the test section. The natural frequency is 236 Hz, reaching a good agreement with that of the POD modes and cavity diameter fluctuations. The results reveal that the vortex instability and cavity volume variation are related to the excitement of the cavity resonance (Peng et al. Reference Peng, Wang, Li, Xu and Song2017a).
7.3. Instability mechanisms of cavitating tip vortex
The unsteady flow structures around the tip vortex are introduced by wave motion, the interaction with the separated wake and the cavity surface instability. Under cavitating conditions, the surface fluctuations of the tip vortex are significantly intensified due to the shape and volume variation of the cavity and stronger interaction with the unsteady vortex shedding, producing hairpin vortex structures and notable streamwise vortex undulation. The unsteady vortical structure and related instability mode are greatly affected by cavitation.
From the POD analysis, the patterns of unstable vortex perturbations reveal displacement and deformation modes. For the wetted flow, the displacement mode dominates the growth of vorticity fluctuations, similar to the wing-tip vortex of the airfoil (Del Pino et al. Reference Del Pino, Lopez-Alonso, Parras and Fernandez-Feria2011). The former mode is attributed to the self-induced Biot–Savart effect or external shear stress of the boundary layer and the vortex system, leading to the bending and wandering motion of the vortex with directivity (Garmann & Visbal Reference Garmann and Visbal2017a).
For the breathing mode, the periodic volume variation of the cavity induces strong azimuthal instability, which promotes the growth of the deformation mode. The disturbance energy magnitude of the former mode intensifies beyond the level of the displacement mode. The peak frequency and wavelength of the deformation mode are consistent with the diameter fluctuations of the cavity and the natural oscillation mode of the cylindrical bubble, revealing a direct correlation between cavitation and vortex instability. The change of dominant POD mode suggests that the instability of the tip vortex is significantly affected by cavity volume variation, which can be explained by the oscillation of the cylindrical bubble near the equilibrium radius.
8. Conclusion
The dynamics of the tip vortex produced by an elliptic hydrofoil is investigated under cavitating conditions. The breathing and double-helical cavitation modes were especially considered, addressing the influence of cavitation on the unsteady flow features and associated vortex instability mechanisms. Tomographic PIV was applied to capture the three-dimensional flow structures, covering a wide spatial range starting from the emergence of the tip vortex until the decay process.
The time-averaged flow field features a system of streamwise vortices, including the tip and secondary structures. The breathing and double-helical cavitation modify the shape of the tip vortex, from the axisymmetric circular cylinder into an elliptic cylinder and helix, respectively. The decrease of cavitation number results in the reduction of tip vortex strength, followed by a faster decay process. For the double-helical condition with the lowest cavitation number, the axial velocity at the tip vortex shifts from a jet-like to wake-like distribution, which is associated with the growth of vortex instability.
In the instantaneous flow organization, the cavitation modes introduce strong wave motion over the tip vortex, undergoing intensified interaction with boundary layer separation. The tip vortex exhibits more prominent streamwise undulation and deformation. The induced Kelvin wave over the cavity surface contributes significantly to the growth of shear layer instability over the tip vortex, leading to the newly generated hairpin vortex structures compared with the wetted flow condition.
The effect of cavitation on the tip vortex instability is investigated by POD analysis, shedding light on the relation between the cavitation mode type and the unstable vortex mode. Two major types of unstable vortex modes are obtained. The displacement mode leads to vortex centreline movement and the deformation mode anticipates the vortex shape change. The selection of the dominant unstable eigenmode depends on the cavity oscillation. For the wetted flow, the displacement mode dominates the growth of vorticity fluctuations, which is related to the vortex wandering phenomenon. For the breathing mode cavitation, the disturbance energy of the deformation mode increases significantly, exhibiting a larger magnitude than the displacement mode, revealing the predominant role in the vortex perturbation growth. The peak frequency of the deformation mode and the cavity resonance frequency are in good agreement, confirming that the possible excitement of cavity resonance has a significant impact on the dominant vortex instability.
Supplementary movies
Supplementary movies are available at https://doi.org/10.1017/jfm.2023.465.
Funding
This work was supported by National Key R&D Program of China (grant no. 2020YFA0405700), National Natural Science Foundation of China (grant no. 12002305), Key Laboratory of Aerodynamic Noise Control (ANCL20200103).
Declaration of interests
The authors report no conflict of interest.


