


Policy Significance Statement
This paper illustrates a collection of AI solutions that can empower data scientists and policymakers to use AI/ML for the development of explainable and transparent policies in line with the emerging European regulation for AI. It discusses the challenges of AI-based policymaking, along with solutions that alleviate these challenges. The introduced solutions have been validated in the development of various data-driven, evidence-based policies for local governments.
1. Introduction
1.1. Artificial intelligence for public policymaking: the rationale
In recent years, artificial intelligence (AI) is disrupting entire economic sectors such energy, transport, industry, healthcare, smart cities, and public administration. This disruptive power of AI stems from its potential to improve the automation, efficiency, and speed of business processes in these sectors. The latter improvements are propelled by advances in parallel hardware (e.g., Jouppi et al., Reference Jouppi, Young, Patil, Patterson, Agrawal, Bajwa, Bates, Bhatia, Boden, Borchers, Boyle, Cantin, Chao, Clark, Coriell, Daley, Dau, Dean, Gelb, Ghaemmaghami, Gottipati, Gulland, Hagmann, Ho, Hogberg, Hu, Hundt, Hurt, Ibarz, Jaffey, Jaworski, Kaplan, Khaitan, Killebrew, Koch, Kumar, Lacy, Laudon, Law, Le, Leary, Liu, Lucke, Lundin, MacKean, Maggiore, Mahony, Miller, Nagarajan, Narayanaswami, Ni, Nix, Norrie, Omernick, Penukonda, Phelps, Ross, Ross, Salek, Samadiani, Severn, Sizikov, Snelham, Souter, Steinberg, Swing, Tan, Thorson, Tian, Toma, Tuttle, Vasudevan, Walter, Wang, Wilcox and Yoon2017) and scalable software systems (e.g., Gonzalez et al., Reference Gonzalez, Low, Gu, Bickson and Guestrin2012), which have in turn enabled the development of advanced machine learning (ML) frameworks (e.g., Dean et al., Reference Dean, Corrado, Monga, Chen, Devin, Mao, Ranzato, Senior, Tucker, Yang, Le and Ng2012) and novel optimization algorithms (e.g., Kingma and Ba, Reference Kingma and Ba2014) suitable for large-scale problems. These technical advances enable organizations to process and analyze vast amounts of data in timely and cost-effective ways (Leyer and Schneider, Reference Leyer and Schneider2021). They also facilitate organizations to use data analytics outcomes to improve, optimize, and accelerate their decision-making processes.
In most cases, the AI-based processing and analysis of large datasets is based on ML models and algorithms. The latter facilitate digital systems to learn without human instruction (e.g., rules) but based on historical information and statistical knowledge. ML is extremely popular in use cases that involve the processing and analysis of vast amounts of information. This is the case for modern policymaking processes, given that policymakers are nowadays provided with more policy-related datasets than ever. In recent years, data volumes increase at an unprecedented rate (Chauhan and Sood, Reference Chauhan and Sood2021), which challenges policymakers and public administration workers. Specifically, as part of their decision-making processes, policymakers must collect, read, study, analyze, and process vast amounts of data. ML systems can automate the processing of large volumes of data toward extracting policymaking insights. Thus, they can help policymakers to benefit from the growing data volumes of policymaking data, without worrying about data scalability challenges. Furthermore, ML ensures that policymakers consider all relevant information via correlation and cross-analysis of multiple datasets. Therefore, there are also cases when ML models and technologies enable novel capabilities based on the identification of potentially hidden patterns and correlations of policy-related datasets. For instance, ML algorithms can detect non-obvious associations between different policymaking parameters such as citizens’ behavioral patterns after specific events or during specific time windows, beyond what is already known or observed by policymakers. The identification of such patterns can enable policy optimizations that are hardly possible based on legacy information processing methods.
Overall, ML can improve the way public policies are developed, which is the reason why this paper presents challenges and methods for ML-based policy development. ML technologies enable new methods for understanding and analyzing data, which can lead policymakers to better decisions (Edwards and Veale, Reference Edwards and Veale2018). Moreover, ML models come to provide a layer of human ingenuity, which is currently missing from existing policymaking models (Deng et al., Reference Deng, Ji, Rainey, Zhang and Lu2020). Therefore, the use of ML as a public policymaking tool is increasingly considered in the strategic agendas of public policy organizations such as central, regional, and local governments (e.g., Lindgren et al., Reference Lindgren, Madsen, Hofmann and Melin2019; Rosemann et al., Reference Rosemann, Becker and Chasin2020).
1.2. The challenges of ML-based policy development
There is a clear rationale behind using ML models and tools in policymaking scenarios. However, the use of ML in practical policymaking scenarios entails the following challenges:
-
• Algorithmic bias: One of the most prominent problems with the development ML applications is the development of biased algorithms (Hao, Reference Hao2019; Suresh and Guttag, Reference Suresh and Guttag2021). Therefore, policymakers must ensure that their policymaking algorithms are unbiased and lead to representative policies rather than producing policies that favor specific citizen groups and exclude others. However, the development of unbiased systems is very challenging due to the lack of representative policymaking datasets. For instance, digital data collected in social media are not typically representative of the preferences and needs of citizen groups that do not use social media platforms (e.g., elderly or low-income citizens). Hence, training ML algorithms for policy decision-making using such biased data is likely to result in policy decisions that do not account for the needs of such citizen groups. It is also noteworthy that algorithmic bias is often introduced in unintended ways (Suresh and Guttag, Reference Suresh and Guttag2019), which asks for bias detection and mitigation processes. As a prominent example, the training of ML-based decision-making systems based on historical datasets that comprise bias is one of the common ways for injecting human biases within ML-based policy models. Unless there are some bias detection systems in place, such biased systems can be deployed in production and lead to biased policies.
-
• Explainability and transparency: Public policymakers must be able to understand how their data-driven decisions work, while at the same time explaining the rationale behind these decisions to citizens. Moreover, policymaking processes must be transparent and trustworthy to be accepted by citizens. Unfortunately, the many high-performance ML models (e.g., models based on deep neural networks) operate as black boxes and offer very limited transparency and explainability (Soldatos and Kyriazis, Reference Soldatos and Kyriazis2021). This makes their use in pragmatic policymaking settings very difficult. To remedy this situation, the research community is working on explainable AI (XAI) techniques, which aim at building AI systems that are transparent (i.e., “glass box” models) and at explaining how black box algorithms work. XAI techniques can be used to explain to policymakers why an AI system recommends a specific policy decision. This is particularly important for the practical deployment of AI systems in policy development settings as policymakers won’t use AI systems that cannot understand how they work. XAI is also a key prerequisite for the transparency of ML-based policy decisions, as these decisions cannot be transparent unless stakeholders understand how AI systems recommend specific decisions. Nevertheless, the use of XAI in public policymaking settings is still in its infancy. Even the very concept of what constitutes a good explanation is still under debate currently. Recent works on explainable ML methods for policy development (Amarasinghe et al., Reference Amarasinghe, Rodolfa, Lamba and Ghani2023) underline the importance of contextualizing ML explanations and highlight the limitations of existing XAI techniques. Furthermore, they highlight the importance of stakeholder’s engagement and the need to prioritize policymakers’ requirements rather than relying on technology experts to produce explanations for ML-based policies (Bell et al., Reference Bell, Nov and Stoyanovich2023). Moreover, there are no agreed and proven ways for selecting models that balance performance and explainability in line with the requirements of policymakers.
-
• Regulatory compliance: ML-based systems for public policymaking must comply with emerging regulations in AI, such as the AI Act of the European Parliament and Council of Europe (European Commission, 2021). The AI Act is globally one of the first structured and systematic efforts to regulate AI systems. It defines stringent requirements for high-risk AI systems that are used to drive crucial decisions, like most public policymaking decisions. These requirements include guarantees for transparency, explainability, data quality, and human oversight. Emerging AI technologies like XAI can help meet these requirements. Nevertheless, there is no systematic approach for mapping technology tools into concrete requirements for the AI Act.
1.3. Related work
Despite increased interest in the use of AI for data-driven, evidence-based policymaking (Gesk and Leyer, Reference Gesk and Leyer2022), the development of practical systems that can be operationalized is in early stages. Some research works can be found in the broader context of data-driven policymaking that leverages Big Data (Hochtl et al., Reference Hochtl, Parycek and Schollhammer2016). Some systems for data-driven policies take advantage of social media information (Bertot et al., Reference Bertot, Jaeger and Hansen2011) based on different techniques, including data mining and ML algorithms (Charalabidis et al., Reference Charalabidis, Maragoudakis, Loukis, Tambouris, Panagiotopoulos, Sæbø, Tarabanis, Wimmer, Milano and Pardo2015). There are also works on political analysis using statistical techniques, which is a foundation for ML (Monogan III, Reference Monogan2015). More recently, the use of ML has been proposed and explored for the analysis and mining of public policy-related information, as part of evidence-based policy approaches (Androutsopoulou and Charalabidis, Reference Androutsopoulou and Charalabidis2018). Specifically, ML techniques for public policy-related applications have been explored in areas like taxation (López et al., Reference López, Rodríguez and de Lucas Santos2019), public security and counterterrorism (Huamaní et al., Reference Huamaní, Mantari and Roman-Gonzalez2020), public work design (Eggers et al., Reference Eggers, Schatsky and Viechnicki2017), and healthcare (Qian and Medaglia, Reference Qian and Medaglia2019).
These systems have provided insights on the benefits and challenges of ML-based policymaking. Addressing bias and explainability challenges are crucial requirements for the practical deployment of AI systems by public policy development organizations. The development and use of bias detection toolkits (Bellamy et al., Reference Bellamy, Dey, Hind, Hoffman, Houde, Kannan, Lohia, Martino, Mehta, Mojsilovic, Nagar, Ramamurthy, Richards, Saha, Sattigeri, Singh, Varshney and Zhang2018) and XAI techniques (e.g., Ribeiro et al., Reference Ribeiro, Singh and Guestrin2016; Fryer et al., Reference Fryer, Strümke and Nguyen2021; Shrikumar et al., Reference Shrikumar, Greenside and Kundaje2017) are considered as a remedy to bias and explainability issues, respectively. However, these toolkits have not been extensively applied, used, and evaluated in public policymaking use cases. Likewise, in the light of the emerging AI Act, there is not much research on how explainability techniques could be matched to regulatory requirements in ways that balance performance and explainability. This is particularly important given also concerns about the overall trustworthiness of explanations over back box models (Rudin, Reference Rudin2019), which are usually criticized for their ability to ensure transparent, reliable, and trustworthy AI systems. The present paper introduces XAI solutions for evidence-based policy development. Moreover, it presents approaches for developing systems that are compliant to the AI Act.
1.4. Article structure and contribution
This paper is motivated by existing gaps in the explainability and transparency of ML-based public policy use cases, as well as by challenges associated with regulatory compliance. It introduces a data mining process, a reference architecture (RA), a cloud-based ML platform, and a framework for explainable ML algorithms for dealing with these issues in the context of policymaking. Specifically, we first introduce an RA and a data mining framework that could boost the development of robust and unbiased systems for public policymaking. The RΑ illustrates a set of modules and tools that are destined to support policymakers in adopting, using, and fully leveraging AI/ML techniques in their policymaking efforts. On top of the RA, a data mining process based on the popular CRISP-DM (Cross Industry Standard Process for Data Mining) methodology is adapted to support public policymaking activities. The process makes provisions for explorative data analysis to detect and remedy potential biases linked to the used datasets. Moreover, a virtualized cloud-based platform is presented, which enables the development of ML-based policymaking applications in line with the RA and the CRISP-DM process.
From an algorithmic viewpoint, the paper presents the adaption and application of background algorithms of the authors (Christou, Reference Christou2019; Christou et al., Reference Christou, Kefalakis, Zalonis and Soldatos2020; Christou et al., Reference Christou, Kefalakis, Soldatos and Despotopoulou2022) i.e., algorithms produced by the QARMA (Quantitative Associations Rule Mining) ML framework to public policymaking applications for smart cities. The introduced algorithms enable knowledge mining and representation in the form of explainable rules, which boosts the interpretability of the public policy knowledge. This alleviates the limitations of black box models (e.g., deep neural networks) for policymaking without any essential performance penalty. It also allows for a whole new class of explanations for black box models’ decisions. The QARMA ML framework forms the core of the XAI module of the presented platform, which enables it to produce explainable rules that are transparent and understandable to policymakers.
Another contribution of paper is the mapping of different algorithmic tools (including QARMA) to different AI-based policymaking use cases that feature different risk levels. Specifically, the paper suggests how different algorithms and techniques can boost the regulatory compliance of different classes of AI systems in line with the risk-based classification of the AI Act. This can serve as an early guide for data scientists and other developers of AI/ML systems for public policymaking, who wish to develop regulatory compliant systems by design. In the scope of the paper, the risk-driven approach of the AI Act is positioned in the wider landscape of enterprise risk management (ERM) frameworks and their use for assessing the risks of AI applications.
It should be noted that an earlier and reduced version of this paper has been presented in the scope of the “Data for Policy” conference, which was held in Brussels in December 2022. This earlier version has been published as an open access paper (Papadakis et al., Reference Papadakis, Christou, Ipektsidis, Soldatos and Amicone2022). The present version of the paper extends this earlier edition by introducing the virtual policy management environment (VPME), as well as by presenting additional validation use cases.
The paper is structured as follows:
-
• Section 2 following this introduction introduces the data mining process and the RA for public policymaking. It also illustrates how ML models can drive the evidence-based policymaking process, along with the virtualized cloud-based platform for developing AI-based policies.
-
• Section 3 presents our arsenal of ML algorithms and tools for public policymaking use cases. These algorithms are explainable and are used to empower the operation of the XAI module of the platform. It also discusses how these tools (including the XAI techniques) map to the requirements of the different risk levels of the AI Act, as well as how they could be used in conjunction with popular ERM frameworks.
-
• Section 4 illustrates the use of the introduced data mining process and XAI algorithms in real-life public policymaking use cases. The relative performance of the different algorithms is discussed, along with their suitability for the presented use cases.
-
• Section 5 is the final and concluding section of the paper.
2. RA and virtualized policy management environment for ML-based policies
To address existing gaps in the development of AI-based use cases for public policymaking, we herewith introduce a RA and a data mining framework for the development of robust and unbiased systems for public policymaking. The presented RA and the accompanying data mining process are integrated in a single platform, which is also presented in later paragraphs. This platform has been developed in the AI4PublicPolicy project, which is co-funded by the European Commission in the scope of its H2020 program for research and innovation. In AI4PublicPolicy, policymakers and AI experts collaborated closely towards unveiling AI’s potential for automated, transparent, and citizen-centric development of public policies. The RA of the AI4PublicPolicy platform is specified as a set of software modules and tools that aim at supporting policymakers in using and fully leveraging AI/ML techniques. At the same time, the data mining process specifies how the various tools of the AI can be used to support the development of end-to-end policy development solutions. In this direction, a cloud-based platform for developing such policies has been developed as well.
2.1. Platform RA and main components
The AI4PublicPolicy platform collects and analyzes data that are used for automated, transparent, and citizen-centric development of public policies. The architecture is inspired by the Big Data Value reference model (Curry et al., Reference Curry, Metzger, Berre, Monzón, Boggio-Marzet, Curry, Metzger, Zillner, Pazzaglia and García Robles2021). It is characterized as a RA since it is presented at a high-level, abstract, logical form, which provides a blueprint for the implementation of AI-based public policies.
The architecture specifies modules and functionalities for:
-
• Data analytics, i.e., the implementation of techniques for understanding and extracting knowledge from data. AI4PublicPolicy specifies and implements AI tools for policy modeling, extraction, simulation, and recommendations. The AI tools include ML to extract policy-related knowledge from large datasets, including opinion mining and sentiment analysis functionalities.
-
• Data protection, i.e., the implementation of technological building blocks for safeguarding sensitive data, such as data anonymization mechanisms.
-
• Data processing architectures, i.e., architectural concepts for handling both data-at-rest (e.g., data stored in databases of the policy authorities) and data-in-motion (e.g., data concerning interactions between citizens, the administration, and the e-services of the administration). The architecture enables the handling of streaming data from sentiment analysis and opinion mining technologies that enable the capture of citizens’ opinions on social media.
-
• Data management, i.e., techniques for dealing with large amounts of data, including management of both structured (e.g., data in tables) and unstructured data (e.g., citizens’ opinions in natural language). The employed data management techniques make provisions for handling multilingual data using natural language processing (NLP) tools, and tools for semantic interoperability of policy data sources.
-
• Cloud and high-performance computing building blocks that enable the integration of the platform with the portal of the European Open Science Cloud (EOSC) to facilitate access to cloud and high-performance computing resources. EOSC is a federated system based on a set of existing research infrastructures that delivers a catalog of services, software, and data from major research infrastructure providers. The integration of the AI4PublicPolicy platform with the EOSC portal is destined to deliver a complete environment for AI-based policymaking. This environment enables the sharing of datasets and models for data-driven policies, as part of a cloud-based VPME.
Moreover, the AI4PublicPolicy platform provides cyber-defense strategies against prominent attacks against AI systems (e.g., poisoning attacks of data) to increase the security of the AI systems in line with regulatory mandates (e.g., the AI Act) for systems that take critical decisions. Finally, the platform incorporates XAI models that make ML-based policies explainable to humans to enhance transparency and the overall acceptability of policies by citizens and policymakers.
Our blueprint architecture for implementing and deploying AI-based policy development is illustrated in Figure 1. The figure illustrates a logical view of the architecture, including the main components of the cloud-based AI platform and the interactions between them. Specifically, the components of the architecture blueprint include:
-
• Dataset collection and management: Provides the software tools that collect and manage datasets. Datasets are collected through proper application programming interfaces (APIs).
-
• Semantic interoperability: Provides the interoperability functionalities that enable the mapping between the different data formats available, in line with an agreed set of formats.
-
• Cross-country interoperability: Translates data from one language to another target language in order to share data and policies and to boost such sharing.
-
• Datasets and policies catalog: This component is a directory of policies and datasets, which facilitates the dynamic discovery of data and policies toward facilitating reuse.
-
• XAI techniques: This module is responsible for providing information for analyzing and explaining the ML models to help humans understand the rationale behind policy decisions.
-
• Policy explainability and interpretation: This component is used to build the policy models which will produce the analysis and interpretation of the policy datasets.
-
• AI security: Incorporates AI-related cyber-defense strategies in order to protect AI systems against attacks (notably data poisoning and evasion attacks).
-
• AutoML: This component facilitates the selection of the optimal algorithms for a specific AI process chain. To this end, it maintains a set of well-established algorithms, which are used to drive the selection of the optimal ones.
-
• Text and sentiment analysis: This component provides information about the sentiment of citizens, notably sentiment related to policy decisions. From an implementation perspective, it is based on NLP and text analytics algorithms.
-
• Policy extraction: Enables the policymaker to choose an AI workflow from a catalog of ML and deep learning (DL) workflows and apply it. The workflows are available in an open analytical environment (e.g., Project JupyterFootnote 1) that enables the development and deployment of ML applications.
-
• Policy evaluation and optimization: Allows the simulation and evaluation of policies by making use of the opinions and feedback of local actors to propose new insights and improvements.
-
• VPME is a cloud-based platform that integrates the different components of the platform based on proper APIs.

Figure 1. AI4PublicPolicy architecture components.
2.2. Policy extraction methodology
On top of the RA that serves as blueprint for integrating and deploying AI-based policies, a data mining process must be realized to support policy extraction. The methodology leverages data collection and management building blocks of the platform to assemble proper policymaking datasets, along with AI/ML techniques for extracting and explaining the policies. In this direction, the Cross-Industry Standard Process for Data Mining (CRISP-DM) process (Marban et al. Reference Marban, Mariscal, Segovia, Ponce and Karahoca2009) has been properly adapted. Specifically, the six phasesFootnote 2 of CRISP-DM are used to support the policy development process as follows (Figure 2).
-
1. Business understanding: This step is focused on the specification of the policy extraction problem and its framing in the correct policy context.
-
2. Data understanding: This step focuses on exploring the availability of proper datasets for the policy extraction problem at hand, including the availability of data with proper volumes and a representative nature that helps alleviate bias.
-
3. Data preparation: This step is identical to the corresponding dataset of CRISP-DM. It comprises a set of repetitive data preparation tasks to construct the final dataset from the initial raw data.
-
4. Modeling: This step deals with the selection and application of the various modeling techniques followed by calibration of their parameters. In conjunction with the AI4PP architecture, it is facilitated by the catalog of algorithms and the AutoML components.
-
5. Evaluation: This step evaluates the selected models against their policy development goals.
-
6. Deployment: Once a set of appropriate policies have been extracted, validated, and evaluated, this step deals with the actual deployment of the ML functionalities that will help extract policies and visualize them to policymakers.
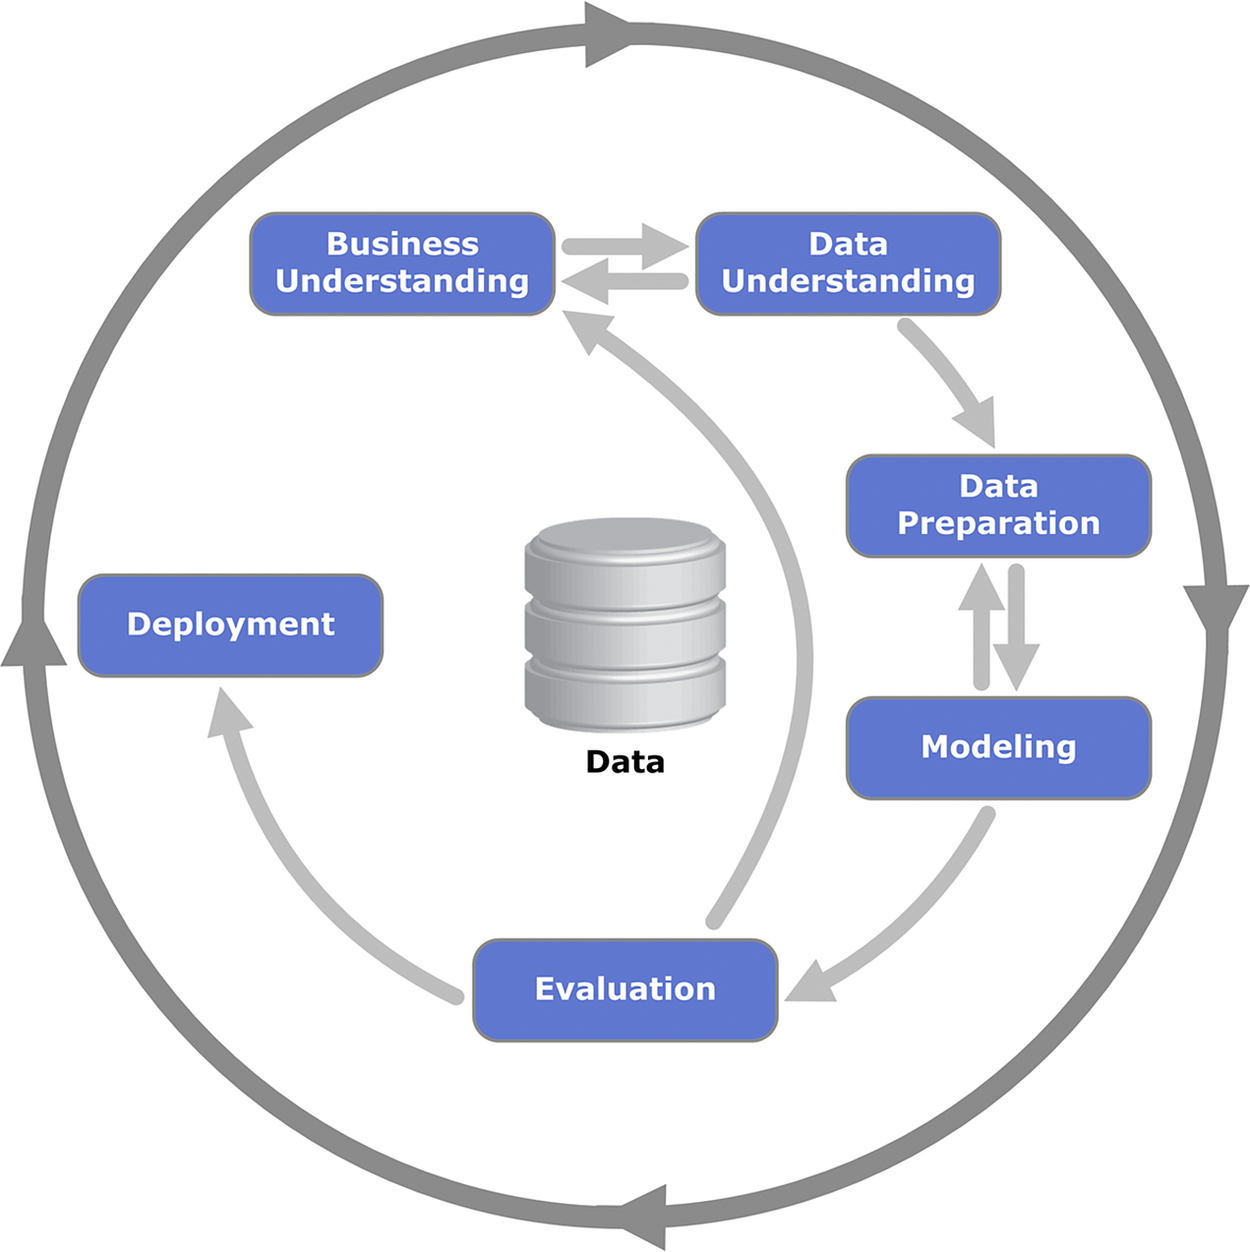
Figure 2. CRISP-DM phases and key outputs Footnote 3 (Creator: Kenneth Jensen Footnote 4 ).
In the context of the presented RA, the CRISP-DM methodology is used to provide a data-driven, AI-based, and evidence-based approach to extracting policies. It also specifies the phases of collaboration between policymakers, data scientists, and AI experts. The latter are the stakeholders that participate in the realization of the various phases of the adapted CRISP-DM process.
2.3. ML-enabled policymaking process
Using the AI4PublicPolicy platform and the CRISP-DM process, policymakers (e.g., governmental officials) can benefit from a novel data-driven policymaking process, which is illustrated in Figure 3. The process involves the development of ML models based on data from a variety of sources including citizen feedback. These ML models are enhanced with domain-specific metadata to enable the production of policy models. The latter reflect real-world decisions that can be optimized based on the parameters of the ML model. In this direction, there is a need for collaborative interactions between the policymaker and the data scientist. This collaboration aims at translating the low-level semantics of ML models (i.e., the parameters, hyperparameters, and attributes of an ML model) to high-level semantics of policy models (e.g., semantics associated with policy decisions).

Figure 3. Policymaking process using the AI4PublicPolicy platform.
Key to the implementation of the policymaking process of Figure 3 is the XAI modules and capabilities of the platform. These capabilities provide insights on why and how an ML model suggests a particular policy decision. Specifically, they provide insights on what patterns have been learnt by the model, how they interact with each other, and what are the main parameters that drive the suggested decisions. Hence, they are a key to explaining how the ML model and its associated policy model operates. In many cases, the XAI modules of the platform provide a human-readable explanation of the model, which facilitates policymakers to understand and use it. As a prominent example, the QARMA family of explainable ML algorithms that are used for the validating use cases in Section 4 expresses policy models in the form of easy-to-understand rules.
2.4. The VPME for ML-based policies
The VPME is an integrated cloud-based platform for managing datasets and policies. It is developed in line with the presented RA and supports the CRISP-DM policy development process. Figure 4 illustrates the home page of the platform, which offers the functionalities for datasets and policies management, including uploading of datasets, extraction of policies based on ML-models, and validation of policies based on citizens’ feedback. These functionalities match some of the building blocks of the presented RA.

Figure 4. Home page of the VPME—main entities.
2.4.1. Datasets and policy management
The dataset and policy management functionality of the platform enables data scientists and policymakers to specify and upload datasets from different sources to the platform. Using these datasets, it is possible to define different policies. Specifically, datasets are used to train different AI models and implement policies. It persists datasets and policies within a cloud database. Moreover, it offers APIs that enable the development of policies. A web-based interface is provided to enable non-technical users to define dataset schemas and policies, to upload datasets in the platform, and to visualize policies and datasets.
2.4.2. Policy definition and management
The platform offers policy definition functionalities based on a proper form-based interface (Figure 5). A policy is defined in terms of the name and a description of the policy, the owner of the policy, and the purpose of the policy. It also allows end users to associate datasets to policies. Moreover, users can indicate key performance indicators (KPIs) for the policy. Following the definition of a policy, end users can also change some of its properties. Policies can be listed and filtered according to their sector such as energy and transport policies.
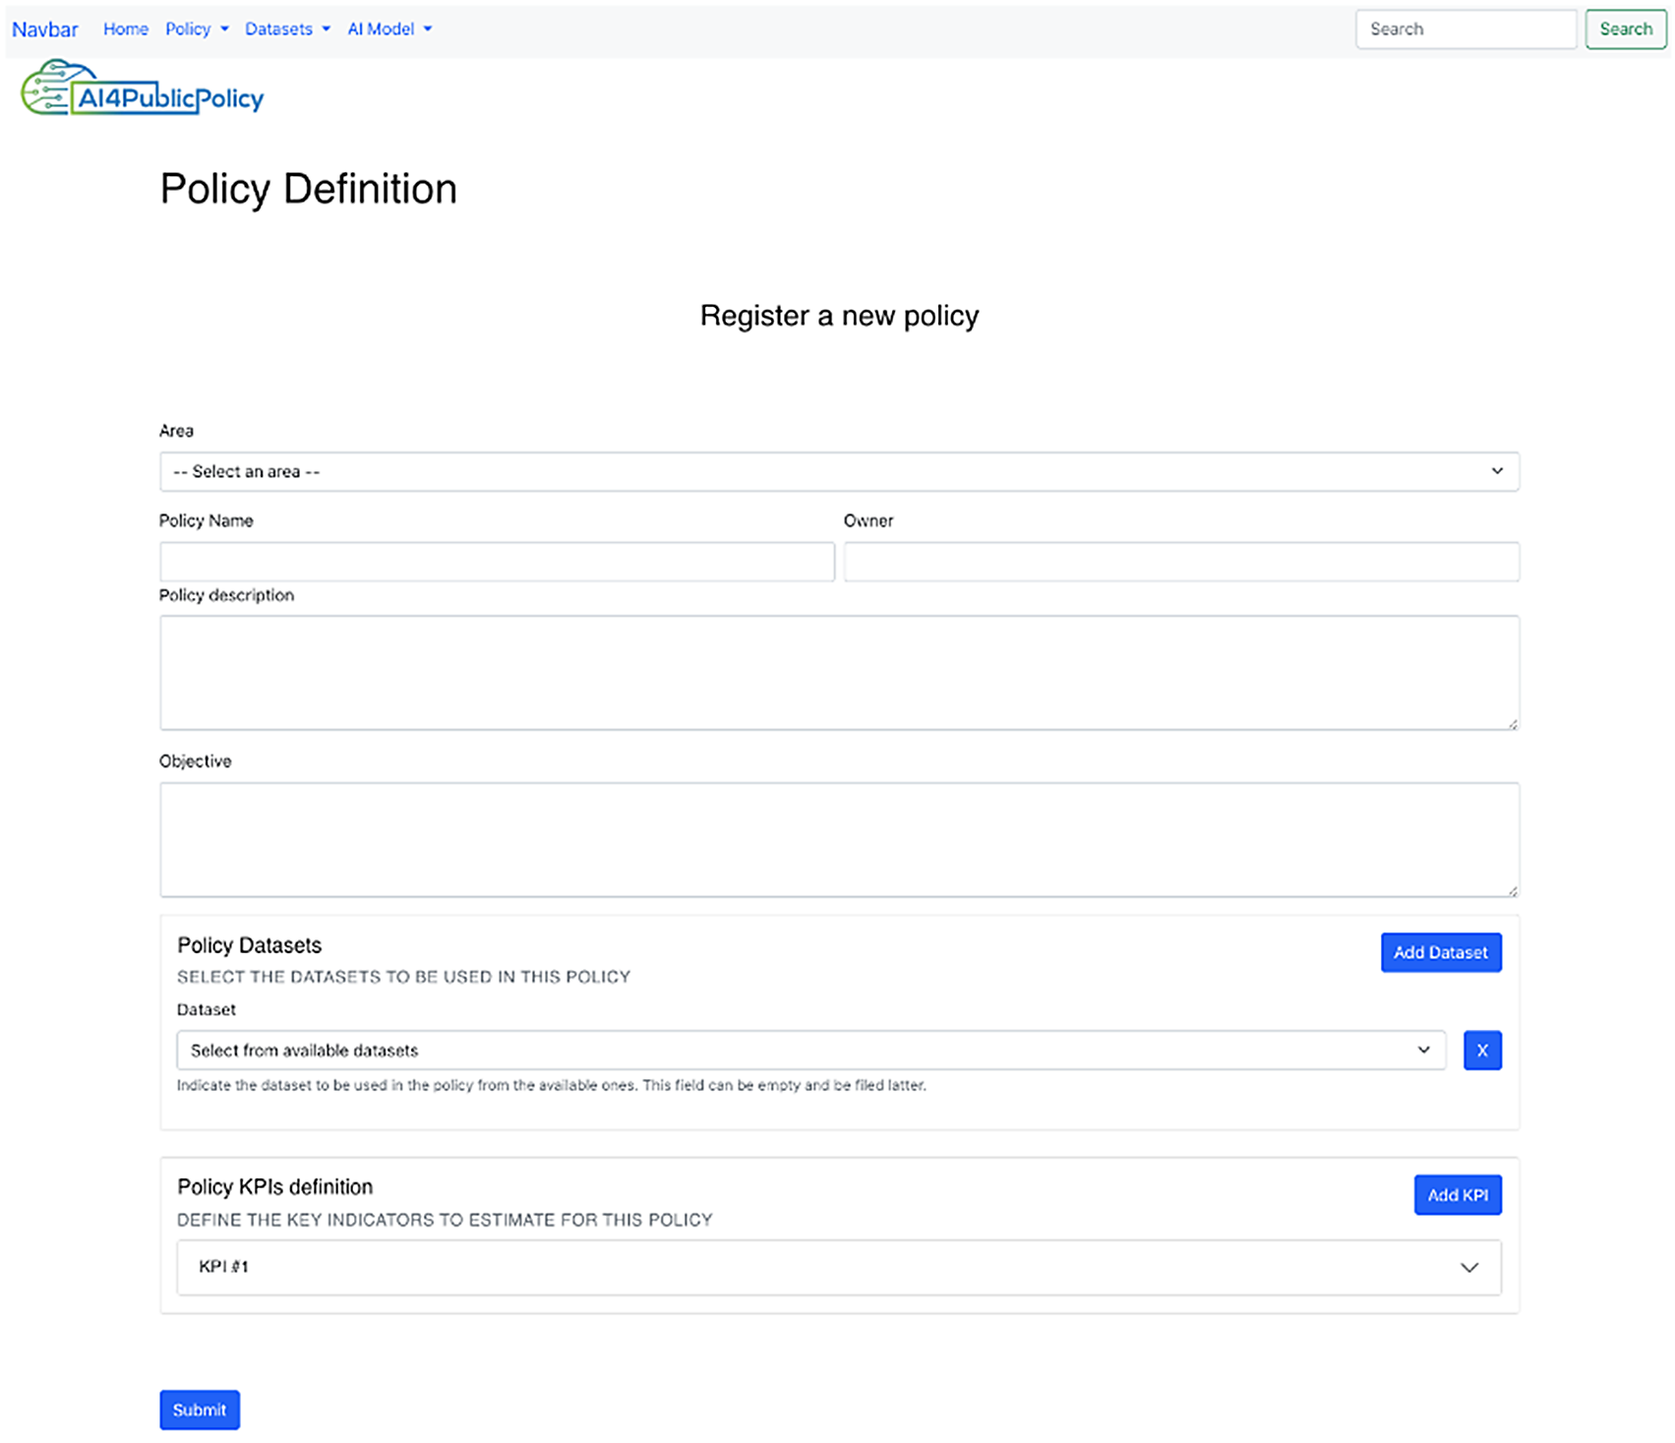
Figure 5. Policy definition user interface (UI).
2.4.3. Cross-country interoperability and policy sharing
The cross-country interoperability and policy sharing functionalities of the VPME enables the translation of policies and datasets from one language to another (Figure 6). It is destined to facilitate the reuse of different policies and datasets in countries with different languages. Once a translation is made, the information is stored internally to facilitate its repurposing and reuse.
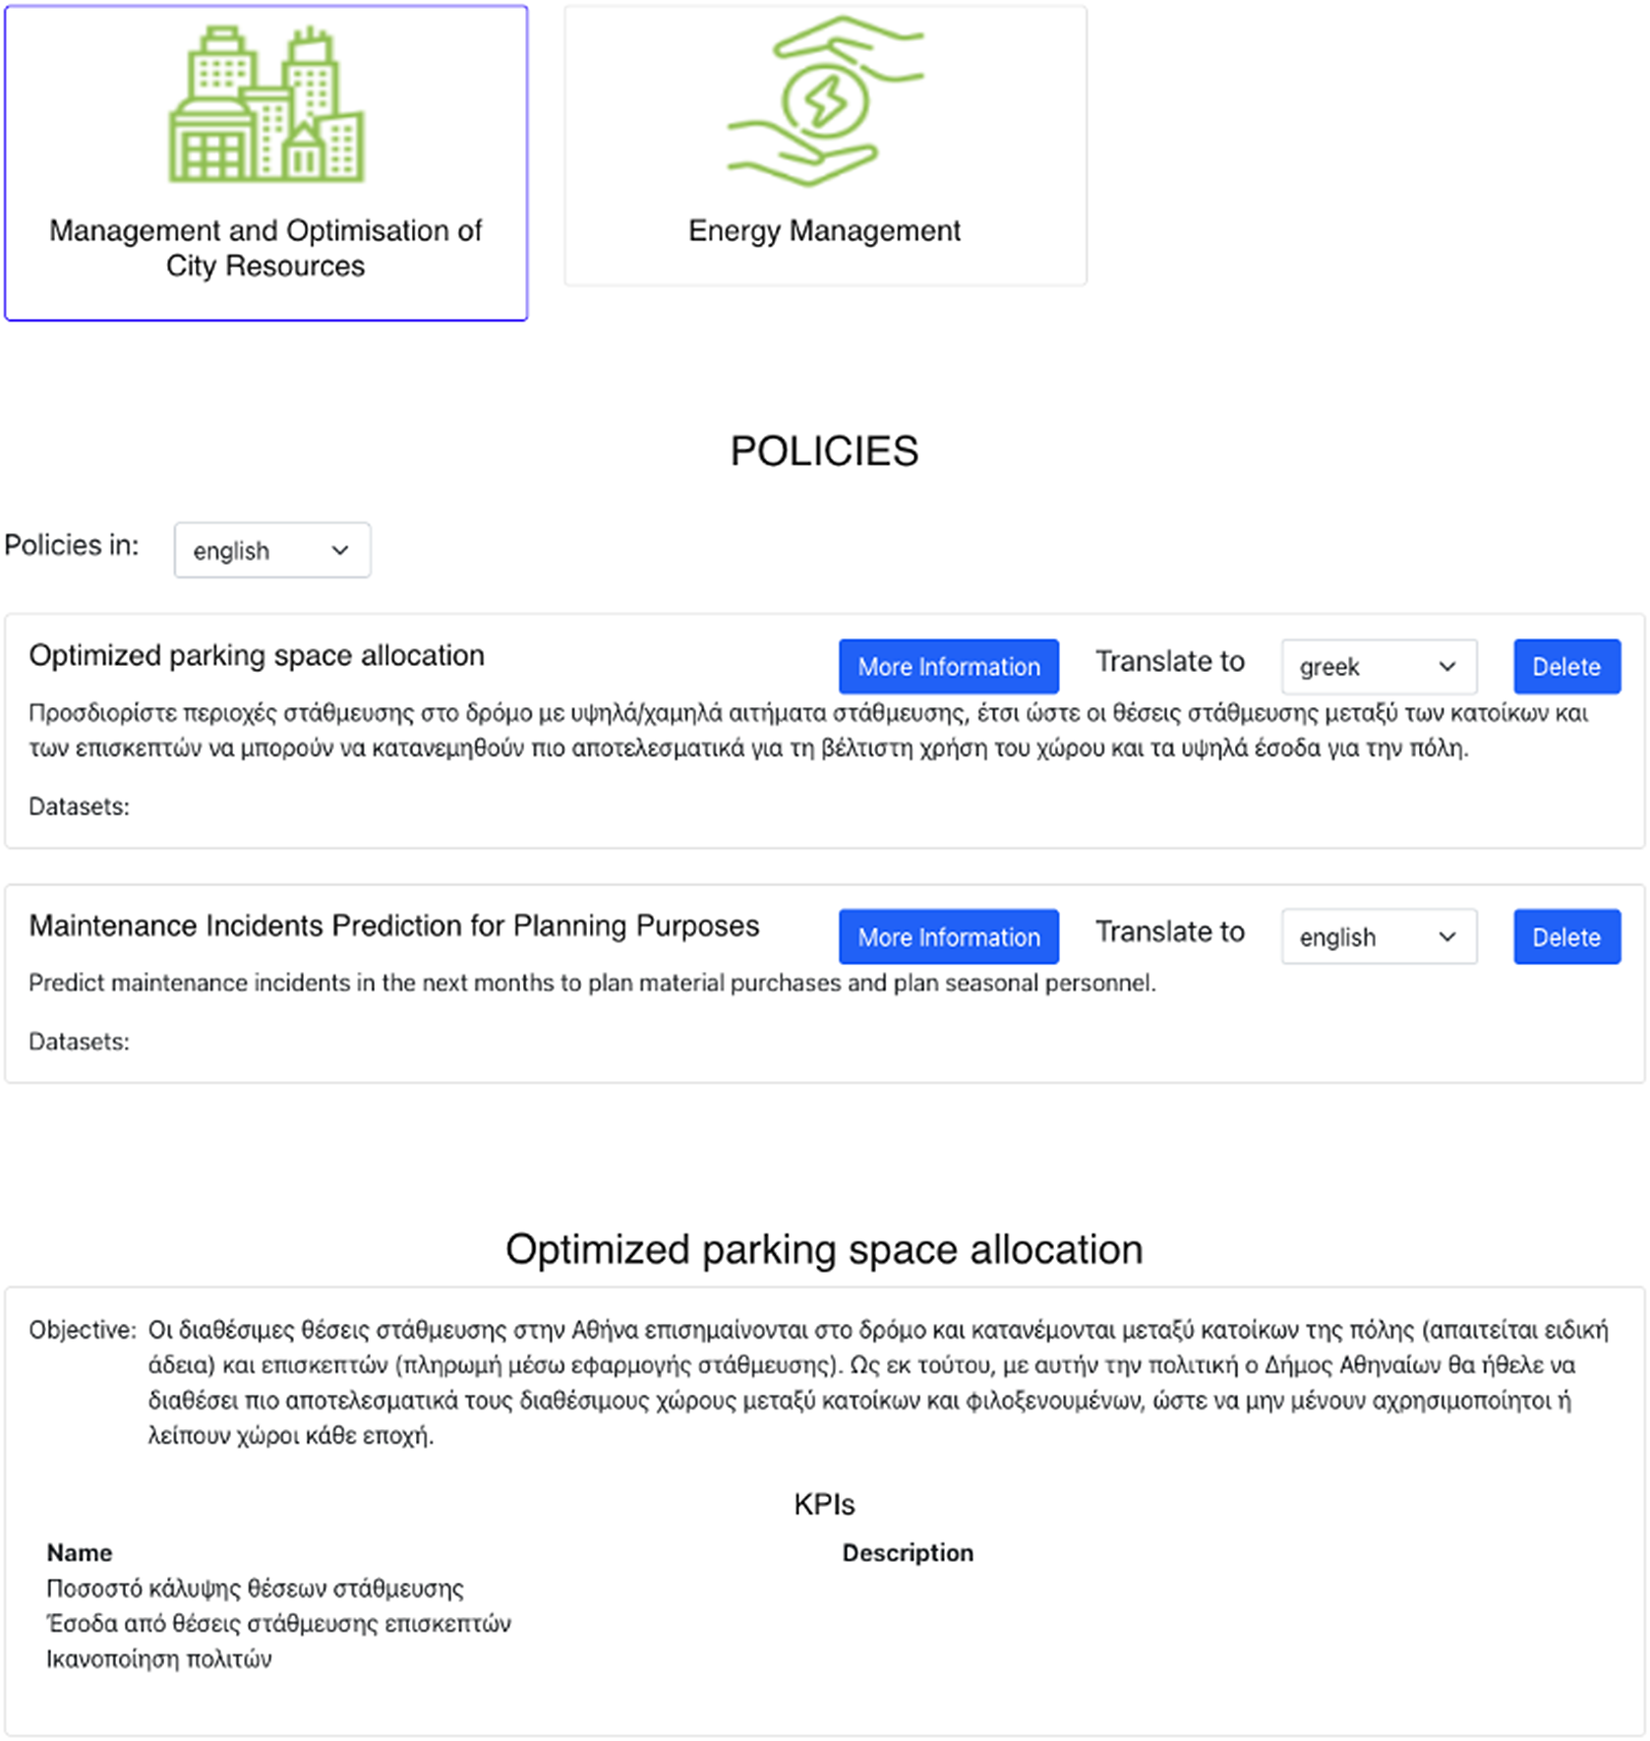
Figure 6. Policies translation user interface.
2.4.4. Policy extraction toolkit
The VPME integrates a policy extraction toolkit, which enables the extraction of data-driven policies based on available ML algorithms. The latter are to estimate and recommend the parameters of the policy models based on the available policy datasets. In this direction, a web interface for the policy extraction is provided, which offers two main views, a view for AI experts and a view for policymakers. The “AI expert” view empowers AI experts to select a project and work on it (Figure 7). Likewise, the policymaker view enables policymakers to test AI models for a specific policy KPI.

Figure 7. AI expert view in the policy extraction toolkit: projects for policy extraction.
2.4.5. Policy evaluation toolkit
The VPME offers a policy evaluation toolkit, which enables the simulation and evaluation of the developed AI policies. In particular, it integrates different types of surveys based on different electronic channels. The surveys are linked to action strategies that can be implemented at different stages of an ML pipeline. A policymaker view and a stakeholder view are provided. Through their view, policymakers manage and create custom surveys, including application surveys and surveys in social media platforms such as Twitter (Figure 8). Moreover, policymakers can view the results of the surveys using an appropriate dashboard. Stakeholders (e.g., citizens) can participate to the surveys in order to provide their evaluation feedback about the policies.
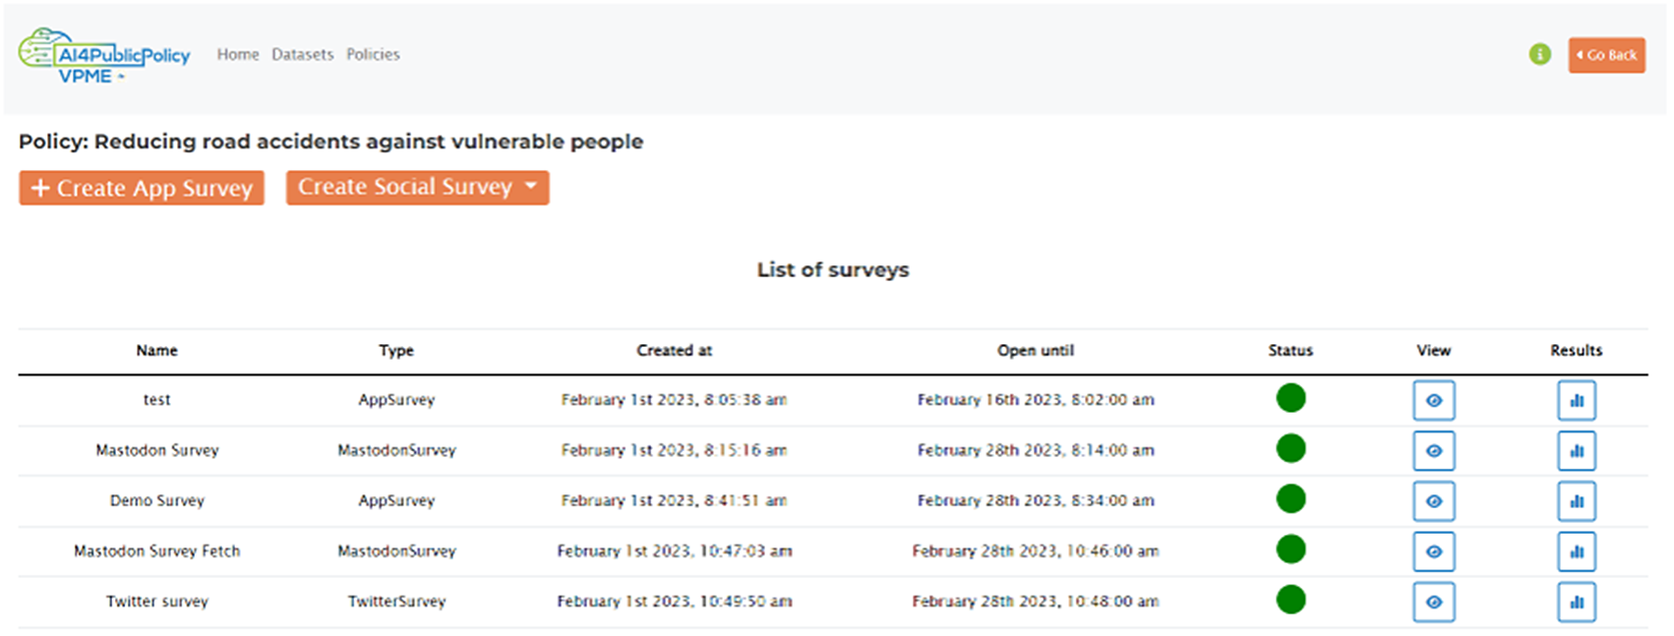
Figure 8. List of surveys in the VPME.
3. ML for public policymaking: From black box to explainable models
AI-based policy development relies on ML models that extract policy-related insights from available datasets. To this end, different types of ML models can be used, each one with its own pros and cons. The AI4PublicPolicy platform leverages XAI techniques for extracting policy insights that are transparent and understandable by policymakers. Specifically, the project’s XAI techniques can be used to explain how black box ML models operate. This enables the platform to integrate black box ML models within its ML module, while at the same time explaining them via XAI techniques that are integrated into the XAI module of the platform (Figure 3).
3.1. Black box models
ML algorithms can be broken down into two major categories: (i) traditional ML models, which are mostly based on classical statistical algorithms, and (ii) DL, which comprises models based on artificial neural networks (ANNs) with many layers of “perceptrons” that are inspired from models of brain neuron cell operation. ML algorithms can be further divided into supervised, unsupervised, and reinforcement learning (Bonaccorso, Reference Bonaccorso2017). Supervised learning algorithms are the most used in policy development problems. They are used as training data examples of input vectors along with their corresponding target variables. Their aim is to predict some target variables. When the training data examples consist of input vectors without corresponding targets, the problem is an unsupervised one. The aim in such a problem is to match the input data to similar groups (i.e., clustering problem) or to determine the distribution that generates the input data.
ANNs is the subfield of ML which consists of algorithms inspired by the structure and the function of the neuronal networks of the human brain. As already outlined, prominent examples of ANNs are the DL models, i.e., multi-layer perceptrons, which are very popular due to their scaling ability. Specifically, their performance, measured as any measure of accuracy in unseen test data, tends to increase with input training data volume increases. The increasing accuracy of ANNs contrasts with traditional ML models that reach a plateau in performance even when very large volumes of training data are used. Another great advantage of deep neural networks over traditional ML models is their ability to perform automatic feature extraction from raw data. Furthermore, ANNs can perform very well in classification and regression tasks, while exceling in a variety of domains and inputs. The inputs to ANNs are not restricted to tabular data. Rather they can expand to unstructured data such as images, text, and audio data.
Modern state-of-the-art deep neural networks use gradient-based optimization to minimize the error on the training set and use the fastest possible way to compute the gradient via a technique called back propagation, which is an instance of a more generic technique called “automatic differentiation.” Multilayer perceptron networks (MLPs), convolutional neural networks, and long short-term memory recurrent neural networks are some of the most indicative deep neural networks using automatic differentiation for their learning. Despite their popularity, DL models have a major disadvantage when it comes to policy extraction. Specifically, the resulting models are so complex that operate as black boxes. This makes them non-transparent and essentially impossible to understand by any human.
3.2. XAI methods
The rising popularity of DL has driven a need to explain and interpret the workings and decisions made by ANN trained classifiers. There is a subtle but important difference in the semantics of the words “explainable” and “interpretable.” An interpretable model is a model whose decision-making process is easily understood by a human even if the rationale behind the process might not be clear. For example, a classifier that outputs a decision tree is easy to replicate its decision on a particular input data instance, even without resorting to the use of a computer at all. All a human must do is follow the branches of the tree according to the values in the data instance until they reach a leaf node that is always labeled with a classification label. The process is fully interpretable, even if the reasons why the tree was constructed in this way may be completely incomprehensible to the user. An explainable model, on the other hand, is a model that can somehow provide an explanation for its decision given a particular data instance. This begs the question “what constitutes an explanation?” Recently, a lot of research in XAI has focused in two directions. The first direction is based on the so-called SHapley Additive exPlanations (SHAP) (Fryer et al., Reference Fryer, Strümke and Nguyen2021) approach. SHAP is based on the economic theory of the individual value a colleague brings to a collective effort of a finite number of individuals. The SHAP theory indicates that in order to measure how much is the fair share of a particular individual to the outcome of a collective effort, one needs to:
-
• calculate the total outcome of the collaboration for any given subset of the collaborators,
-
• compute the gain that any such team will obtain when they add the particular individual to their ranks, and
-
• offer a fair share to the individual the average value of all these gains.
This fair share value is known as the Shapley value of the individual for the given collaboration group. Transferring this concept to the ML field, one can imagine the individual features contained in a tabular dataset as the collaborators in the final estimation of a classification label for a given data instance. Using the above theory, one can compute in theory the importance of each feature in the decision-making process for a given data instance as the Shapley value of that feature. In practice, due to the large number of computations that this process entails, only a sample of the possible “colleague configurations” is tested and averaged. Hence, the value computed is usually only a statistical estimate of the true Shapley value of the feature.
The SHAP methodology provides a framework that covers to a significant degree the second major direction in approaching explanations for black box models, namely the Locally Interpretable Model Agnostic Explanations (LIME) method (Ribeiro et al., Reference Ribeiro, Singh and Guestrin2016). The LIME method seeks to build a model “around” a new data instance and the relevant decision made by the black box classifier. To this end, it chooses instances “close” (according to some notion of distance) to the given data instance and applies the black box model on those instances to get <data, black-box-label> pairs for a dataset in the neighborhood of the original data instance. It then proceeds to build a simple interpretable model, such as a decision tree or a logistic regression model, on this just constructed dataset. Finally, it proposes the resultant model as a locally valid “interpretation” of the black box behavior in this neighborhood.
Both methods have proved very useful in helping people decide the trustworthiness of complex models built on non-tabular data, such as text or images. For example, a trained deep neural network on a text corpus comprised of messages posted on “atheism” and “Christianity” newsgroups achieved a 94% accuracy on held-out test data. However, when questioned about the features that weighted the most on its decisions revealed that the presence of words such as “posting,” “hosting,” and “Keith” were key to deciding that the message was about atheism, which makes absolutely no sense. Indeed, when the same trained model was evaluated on a newer set of messages posted on the same newsgroups, it achieved an accuracy of approximately 58% proving that the model was nearly useless. This demonstrates the dangers of blindly accepting non-explainable black box models based just on accuracy measures.
3.3. QARMA ML models for XAI
While the importance of estimating feature weights on the final decision made by a black box classifier cannot be underestimated, we claim that such feature weighting does not constitute intuitive, human-friendly explanations of a model’s decisions. In particular, in the case of the LIME method, every time an explanation is requested for a model decision, a new (interpretable) model must be built from scratch. This makes the process non-reactive as it is almost impossible to always respond in near real time.
On the other hand, explanations based on rules that hold with high confidence on the dataset are easy for people to grasp and correspond more intuitively to what people expect from an “explanation.” For example, consider a case where a customer’s bank loan application is rejected. When faced with the following explanations, which is more likely to be understood by the customer as more appropriate?
-
1. “The importance of the feature ‘declared bankruptcy within the last year’ is highest among all other features” or
-
2. “Your application was rejected because you declared bankruptcy within the last year, and from our records, with probability 99%, if an application has the ‘declared bankruptcy’ check box ticked, the loan is not paid back on time”?
The second explanation cites a rule that holds with high accuracy on the dataset and provides enough evidence as to the reason behind the rejection. Therefore, it constitutes a sufficient explanation for the user. In all cases, including the rule-based offered explanation, the real workings of the black box model that made its decision might be completely different from what is offered as an explanation. This must be expected since the black box model is by definition opaque and there is no way to know exactly how it works.
To offer rule-based explanations, we need to know all rules that apply on a given dataset. Restricting our attention to tabular data only, we apply QARMA, a family of highly parallel/distributed algorithms that extract all non-redundant quantitative association rules that hold with at least a certain user-defined minimum support and confidence on the dataset (Christou, Reference Christou2019). QARMA produces all valid, and non-redundant rules of the forms:
 $$ {a}_k\in \left[{l}_k,{h}_k\right]\wedge \dots {a}_m\in \left[{l}_m,{h}_m\right]\to t\ge L $$
 $$ {a}_i\in \left[{l}_i,{h}_i\right]\wedge \dots {a}_j\in \left[{l}_j,{h}_j\right]\to t\le H $$
for regression tasks and
 $$ {a}_p\in \left[{l}_p,{h}_p\right]\wedge \dots {a}_q\in \left[{l}_q,{h}_q\right]\to t=v $$
for classification tasks.
Each of the above rules are guaranteed to hold with minimum support and confidence on the dataset. The variables $ {a}_i,\dots {a}_q $
are input features in the dataset, and
$ {a}_i,\dots {a}_q $
are input features in the dataset, and $ t $
is the target variable. The rules, once extracted, are permanently stored on a (relational) database.
$ t $
is the target variable. The rules, once extracted, are permanently stored on a (relational) database.
Having obtained all the rules that hold on the dataset, the system offers explanations given a new pair of a data instance plus black box prediction on that instance.
For a classification problem, the system scans the entire ruleset in the database and collects all rules for which the <data instance, prediction> pair satisfies both their antecedent conditions as well as the consequent. From this collected set, the rule(s) with maximum confidence (and maximum support, in case of ties) is presented to the user as explanations of the black box prediction.
For a regression task, QARMA collects again all rules which obey the <data instance, prediction> pair, and from this set, it picks as explanations up to two rules, one of which constrains the value of the target variable from above, and the other from below. From the set of all rules that are satisfied by the <data, prediction> pair with the black box model prediction being the equality “ $ t={v}_c $
,” it picks the rule that predicts an inequality of the form “
$ t={v}_c $
,” it picks the rule that predicts an inequality of the form “ $ t\ge {v}_{mx} $
,” with
$ t\ge {v}_{mx} $
,” with $ {v}_{mx} $
being the largest value appearing in the consequent of any rule of this form that is still less than or equal to the black box predicted value
$ {v}_{mx} $
being the largest value appearing in the consequent of any rule of this form that is still less than or equal to the black box predicted value $ {v}_c $
; ties are broken in favor of the rule with the highest confidence, then in favor of the rule with highest support. Similarly, it picks the rule that predicts an inequality of the form “
$ {v}_c $
; ties are broken in favor of the rule with the highest confidence, then in favor of the rule with highest support. Similarly, it picks the rule that predicts an inequality of the form “ $ t\le {v}_{mn} $
,” with
$ t\le {v}_{mn} $
,” with $ {v}_{mn} $
being the smallest value appearing in the consequent of any rule of this form that is still greater than or equal to the black box predicted value
$ {v}_{mn} $
being the smallest value appearing in the consequent of any rule of this form that is still greater than or equal to the black box predicted value $ {v}_c $
; ties are broken as already mentioned.
$ {v}_c $
; ties are broken as already mentioned.
The resulting rule(s) are immediately understood by humans and constitute a much more intuitive explanation of the black box decision. In cases black box models, such rules can help trace the error in the dataset and in the statistics of the dataset (the rules that hold on it) that lead to the wrong decision. Furthermore, it offers combinations of feature quantifications that lead to problematic decisions. Hence, such rules can provide deeper insight into the source of the problem than individual feature importance metrics can offer.
The XAI module of the AI4PublicPolicy platform (Figure 3) is powered by the QARMA ML framework. This enables the platform to produce policy insights in the form of explainable rules that can be understood and interpreted by policymakers. Overall, the project’s platform provides the means for explaining DL techniques. This enables policymakers to leverage the high-performance and accuracy of ANNs in practical settings.
3.4. AI policy development in line with the AI Act
The deployment and use of AI systems is associated with several risks, including, for example:
-
• Bias and fairness risks which are associated with AI algorithms that lead to unfair and discriminatory outcomes (Srinivasan and Chander, Reference Srinivasan and Chander2021; Suresh and Guttag, Reference Suresh and Guttag2021), in applications like hiring, loan approvals, and criminal justice.
-
• Security risks, which are associated with AI systems that are vulnerable to attacks and manipulation. For instance, there are adversarial attacks that can mislead AI models causing them to produce wrong outputs (Apruzzese et al., Reference Apruzzese, Andreolini, Marchetti, Venturi and Colajanni2020). Such attacks take place by introducing subtle changes to the input data of the model.
-
• Privacy risks, which often arise as a result of the unauthorized use of privacy-sensitive data during the training of AI algorithms (Rahman et al., Reference Rahman, Arshi, Hasan, Mishu, Shahriar and Wu2023).
-
• Safety risks, as errors in AI predictions or decisions of autonomous systems (e.g., robots, drones) can have serious health and safety implications for their users (e.g., industrial workers) (Westhoven, Reference Westhoven2022).
This is gradually leading organizations to assess the risks of their AI deployments based on risk management frameworks such as the NIST framework (NIST, 2021). In recent years, framework for AI risk assessment have also emerged such as the ISO/IEC 23894:2023 standard (ISO/IEC, 2023). The latter helps organizations to integrate risk management in their AI-related activities. At the regulatory forefront, the AI Act is also adopting a risk-driven approach to the regulatory compliance of AI deployment. Specifically, according to the AI Act, policymakers that use ML for data-driven policy development must perform a risk assessment of their AI systems. The result of the assessment indicates whether a system is of high, low, or medium risk. Systems of different risk levels then subject to varying explainability requirements for their AI models as illustrated in Table 1. The table presents a recommendation for the ML model to be used for each one of the different outcomes of the risk assessment.
Table 1. Mapping explainability requirements to different ML models
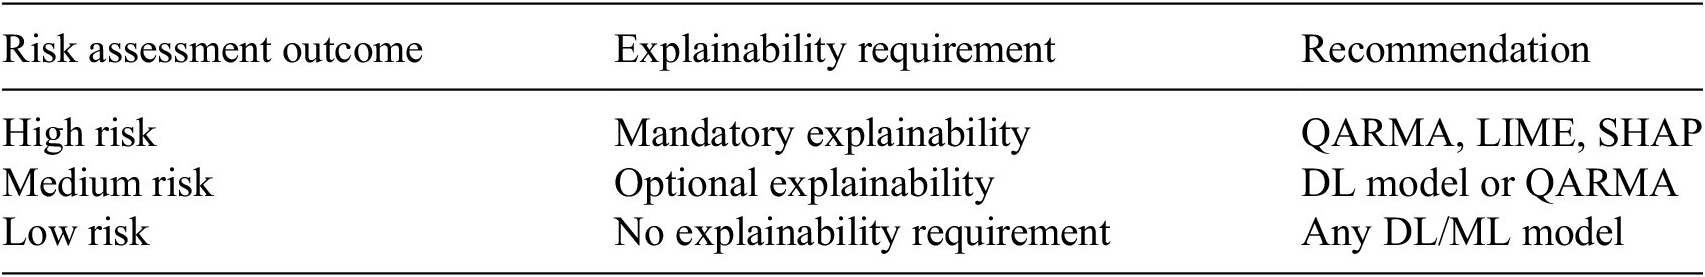
QARMA’s ability to provide both explainable and high-performance policy extraction makes it an ideal choice for high-risk AI use cases that deal with critical policy decisions. Most public policies concern high-risk decisions, which means that QARMA has a very broad applicability. Specifically, QARMA can be used in high-risk applications, even in cases where DL models yield better performance than QARMA in specific datasets. This is because DL models are generally not explainable, which hinders their use in high-risk use cases according to the AI Act. Moreover, it is also possible to use QARMA in conjunction with DL models to boost their explainability, as illustrated in the following section.
4. Validation in real policymaking cases
4.1. The AI4PublicPolicy platform as a validation testbed
To validate our explainable and regulatory compliant approach to public policymaking, we have leveraged some of the capabilities of the AI4PublicPolicy platform and the VPME environment that have been introduced in Section 2. Specifically, we have used the platform to experiment with different ML models and datasets in a variety of use cases. The platform’s data collection and management APIs have been used to acquire datasets from legacy data sources, including systems and file collections used by local governments and other policymaking organizations. The various datasets have been registered to the dataset catalog and used to test different ML models that led to new policy models. The latter have been also integrated in the platform’s catalog. To test, validate, and evaluate different ML models, we have relied on the CRISP-DM. Different ML models (including QARMA) have been tested in terms of their performance, accuracy, and predictive power over the available datasets. In this direction, the ML and XAI modules of the platform have been leveraged (Figure 3) over real-life datasets of the use cases. The best performing models have been accordingly explained and presented to end users (i.e., policymakers).
4.2. Smart parking policies (Athens, Greece)
To validate our QARMA approach for public policymaking, we applied the algorithm on a parking space availability dataset provided by the city of Athens, Greece, which participates in the AI4PublicPolicy project. Specifically, we have ran the QARMA algorithm and extracted all rules that hold on the dataset that have consequent rules of the form $ target\ge v $
or alternatively
$ target\ge v $
or alternatively $ target\le v $
where the variable
$ target\le v $
where the variable $ target $
represents the number of available parking slots in a particular zone, i.e., a geographic area of the municipality. We also trained a deep neural network to learn to predict this target variable given values for the input features, which are hour of day, day of month, month of year, particular zone, etc. We then created a REST (Representational State Transfer) application that listens to resource “/explain” for HTTP (Hypertext Transfer Protocol) POST requests with a JSON (JavaScript Object Notation) body containing the values for a data instance, together with the predicted value for that instance by a black box deep neural network. Figure 9 shows a particular REST API call and the response received by this call. The latter shows two rules that perfectly explain the decision of the neural network. Once our REST web app has loaded, the rules from the database (145,224 rules constraining the target value from below, and 129,236 rules constraining the target value from above), it takes few seconds to respond over HTTP to any request, making the web app fully interactive with a human user trying to understand the decisions of the neural network.
$ target $
represents the number of available parking slots in a particular zone, i.e., a geographic area of the municipality. We also trained a deep neural network to learn to predict this target variable given values for the input features, which are hour of day, day of month, month of year, particular zone, etc. We then created a REST (Representational State Transfer) application that listens to resource “/explain” for HTTP (Hypertext Transfer Protocol) POST requests with a JSON (JavaScript Object Notation) body containing the values for a data instance, together with the predicted value for that instance by a black box deep neural network. Figure 9 shows a particular REST API call and the response received by this call. The latter shows two rules that perfectly explain the decision of the neural network. Once our REST web app has loaded, the rules from the database (145,224 rules constraining the target value from below, and 129,236 rules constraining the target value from above), it takes few seconds to respond over HTTP to any request, making the web app fully interactive with a human user trying to understand the decisions of the neural network.

Figure 9. Calling QARMA as a REST web app to explain black box model decisions for smart parking policies.
The explanations provided by the proposed rules are providing deeper and clearer intuition than a sorted list of features in order of importance in the case of the SHAP method or the approximate local (usually linear) model that LIME offers. What is more important, the rules come with support and confidence values associated with them. Therefore, a small confidence value for either of the two rules, or consequent values that are far from the black box prediction, are strong indicators that the black box prediction should not be trusted very much. In the worst case, there will be no rule in support of the black box prediction. In such a case, the prediction should not be trusted, especially for high-stake decisions (e.g., legal or health-related use cases). The latter are also the types of use cases that would be classified as high risk according to the AI Act of the European Parliament and the Council of Europe.
In the available parking space prediction problem, a new dataset was also constructed. It included variables capable of providing a possible correlation with the free parking spaces variable. For this problem, three models were developed with their complexity as the main criterion. The models included a simple linear regression, a support vector machine model modified to work for regression, and a MLP. The relative absolute error (RAE) was used as an evaluation metric. Since the metric is an error, the less the value of the RAE metric, the better the model performs.
As is evident, the MLP neural network not only outperformed the rest of the models, it also achieved a very good RAE that was very close to zero. The results from the solution of the available parking spaces indicate that a future enrichment of the dataset could lead to higher performing models. For a better understanding of the results, a bar plot visualization was constructed where the models RAE percentage is more clearly compared (Figure 10). The MLP neural network gives by far better results than the other models.

Figure 10. Comparing alternative ML models for smart parking policies extraction.
Moreover, the QARMA explainable model has been applied to the dataset to explain the DL model’s predictions, to give a clearer explanation of why the MLP model made a certain prediction, and to indicate which values of the other dataset features played a major role in the decision (Figure 11). Given our predictions and the test dataset used for the prediction, QARMA produced a set of 2 rules each time in the form of antecedents and consequents. The ranges of the feature values explain that the dataset features range between these values when the model outputs the current value for the target variable. Hence, QARMA can be also used in conjunction with a DL approach to explain a black box model.
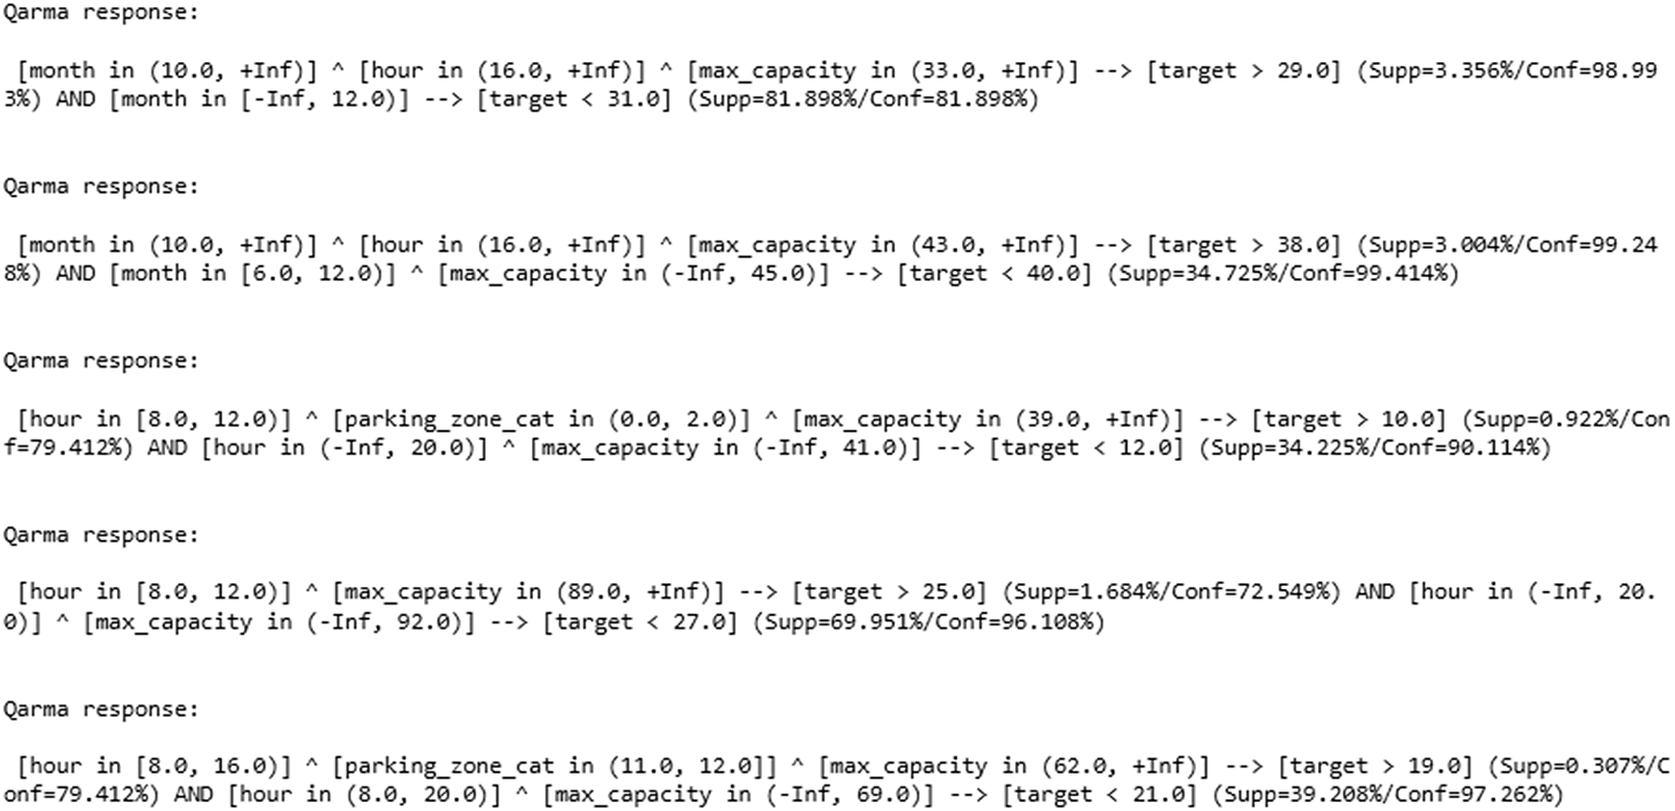
Figure 11. Explaining a deep neural network for smart parking policies via QARMA-derived rules.
4.3. Infrastructure maintenance policies (Burgas, Bulgaria)
A second validation scenario was run on infrastructures’ maintenance datasets. Specifically, the problem that needed to be resolved was the “issue prediction” problem for the municipality of Burgas that participates in the AI4PublicPolicy project. The municipality receives “issues” for maintenance problems via an automatic online application for its services that are provided by different authorities in the municipality. The first pre-processing step is to cluster the data for both visualization and prediction purposes. The municipality of Burgas set forth the following rules to be obeyed by any clustering process:
-
(i) any two issues that are located up to 80 m apart are considered to be “connected,” i.e., must belong to the same cluster.
-
(ii) a cluster is a maximal set of points that has the property that any two points in the set are connected via at least one path of points such that any two consecutive points in any such path are less than 80 m apart.
This implies that a hierarchical agglomerative clustering (HAC) approach with single-linkage clustering (Sibson, Reference Sibson1973) which runs until all coarsest clusters are found will determine the sought-after clusters. The problem is equivalent to finding all connected components in a graph. However, the HAC with single-linkage approach is an unsupervised clustering approach that allows for visualization of the intermediate clusters that are created before the final ones. Given the clustering, our next step is to compute the areas of highest density of issues over time: every cluster gives rise to a geographic area defined as the convex hull of the points in the cluster. The density of the cluster is the number of points in the cluster divided by its area. Our system “predicted” as next issue area the convex hull of the cluster with the highest density, for any cluster of size greater than 1.
4.4. Water infrastructure management policies (Burgas, Bulgaria)
This validation scenario concerns policies for water distribution infrastructure maintenance. Specifically, the policies consider water leakage detection on water pipes for the municipality of Burgas, which faces recurrent leakages in their water distribution network infrastructure. The goal of the policy is to optimize the repair of the leakages in ways that maximize the uptime of the water infrastructure. As a first step toward detecting such leakages, an experiment was set up based on data collection from a single vibration sensor (see Figure 12). Several scenarios were explored, in which some taps were opened to simulate a leakage in the pipe (see Figure 13). The collected dataset provided vibration measurements along with the timestamp at which the measurements were taken, and an indication of whether a tap was open or not. This last binary variable (0/1) served as the ground truth (label) of the dataset, i.e., forming a pure classification problem. From these values, a dataset was constructed, part of which can be seen in Figure 14. The analysis of this dataset did not produce meaningful visualizations. Therefore, the next AI pipeline module was triggered, which performed additional data engineering on the dataset. Based on this, various vibration patterns were found to change under leakage conditions (Figures 15 and 16). Because of the very high sampling frequency, the initial experiments with a simple pre-processing of the data did not produce decent results, which led to experimentation with another pre-processing approach. A sliding time window of 30000 points (corresponding to 5 seconds of wall-clock time) was defined, and 33 points were finally kept as follows: 999 points out of every 1000 points were dropped, keeping only the first one. This “downsampling” resulted in a dataset in which only 30 data points exist for every 5 seconds (i.e., spread one sixth of a second apart).

Figure 12. Experimental water pipe setup.

Figure 13. Water management experiment details.

Figure 14. Initial constructed dataset.

Figure 15. Opened taps—vibration visualization.
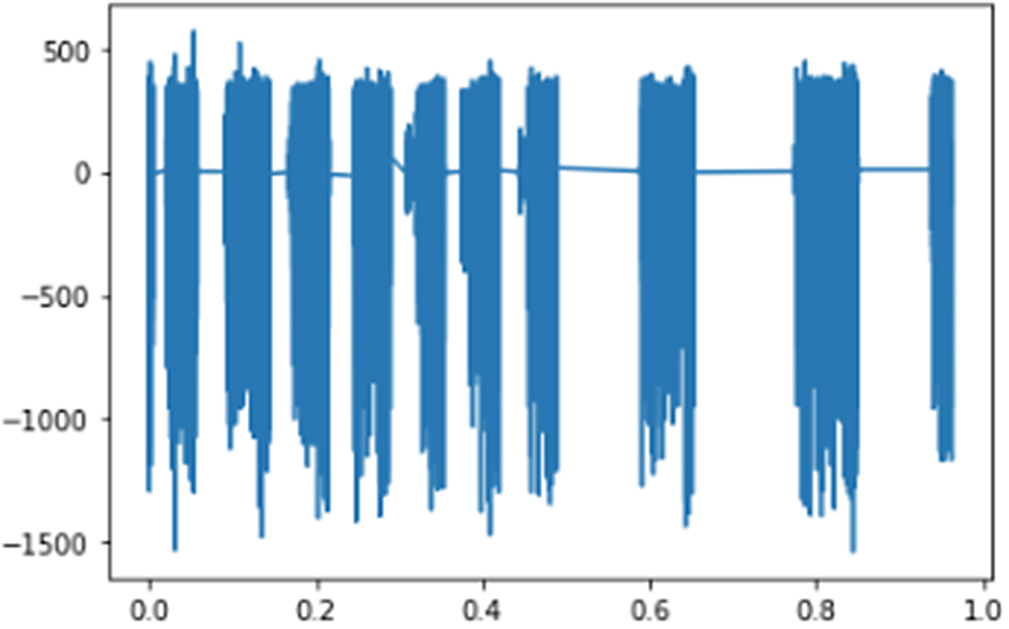
Figure 16. Closed taps—vibration visualization.
In the scope of the experiment, we kept track of the minimum, maximum, and average value of all the 30000 points in the time window, for a total of 33 numbers. Therefore, every sliding window was summarized in a vector of 33 dimensions. Since a sliding time window is used, the total number of rows in such a dataset would be N-30000, where N is the total number of vibration measurements. Since N is measured in the billions, the number N–30000 as a number representing the total size of a training time series is still too big for ML training on single machine (e.g., personal computer). For this reason, we further downsampled our data and kept only 1 out of every 100 of the created vectors, which resulted in a downsampling by a factor of 100, i.e., keeping 1% of all the vectors. The resulting dataset led to neural network models that obtained 88% overall accuracy and a macro average F1-score of 86% and weighted average F1-score of 88% (Figure 17). Finally, the confusion matrix and the actual numbers and percentages presented at Figure 18 show that the ANN achieved very good overall performance, even with pre-processing with data from a single sensor that measured the water’s vibration.

Figure 17. Classification report—leakage neural network results.
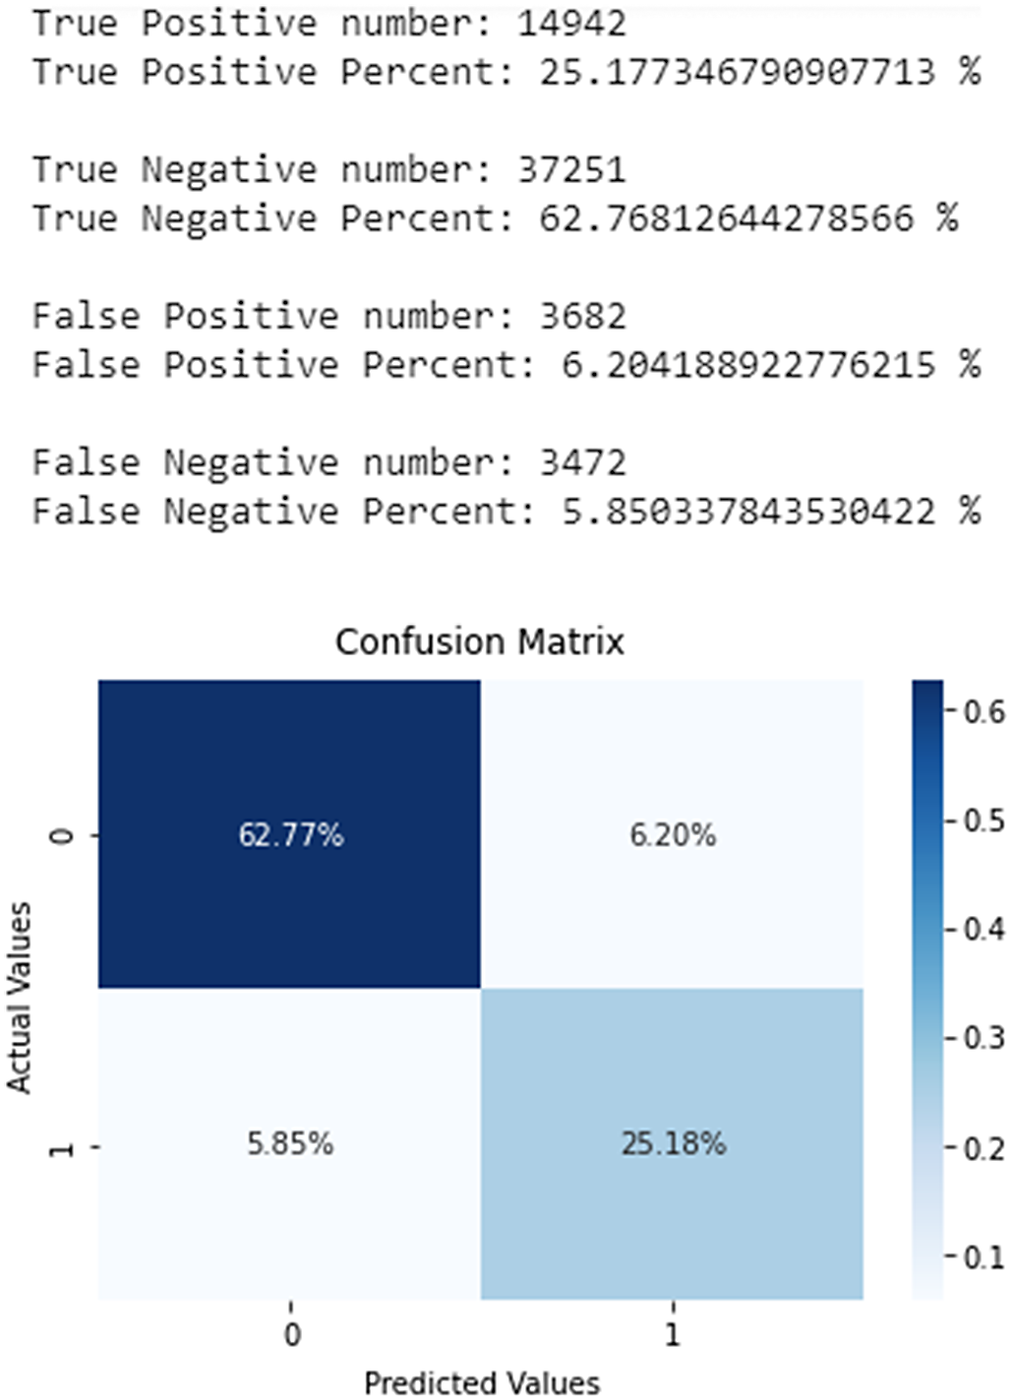
Figure 18. Confusion matrix of the ML model predictions regarding water leakages.
On another set of experimental data with 5 target classes corresponding to different open-tap scenarios of the same water pipe, using 2 vibration sensors, we were able to achieve much higher accuracy (approximately 98%) and F-1 score (approximately 97%) when using explainable rule-based methods rather than neural networks and cross-validation instead of train-test splitting of the dataset (see Figure 19). In particular, in this second dataset, rule-learning methods such as RIPPER, Decision Table, and QARMA achieve an estimated accuracy on unseen data that is always above 98%; an ANN with a single hidden layer achieved an accuracy of 82%.

Figure 19. Accuracy comparison between ML models second dataset containing water leakages for Burgas municipality (bigger is better).
5. Conclusions
Nowadays, policymakers are provided with unprecedented opportunities to collect and manage digital data from a variety of different channels, including citizens’ touch points, e-services, and social networks. These data enable a transition to data-driven, evidence-based policymaking based on the use of ML and AI technologies. Nevertheless, the use of AI in public policymaking is still in its infancy, as challenges associated with transparency, explainability, and bias alleviation are not fully addressed yet. Moreover, public policymakers must comply with emerging AI regulations such as the AI Act. This paper has presented and discussed these challenges, along with potential solutions at the AI system development and ML modeling levels. Our main value propositions lie in the introduction of blueprints for developing AI systems for policy developments as well as in the application of the QARMA ML framework for the extraction of explainable policies. QARMA provides a very good balance between performance and explainability, which makes it appropriate for use in high-risk policymaking decisions. Specifically, it is a very good choice for cases where high-performance DL models must be explained by means of a surrogate model.
Overall, the paper presented an approach to explainable and regulatory compliance policy development based on AI technologies. The approach has been already validated using smart parking, infrastructure maintenance, and water infrastructure management datasets. Our validation has proven a dual merit for QARMA, i.e., both as high-performance ML model and as an explainability tool during the policy extraction process. Coupled with the presented VPME, the QARMA family of algorithms provides a powerful toolset for policymakers that aspire to adopt and fully leverage ML in their policy development processes.
Data availability statement
None—Data and Code of QARMA are proprietary.
Acknowledgements
Part of this work has been carried out in the scope of the H2020 AI4PublicPolicy project, which is titled: “Automated, Transparent Citizen-Centric Public Policy Making based on Trusted Artificial Intelligence.” The authors acknowledge support and contributions from all partners of the project. An earlier and reduced version of this paper has been presented in the scope of the “Data for Policy” conference, which was held in Brussels, on December 13, 2022.
Author contribution
Reference architecture, data mining process, and VPME specification and implementation: C. Ipektsidis, A. Amicone. QARMA specification and implementation: I. T. Christou. Introduction and mapping to regulatory requirements: J. Soldatos. Validation on smart parking and infrastructure maintenance: T. Papadakis, I. T. Christou. Smart water management datasets: T. Papadakis, I. T. Christou. Writing—original draft: all authors. End-to-end editing of the paper: J. Soldatos. All authors approved the final submitted draft.
Funding statement
Part of this work has been carried out in the scope of the AI4PublicPolicy Project, which has received funding from the European Commission under the H2020 programme (contract No. 101004480). The funder had no role in study design, data collection and analysis, decision to publish, or preparation of the manuscript.
Competing interest
The authors declare no competing interests exist.


 Open access
Comments
No Comments have been published for this article.