


Optimal nutrition is essential for healthy ageing as advancing age increases the risk for chronic diseases and other health concerns. Healthy diet offers one of the most effective ways to decrease the burden of many chronic diseases and associated risk factors. Ageing adults are recognised as one of the key groups to focus with nutritional approaches that support survival( Reference Ohlhorst, Russell and Bier 1 ). Ageing is a multi-factorial process and the definition of successful ageing remains a matter of debate, but several markers of successful ageing have been identified, including not only physical functioning but also cognitive functioning, mental health and other psychosocial markers( Reference Anton, Woods and Ashizawa 2 ). Ageing trajectories are likely to be plastic and may respond to dietary and other lifestyle interventions( Reference Mathers 3 ). Dietary patterns have been associated with several aspects of successful ageing; cognition among them and dietary interventions may be a tool to support healthy ageing, although more longitudinal studies are needed( Reference Milte and McNaughton 4 ). Ageing populations are heterogeneous and require tailored interventions to ensure that different nutritional challenges are met( Reference Bales, Locher and Saltzman 5 ).
In the Finnish Geriatric Intervention Study to Prevent Cognitive Impairment and Disability (FINGER), we have completed a successful 2-year multi-domain lifestyle intervention aiming at prevention of cognitive decline( Reference Ngandu, Lehtisalo and Solomon 6 ), with dietary counselling as one of the intervention domains. Intervention goals were based on Finnish dietary recommendations( 7 ). At the time of the study initiation, despite several promising hypotheses, there was insufficient evidence to support specific cognition-enhancing dietary recommendations( Reference Gillette Guyonnet, Abellan Van Kan and Andrieu 8 ). National guidelines were considered to cover all the dietary factors related to cognitive function, and to be suitable for people with chronic conditions. Furthermore, they have beneficial effects beyond cognition – for example, on cardiovascular risk factors. This approach is in accordance with the literature up to date, whereas more data are now available on cognition and specific foods and nutrients( Reference Vauzour, Camprubi-Robles and Miquel-Kergoat 9 ) and dietary patterns, such as the Mediterranean Diet (MeDi)( Reference Petersson and Philippou 10 ). Special emphasis in counselling was on the quality of fat, quality of carbohydrate, whole-grain intake, fish intake and fruit and vegetable intake, which were considered the factors with strongest evidence regarding brain health.
The aim of this paper was to demonstrate the overall dietary changes among older adults during an intervention following general recommendations and targeting several dietary factors simultaneously. Primary outcome is a composite score assessing adherence to main dietary goals of the intervention, and we further study how the dietary guidance affected intakes of both micro and macronutrients and food consumption.
Methods
Study design and participants
The FINGER study participants derive from a pool of population-based samples from earlier national health surveys in six centres in Finland (Helsinki, Vantaa, Kuopio, Oulu, Seinäjoki and Turku). Participants were invited based on their age (60–77 years old in the beginning of the study) and elevated risk for dementia identified with a dementia risk score( Reference Kivipelto, Ngandu and Laatikainen 11 ) and their cognitive function at the mean level or slightly lower than expected for age. The sample was described in detail previously( Reference Ngandu, Lehtisalo and Levalahti 12 ). Participants were randomised to multi-domain lifestyle intervention or control (1:1).
Components of multi-intervention
Before randomisation all participants received an oral mini-intervention given by the study nurse covering general recommendations of all intervention components. After randomisation, the intervention group was offered dietary counselling, physical exercise programme, cognitive training and management of metabolic and vascular risk factors. Timing and construction of the multi-domain intervention is presented in Fig. 1. The other interventions are described more in detail previously( Reference Ngandu, Lehtisalo and Levalahti 12 ).
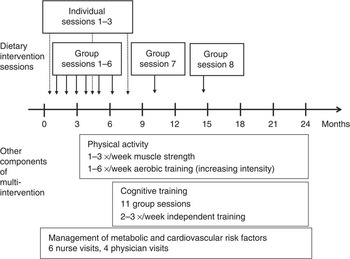
Fig. 1 Timing of dietary intervention and other components of multi-intervention. Group sessions 7 and 8 not available in all study centres.
The control group received regular health advice, which included meeting the study nurse regularly for health assessment and being informed about their risk factors measured during study visits (anthropometric measures, laboratory measures). Group allocation was not actively communicated to participants, and opportunities for between-group interactions were restricted as much as possible.
This study was conducted according to the guidelines laid down in the Declaration of Helsinki, and all procedures involving human subjects were approved by the Coordinating Ethics Committee of the Hospital District of Helsinki and Uusimaa. Written informed consent was obtained from all subjects. This trial is registered with ClinicalTrials.gov (no. NCT01041989).
Outcomes
Diet quality described as nutrient intakes and food consumption was a pre-specified secondary outcome of the FINGER trial.
Diet
Dietary data were obtained from a 3-d food record completed close to annual visits. The record consisted of 3 pre-defined consecutive days (i.e. participants were not allowed to choose the recorded days themselves), 2 weekdays and 1 weekend day (Thursday to Saturday or Sunday to Tuesday). Participants were given written instructions to record all foods and beverages they had consumed, including the type, brand and preparation method, with household measures. They were asked to report all vitamin and mineral supplements. Trained study nurses checked the food records and missing data were added after discussion, when needed. Dietary data were recorded by trained nutritionists and analysed using a software program developed at the National Institute for Health and Welfare and the Finnish food composition database Fineli( 13 ) (http:// www.fineli.fi). The program allows modification of standard recipes, and personal recipes were used whenever available (e.g. the type of fat used in cooking). Foods and beverages were categorised and summarised into main categories. Food consumption was computed as ingredient consumption – for example, vegetables and fats used in cooking are included in the ‘vegetables’ and ‘oil’ or ‘butter’ groups. Ingredient classes usually cooked with water, such as cereals, are calculated as the actual amount of cereal – for example, flour in bread or grains in porridge. For nutrient intake, only nutrient intakes from food were included except for vitamin D. In Finland, vitamin D supplements are recommended for all people and supplemental intake represents a remarkable proportion of total intake, and thus intake from both foods and supplements is provided. Other supplements are generally not recommended and their use was not subject to the intervention. Therefore, supplemental nutrient intakes are not taken into account in these analyses. Foods and nutrients were analysed as daily average intake calculated as mean of the 3 d. We included also records with only 1 or 2 recorded days in the analyses.
Dietary adherence score
We formulated a composite score to reflect overall adherence to the intervention goals and hence to the national dietary recommendations. The goals chosen to the composite score reflected quality of macronutrients and food choices considered most important for cognition. These were proportion of energy from SFA plus trans-fatty acids (referred to as SFA goal, although covering also trans-fatty acids), PUFA, sucrose, protein and alcohol, intake of dietary fibre, and consumption of vegetables, fruit and fish (Table 1). Energy-adjusted recommendation for dietary fibre (3 g/MJ of energy) was utilised in the score to diminish the influence of total energy intake. Because of methodological issues, some original goals were modified – for example, salt intake goal was excluded from the score, and surrogate measures were used for whole grain (fibre) and added sugar (total sucrose) (see ‘Discussion’ section for details). Participant was assigned 1 point for each goal when achieving the pre-defined level of intake, and 0 otherwise (range 0–9).
Table 1 Construction of intervention adherence score with food-level goals
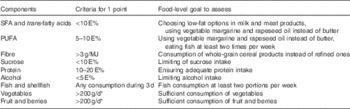
E%, proportion of total energy intake.
* 400 g/d mentioned in the recommendations divided into separate vegetable and fruit groups.
Covariates
Details of study visits have been described previously( Reference Ngandu, Lehtisalo and Levalahti 12 ). In brief, annual study visit comprised measurements of height (without shoes), weight (in light indoor clothing), waist (midway between the lowest rib and iliac crest) and hip (at the point yielding the maximum circumference over the buttocks) circumference in a standing position, and systolic and diastolic blood pressure (two measurements using a validated automatic device (Microlife WatchBP Office) in a sitting position, using the right arm, after 10 min of rest). The mean value of two blood pressure measurements was calculated. A fasting venous blood sample was taken from all participants to determine several risk factors, including cholesterol and glucose. Anthropometric measurements and blood samples were collected by trained study nurses. Participants also reported their background information and general health information with several questionnaires, including questions about education and marital status.
Dietary intervention
Goals of the dietary intervention
Goals of the intervention were based on the Finnish nutrition recommendations( 7 ), which were translated into food consumption goals comprising sufficient consumption of fruit and vegetables (above 400 g/d), consumption of whole-grain cereal products instead of refined ones, choosing low-fat options in milk and meat products, limiting of sucrose intake to <50 g/d, using vegetable margarine and rapeseed oil instead of butter or butter-oil mixtures, and fish consumption of at least two portions per week. Food-level goals were the ones communicated to the participants, not the nutrient intake goals, which are regarded as population level goals.
Need for weight loss was always considered individually after taking into account BMI, health status, age and diet of the participant. If clear targets for reducing energy intake, such as high intake of energy content from sucrose, SFA or refined cereal, could be identified, these were discussed. Especially with older participants (>70 years), weight loss was not always recommended for those overweight, but, when considered safe, energy intake facilitating 5–10 % reduction in body weight was recommended. Special attention was paid for preventing unintentional weight loss.
Vitamin D supplement was recommended for all. Shortly after initiation of our intervention in 2010, a new recommendation for supplemental use of vitamin D among the elderly was introduced( 14 ) advising 20 µg daily dose throughout the year instead of the older recommendation of 10 µg during the winter months (October to February). As a panel decision, a minimum of 10 µg supplementary dose was recommended daily throughout the year. As dietary sources of vitamin D and the supplementation were emphasised during the intervention and also in the mini-intervention, this approach was estimated safe for our participants. Advice on vitamin D supplementation was included in our mini-intervention for the control group as well.
Setting for dietary intervention
The dietary intervention was planned exploiting experiences from former Finnish lifestyle intervention trials( Reference Lindstrom, Uusitupa and Tuomilehto 15 ) and was delivered by trained nutritionists. It was based on the theoretical guides to intervention planning approaches such as Intervention Mapping( Reference Bartholomew, Parcel and Kok 16 ) with special emphasis on translating the main goals (dietary recommendations) into concrete behaviours, first through the food-based goals for all participants (e.g. ‘fish twice a week’, ‘400 g fruit and vegetables every day’) and ultimately through individual goals for each participant (e.g. ‘I will replace my afternoon snack with a fruit’; ‘I will have salad at every meal’; ‘I will replace my breakfast cereal with oats porridge’; ‘I will use vegetable fats instead of butter on bread’). Intervention was constructed utilising health action process model, which combines stages of change with social cognitive theory, and has been applied in previous Finnish studies( Reference Uutela, Absetz and Nissinen 17 ). Practical strategies in the intervention included goal setting, problem solving, coping skills, self-evaluation and feedback, in order to enhance both self-efficacy and outcome expectancies, and knowledge. Motivational interviewing was partly applied during the individual meetings, and all goals were tailored to individual needs and capabilities.
Intervention was carried out as a combination of individual counselling and group sessions as described in Fig. 1. At the individual meetings personal adjustments were considered (e.g. health status and medications related to diet) and individual goals were set together with the participant after a motivational discussion. All individual goals were set on a practical level utilising the so-called SMART principle (S-Specific; M-Measurable; A-Achievable; R-Realistic; and T-Time-framed). During the group sessions, important food-related themes were discussed at general level – for example, how to read and interpret package labels, how to modify recipes into a healthier direction, or how to deal with craving (online Supplementary Table S1). Both instructor-led and participant-focused approaches such as group work and discussion were applied during group sessions.
Statistical analysis
Characteristics between the groups at baseline were compared using t test for continuous variables and χ 2-test for categorical variables. Linear mixed modelling was applied for dietary analyses with time as random factor and nutrient intake or food consumption as an outcome. Time was entered as a categorical to allow non-linear change over time, and the interaction term between the group and time represented the difference in change between the groups. Within-group changes were also estimated from mixed models. Sample size was based on expected changes in primary outcome of the trial, cognitive function, and is described elsewhere( Reference Ngandu, Lehtisalo and Solomon 6 ).
Nutrient intakes were analysed both per se and as nutrient densities, where intake per 1 MJ of energy was computed. Zero-skewness log transformation was applied for dietary variables, but in order to facilitate interpretation of the results we present estimates from models using non-transformed variables and P values from models with transformed variables. Food intakes were also analysed per se and as nutrient densities. For food groups with excessive amount of zeros (defined as <90 % consumers at baseline – that is, >10 % participants having no consumption), the change in proportion of users was analysed using mixed effects logistic regression, and changes in consumption was analysed among those with some consumption using linear mixed models.
For intervention activity data, participation in six group sessions was applied as maximum because not all participants were offered additional sessions, and three meetings was maximum for individual counselling. Overall activity was categorised based on the total amount of sessions regardless of type (range 0–9), with 8–9 categorised as very active, 5–7 as active and <5 as the low activity group. Analyses investigating activity were adjusted for age, education, sex and study centre, and further adjusted for baseline BMI, systolic blood pressure, fasting glucose, LDL-cholesterol and cognition.
Modified intention to treat analysis (mITT) with participants having baseline and at least one follow-up dietary data was conducted. Main analysis (intervention adherence score) was repeated for the whole sample (ITT) and for those with all three food records. Analyses were conducted using Stata for Windows, release 11.3 (StataCorp LP). P<0·05 was considered statistically significant.
Results
Characteristics
Participants were on average 69 years old at baseline and slight majority were men, with no differences in characteristics between the intervention and control groups at baseline (Table 2). Altogether 1055 (83 %) participants had all three food records available, and 1163 (92 %) had baseline and at least one follow-up record and were included in mITT analysis (online Supplementary Fig. Sl). Participants with only one food record (n 97) were more frequently living alone (P=0·021), and had lower intervention adherence score at baseline (P=0·033) compared with mITT population.
Table 2 Characteristics of the participants (Mean values and standard deviations; numbers and percentages)
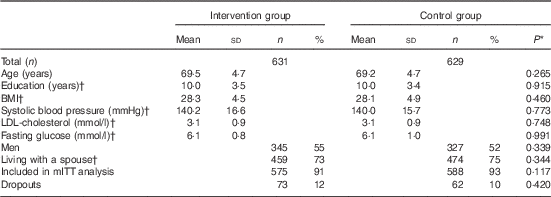
mITT, modified intention to treat analysis.
* P values for difference between the groups from t test (continuous variables) or χ 2-test (categorised variables).
† Missing values for education: 16; BMI: 11; systolic blood pressure: 9, LDL: 5; glucose: 3; and marital status: 7.
Participation in the study and in the intervention
During 2 years, 135 participants (seventy-three in the intervention group) withdrew from this study, of whom twenty returned for retrieval visit at 2 years. In addition, twenty-two discontinued dietary group sessions but remained in other activities. The most common reasons for refusing the group sessions were lack of time or motivation (n 13; 43 %), followed by difficulties in arranging participation (n 5). Most common reasons for withdrawal in the whole study were health-related (n 51; 38 %). There were 114 (4 %) self-reported adverse events or negative experiences during the study, of which ninety-seven were in the intervention group (85 % of the events), with musculoskeletal pain as the most common. None of the adverse effects were specifically related to the dietary counselling.
Participation in individual counselling was good: 84 % (n 528) of the intervention group participated in all three sessions (89 % among those included in mITT). Group sessions were well adopted as well: 51 % (n 321) in at least five (out of the six) group sessions (54 % among mITT). Altogether 100 (15 %) did not attend group sessions, and forty-five of these eventually dropped out of the study. One participant refused to attend any intervention sessions. For overall participation among the mITT population, 54 % (n 308) were categorised as very active with eight sessions or more, 26 % (n 149) as active with six to seven sessions and 21 % (n 118) as the low activity group with zero to five sessions. Activity status was not associated with baseline characteristics (data not shown).
Intervention adherence score
The intervention adherence score, the main outcome, was composed of nine distinct goals to reflect the overall success of the intervention. The mean adherence score increased in the intervention group over time, with a difference in change compared with the control group (Fig. 2(a)), and results remained unchanged when the whole sample (ITT) was included and when only those with all three food records were included (data not shown). The most commonly achieved goals at baseline were the protein and alcohol intake goals (85 and 86 % at baseline, respectively), whereas the most difficult to achieve was the SFA goal (19 %) (online Supplementary Table S2).
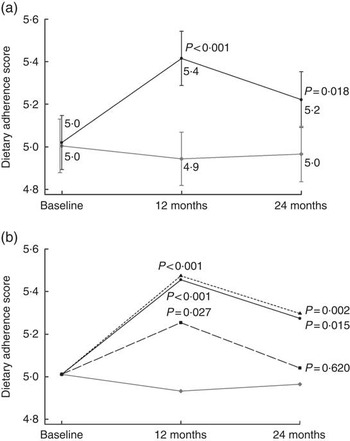
Fig. 2 Intervention adherence score in relation to (a) intervention allocation (estimated mean from a mixed model) and (b) intervention participation activity (estimated mean from a mixed model adjusting for baseline age, education in years, marital status, sex and study centre). P values indicate difference in change compared with the control group. a: ![]() , Intervention group (n 575);
, Intervention group (n 575); ![]() , control group (n 588);
, control group (n 588); ![]() , 95 % CI; b:
, 95 % CI; b: ![]() , intervention group, 8 sessions or more (n 308);
, intervention group, 8 sessions or more (n 308); ![]() , intervention group, 5–7 sessions (n 149);
, intervention group, 5–7 sessions (n 149); ![]() , intervention group, 0–4 sessions (n 118);
, intervention group, 0–4 sessions (n 118); ![]() , control group (n 588).
, control group (n 588).
Active participation in the intervention sessions did not predict higher adherence score within the intervention group (compared with low activity at the 1st year P=0·43 for active and P=0·41 for very active; and at the 2nd year, P= 0·15 and 0·16, respectively). Compared with the control group both the very active and the active group had higher scores throughout the study, and even the low activity group after the 1st year (Fig. 2(b)). Presented estimates are adjusted for age, education, sex, marital status and study centre, and results remained unchanged after further adjustment for baseline BMI, systolic blood pressure, LDL-cholesterol, fasting glucose and cognitive function.
Nutrient intake
The average nutrient intake at baseline met the recommendations except for dietary fibre, vitamin D (excluding supplements), folate and SFA intake. The proportion of participants meeting the recommendation threshold for individual nutrients varied from 17 % (folate) to 99 % (P). Nutrient intakes or food consumption did not differ between the groups at baseline (Tables 3 and 4).
Table 3 Intake and changes in intake of energy and energy-yielding nutrients (Mean values with their standard errors)

E%, proportion of total energy intake.
Statistical significance within groups: * P<0·05, ** P<0·01, *** P<0·001 and exact P values are provided for difference between groups.
† Difference at baseline, difference in change at 1st and 2nd year.
‡ Predicted from a mixed model with untransformed intakes and P values from models with zero-skewness log transformation (modified intention to treat analysis, 575 for intervention and 588 for control).
§ Among those using alcohol, 38 % of the participants at baseline. Median alcohol intake among all participants at baseline was 0.
Table 4 Intake and changes in intake of vitamins and minerals during the intervention (Mean values with their standard errors)
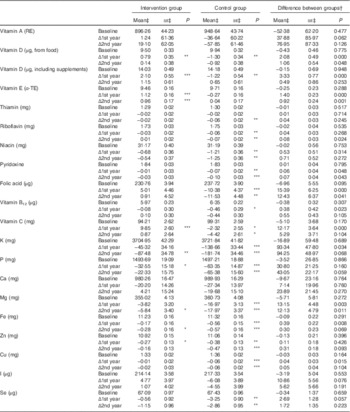
RE, retinol equivalent; α-TE, α-tocopherol equivalent.
Statistical significance within groups: * P<0·05, ** P<0·01, *** P<0·001. Exact P values are provided for between groups.
† Difference at baseline, difference in change at 1st and 2nd year.
‡ Predicted from a mixed model with untransformed intakes and P values from models with zero-skewness log transformation (modified intention to treat analysis, 575 for intervention and 588 for control).
There was a slight decrease in energy intake over time and the proportion of total fat increased equally in both groups. Quality of fat and carbohydrate improved in the intervention group with significant differences in change in SFA, PUFA and fibre throughout the study. Although 85 % (n 1067) met the protein intake recommendation as proportion of energy (10–20 E%), only 21 % (n 262) met the recommendation specific for older adults respective to body weight (1–1·2 g/kg)( 14 ).
There was a difference between the groups in the change in intake of several vitamins and minerals at the 1st year (Table 4), and these differences persisted in vitamin E, dietary vitamin D, folate and Mg at the 2nd year. When analyses were repeated with energy-density variables (g/MJ), intervention effect remains similar. However, trajectories of change over time appeared different when taking energy intake into account: crude intakes of vitamins and minerals decreased during the 2 years among all participants, and the intervention effect was mainly due to less decrease in the intervention group. Energy-adjusted intakes remained unchanged in the intervention group and decreased in the control group (data not shown).
Food consumption
Consumption of selected food groups was analysed focusing on those mentioned in Finnish recommendations and FINGER goals. Table 5 shows difference in favour of the intervention group at both years in changes in consumption of whole-grain cereal (oats, bar and rye) and vegetable fats, and temporary difference at the 1st year in vegetables, red and processed meat, fish and fish products, fruit and berries. Analyses with energy-adjusted consumption (g/MJ) yielded similar results (data not shown).
Table 5 Food consumption and changes in consumption during the intervention (Mean values with their standard errors)
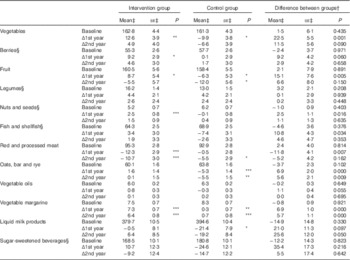
Statistical significance within groups: * P<0·05, ** P<0·01, *** P<0·001. Exact P values are provided for difference between groups.
† Difference at baseline, difference in change at 1st and 2nd year.
‡ Predicted from a mixed model with untransformed intakes and P values from models with zero-skewness log transformation (modified intention to treat analysis , 575 for intervention and 588 for control).
§ For food groups with <90 % consumers at baseline, analyses were carried out among those with some consumption (>0 g). Proportions of consumers (median intake among all participants) at baseline were as follows: berries 83 % (23 g); legumes 65 % (1 g); nuts and seed 46 % (0 g); fish 76 % (33 g); and sugar-sweetened beverages 41 % (0 g).
For food groups that <90 % of all participants consumed at baseline, we further analysed changes in proportion of consumers between groups. The odds for being a fish consumer was lower in the control group after the 1st year compared with the intervention group (OR 0·66; 95 % CI 0·44, 0·99), but no longer after the 2nd year. Consumer profiles of berries, legumes, nuts and seed or sugar-sweetened beverages were unchanged over time and similar between the groups (data not shown).
Discussion
Dietary counselling as a part of a 2-year multi-domain intervention among older adults improves diet measured by a composite score. Furthermore, changes in intakes of several nutrients can be adopted simultaneously in this group of free-living cognitively intact older adults.
To our knowledge, there are no previous large-scale dietary counselling interventions among older adults. Studies including middle-aged participants report findings in accordance with ours regarding multiple, simultaneous changes. A 6-month Dietary Approaches to Stop Hypertension (DASH) – intervention improved intake of several macro and micronutrients; this was observed also after 18 months of follow-up( Reference Elmer, Obarzanek and Vollmer 18 ) and was also associated with better compliance to dietary reference intakes( Reference Lin, Appel and Funk 19 ). An intervention using MeDi with olive oil or nuts also resulted in improved dietary intakes after 5 years of intervention( Reference Estruch, Ros and Salas-Salvado 20 ), although only a part of the changes was prone to counselling while nuts and olive oil were provided by the study. A recent review comprising smaller-scale lifestyle interventions concluded that interventions among elderly participants are usually effective( Reference Lara, Hobbs and Moynihan 21 ), but these trials have focused on one food or nutrient instead of whole diet.
Average baseline nutrient intakes in our study were similar to those reported in Finnish population surveys( Reference Helldán, Raulio and Kosola 22 ), and, in general, dietary recommendations were met, except for folate, vitamin D, fibre and SFA intakes. After the 1st year, most of the nutrient intakes and amounts food consumed improved in the intervention group, but some changes were attenuated during the 2nd year. Changes that persisted were the use of vegetable margarine and whole-grain cereal, and consequently the intakes of riboflavin, pyridoxine, folate, Mg, vitamin E and dietary fibre, for which cereal products and vegetable fats are important sources in Finnish diet(22). One previous study has reported that changes in fat intake were easier to maintain than those in fruit and vegetable intake( Reference Lapointe, Weisnagel and Provencher 23 ). Fat and fibre intake changes were also well sustained in the Finnish diabetes prevention trial( Reference Lindstrom, Peltonen and Eriksson 24 ). Populations in these trials were younger than in the FINGER, indicating that trajectories of change appear similar in different age groups.
Energy intake decreased in both groups, which could be expected with increasing age, but non-linear change after the 1st year suggests other explanations such as weight loss attempts and less precision in food recording. Weight loss was discussed in the intervention, and BMI decreased in both groups( Reference Ngandu, Lehtisalo and Solomon 6 ). Analyses with and without energy-adjustment provided similar results, suggesting that the intervention group adopted changes both in quality and quantity.
For foods not eaten on a daily basis, it appears more difficult to change the pattern of consuming v. not consuming, than to improve the amounts consumed. We reported changes in amounts of several foods, but the proportion of consumers remained mainly unchanged. In future interventions, persuading people to consume new food groups should be more emphasised in order to enhance dietary diversity, which has also been associated with clinical outcomes such as reduced mortality( Reference Kant, Schatzkin and Graubard 25 ).
Analysis of process data revealed that in the intervention group even the group with lowest activity improved their adherence score more than the control group at the 1st year, indicating that a few visits may lead to short-term changes. More active participation was still needed in order to maintain a higher score at the 2nd year, although we found no difference between the medium- and high-activity groups and the optimal amount of sessions remain unclear. Almost all participants attended individual sessions, meaning our overall attendance reflects mainly participation in group sessions.
We presented a composite adherence score, which combines the main dietary goals of our intervention, and consequently reflects adherence to Finnish recommendations. At baseline, on average, half of the goals were achieved indicating relatively low adherence to dietary goals. The score increased in the intervention group, but the actual average difference between the groups was <1 point. Dietary changes through counselling are typically rather small – for example, 1·4–1·8 point increases on a 14-item MeDi-scale were reported in an intervention study with a remarkable effect on CVD incidence( Reference Estruch, Ros and Salas-Salvado 20 ). Moreover, modest changes may be influential in long term if they are permanent, especially when changes in several dietary factors are adopted simultaneously.
Concept of dietary index or score has been exploited widely and there are several versions of such indices. MeDi indices with multiple versions( Reference Davis, Bryan and Hodgson 26 ) are the most popular, followed by the DASH( Reference Kwan, Wong and Wang 27 ) and several others. Adherence to these scores has been inversely associated with several chronic diseases including dementia and cognitive decline in prospective studies( Reference Tangney 28 ), as well as in a controlled setting( Reference Valls-Pedret, Sala-Vila and Serra-Mir 29 , Reference Smith, Blumenthal and Babyak 30 ). Nordic versions such as Baltic Sea Diet Score( Reference Kanerva, Kaartinen and Schwab 31 ) and New Nordic Diet( Reference Hillesund, Bere and Haugen 32 ) have been introduced. All of these have been developed for younger age groups. Further, an elderly-specific index has been proposed previously( Reference Kourlaba, Polychronopoulos and Zampelas 33 ), and, more recently, concept of MIND diet and score( Reference Morris, Tangney and Wang 34 ) was developed primary for prevention cognitive decline. Most of these indices are developed using FFQ, and scoring is based on the distribution of the population studied (i.e. tertiles or quartiles). As we had pre-defined goals for our intervention, we formulated a score that measures these goals rather than utilising any of the previous scores. Similar indices to assess adherence to dietary recommendations have been introduced both in Finland( Reference Kanerva, Kaartinen and Ovaskainen 35 ) and in Sweden( Reference Drake, Gullberg and Ericson 36 ) in observational studies. Compared with the most common MeDi scores, these have more emphasis on nutrients and not only on food intake, although the reasoning behind the subscores is similar (e.g. dietary fibre v. whole-grain cereal). The relative superiority of these indices remains unclear, but they are also correlated with each another and may yield similar results in same population( Reference Liese, Krebs-Smith and Subar 37 , Reference Cespedes, Hu and Tinker 38 ).
Our dietary adherence score was constructed based on the intervention goals, but with small modifications due to methodological issues. First, salt intake, although an important risk factor, had to be excluded because the data were not considered reliable. Moreover, previously dietary salt intake has been excluded from indices due to methodological issues( Reference Drake, Gullberg and Ericson 36 ). Second, our food composition database does not allow the distinction between natural and added or refined sugar. Intake of sucrose (both from natural sources and added sucrose) was chosen as a surrogate measure, as has been done previously( Reference Helldán, Raulio and Kosola 22 , Reference Kaartinen, Knekt and Kanerva 39 ). Third, with a 3-d food record it is not possible to assess fish intake in portions per week, and we categorised participants based on the fish consumption during the 3 d as fish users and non-users. Having one portion of fish during 3 d would roughly be comparable to the recommended two portions per week. Finally, distinction between whole and refined grain was not possible, and dietary fibre was chosen as a surrogate for quality of cereal consumed. These modifications to the adherence score were not pre-specified but executed due to practical reasons.
Disadvantage of a score composed of binary variables is that it categorises people roughly: especially in longitudinal setting, participants may have a substantial increase or decrease in individual components and still not cross the threshold set for goal achievement (e.g. SFA in this study), or some goals are met already in the beginning but changes in the actual levels may still have further health benefits (e.g. PUFA). Continuous scoring system( Reference Jankovic, Geelen and Streppel 40 ) or quintile-based scoring( Reference Drake, Gullberg and Sonestedt 41 ) have been suggested to replace binary scoring for previous indices in order to improve predictability.
This study has several strengths, including population-driven sample, relatively large population, detailed data collection, good adherence to intervention visits and low dropout rate, but some limitations need to be addressed. 3-d food record is not ideal for foods not eaten on a daily basis (e.g. fish), but compared with FFQ it is more sensitive in detecting changes in diet(42). It is well recognised that food records are likely to cause underestimation of food intake in general, whereas FFQ tends to overestimate consumption( Reference Talegawkar, Tanaka and Maras 43 ). Participation in an intervention study may also have an effect on food recording. Despite the detailed data, we were not able to analyse all goals exactly as they were set, but were using surrogate measures for added sugars and whole-grain cereal, and excluded salt intake from our analysis. Furthermore, a new recommendation that doubled the amount of vitamin D fortification in milk products and fat spreads was launched in Finland in 2010 and was widely adopted by the food companies( Reference Itkonen 44 ). Values in our food database represent the level in 2009, and hence vitamin D intake from food is most likely underestimated at the end of the study. Intake of vitamin D from food increased almost 40 % between 2007 and 2012 in respective age group( Reference Helldán, Raulio and Kosola 22 ). There was no difference in total fat spread consumption or liquid milk product consumption between the groups, and the fortification has most likely raised intake in both groups.
Some of our participants were still involved in working life, but most of them were retired. Retirement is a special period in life when people in general undergo major changes in their daily routines and activities. Dietary interventions around retirement age are effective in promoting beneficial lifestyle changes( Reference Lara, Hobbs and Moynihan 21 ), and it could be a favourable period for a lifestyle intervention in general. Despite the ‘mini-intervention’ provided to all participants, there were indications of worsening quality of diet in the control group. Quality of diet becomes even more important when energy intakes decline and nutrient intakes tend to decline consequently( Reference Bales, Locher and Saltzman 5 ). Reductions in muscle mass, bone density, immune function and absorption of some nutrients may make it harder to meet nutrition requirements among older people( Reference Bernstein and Munoz 45 ), and supporting healthy ageing by dietary means should be addressed more among free-living older adults. If well-targeted, relatively simple interventions such as the FINGER dietary intervention can have a large impact on ageing process. Furthermore, intervention was well-liked, and participating in group activities may also provide important social activity among retired participants with even further benefits for health, and can contribute to improved quality of life( Reference Strandberg, Levälahti and Ngandu 46 ).
Inadequate diet and nutrition might represent a relevant, modifiable risk factor for functional decline and the transition to disability and frailty( Reference Inzitari, Doets and Bartali 47 ). As many previous studies have focused on single foods or nutrients, whole-diet approaches and, furthermore, multi-domain approaches should be emphasised among older adults. It is increasingly recognised that interventions targeting more than one risk factor may be an effective and efficient way of improving people’s lifestyles( Reference King, Meader and Wright 48 ). Dietary intervention with whole-diet approach can be seen as a multiple intervention per se, and in our study it was combined with other lifestyles in order to promote healthy ageing from many perspectives. Home-dwelling older adults compose a heterogenous group that requires individualised interventions, but based on our experience they are generally able to improve their lifestyle and health independently if only facilitated by counselling. This could postpone their need for health care services.
Conclusions
FINGER dietary intervention shows that several aspects of diet can be changed simultaneously among older adults, also as a part of a multi-domain intervention, which itself is challenging for participants. Even though the changes are greater after the counselling period, they persist to some extent at least 2 years. It appears that the changes in dietary fat quality and cereal products consumption are easier to maintain than those in fish, berry or vegetable consumption. This should be better emphasised in future trials among older adults.
We also detected signs of worsening diet quality in our control group, despite active participation and mini-intervention. This possibly age-related phenomenon could be targeted by interventions in order to support healthy ageing and maintain functional abilities. With well-targeted, individualised counselling relatively few intervention sessions may be enough to have beneficial effect.
Acknowledgements
The authors sincerely thank all participants of the FINGER study. The authors would also like to express the gratitude to the staff of the study, especially the nutritionists for their contribution to the present paper: Marja-Leena Aho, Suvi Haukioja, Sarianna Miettinen, Merja Paturi, Leena Putkonen, Noora Rajamäki and Lotta Salo. Furthermore, the authors want to thank Jemina Kivelä, Emilia Kotilahti, Heidi Poikonen and Essi Skaffari for their contribution with food record data; Esko Levälahti for assistance in statistical matters; and all other members of the FINGER study group for their cooperation in data collection and management.
The FINGER trial was supported by Academy of Finland (grant nos 129395, 129397, 129459, 129421, 129416, 129511, 129401, 259615); La Carita Foundation; Alzheimer’s Association; Alzheimer’s Research and Prevention Foundation; Juho Vainio Foundation; Novo Nordisk Foundation; Finnish Social Insurance Institution; Ministry of Education and Culture; Salama bint Hamdan Al Nahyan Foundation; Axa Research Fund; EVO funding for University Hospitals of Kuopio, Oulu, and Turku and for Seinäjoki Central Hospital and Oulu City Hospital; Swedish Research Council; Swedish Research Council for Health; Working Life and Welfare; and af Jochnick Foundation. The present study was supported by Diabetes Research Foundation; Yrjö Jahnsson Foundation; and Finnish Cultural Foundation. Funders had no role in the design, analysis or writing of this article.
The contributions of the authors were as follows: J. Lehtisalo carried out the data analyses and drafted the manuscript. T. N., T. L., T. S., R. A., H. S., J. T. and M. K. designed; and T. N., J. Lehtisalo and M. K. coordinated the trial. M. K. is the principal investigator of the FINGER study. J. Lindström and J. Lehtisalo designed and supervised the dietary intervention implementation; and J. Lehtisalo and P. V. were in charge of the dietary data collection and management. T. N. and J. Lindström helped in drafting the manuscript. All authors revised the article for intellectual content and approved the final manuscript.
None of the authors has any conflicts of interest to declare.
Supplementary Material
For supplementary material/s referred to in this article, please visit https://doi.org/10.1017/S0007114517001982


