


Introduction
The Japanese islands are located on the east side of the Asian continent and are generally exposed to a cold winter monsoon blowing from the Asian continent during winter. Heat and vapor are carried from the relatively warm sea surface to the atmospheric bottom layer over the Japan Sea, which causes heavy snowfall in the mountainous areas on the Japan Sea side. The Myoko area, including the Makunosawa valley (36°54’N, 138°10’E), is located on the Japan Sea side in the center of the main island of Japan and is one of the heaviest-snowfall areas in Japan (Fig. 1). The annual snow height usually peaks at >4 m in the valley.

Fig. 1. The major direction of snow producing the winter monsoon, and location of the Makunosawa valley, Myoko.
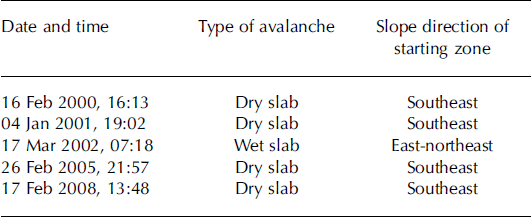
Snow avalanches have often occurred in the Makunosawa valley, making it ideal for studying how meteorological elements influence avalanche activity. Since 2000, five large-scale avalanches with running distances >2000m have been observed: four dry-snow avalanches and one wet-snow avalanche (Table 1). Some characteristics of avalanches in this valley have been observed from the winter seasons of 1999–2011 (Reference Takeuchi, Akiyama and IrasawaTakeuchi and others, 2002, Reference Takeuchi, Yamanoi, Endo, Murakami and Izumi2003, Reference Takeuchi, Torita, Nishimura and Hirashima2011; Reference TakeuchiTakeuchi, 2010). However, no data are available on the snowpack in the starting zone. The large-scale avalanches were released at the head of the valley at ∼1700 m a.s.l. and it was too difficult to approach the starting zones in winter. For this reason, snow-pit observation in the starting zone was not feasible. It is important to know the snow grain shapes of the sliding surface of large-scale avalanches and the process of formation of the weak layer in order to understand the meteorological influence on the mechanisms of avalanche release. Accordingly, in this study, the characteristics of the snowpack in the starting zone of the Makunosawa valley are estimated using a numerical snowpack model. Variations such as stratigraphy and the minimum stability index are produced by the model, and the resulting grain shapes of the sliding surface and its formation process are discussed.
Table 1. Large-scale snow avalanches observed in the Makunosawa valley
Methods
Snowpack estimation
We simulated the vertical profiles of the snow temperature, density and grain shape of the snowpack in the starting zone using the numerical snowpack model SNOWPACK. The SNOWPACK model was developed by Reference Bartelt and LehningBartelt and Lehning (2002) and applied by Reference Lehning, Bartelt, Brown, Fierz and SatyawaliLehning and others (2002a,Reference Lehning, Bartelt, Brown and Fierzb) for the Swiss avalanche warning. Meteorological data (air temperature, relative humidity, precipitation, global radiation, atmospheric radiation and wind speed) are used as input data. The surface energy balance, temperature profile in the snowpack and densification are calculated in the model. The stability index is defined by dividing shear strength by shear stress and is used to estimate the potential for avalanche release. In the SNOWPACK model, shear strength is estimated as a function of snow density and grain shape, using expressions from Reference Jamieson and JohnstonJamieson and Johnston (2001) for depth hoar and Reference Yamanoi and EndoYamanoi and Endo (2002) for rounded grains (Reference Hirashima, Nishimura, Yamaguchi, Sato and LehningHirashima and others, 2008). Shear strength generally rises with increasing snow density. It is supposed to decrease when the rounded grains change to faceted crystals due to the water vapor flux from high to low temperature inside the snowpack. The rapid growth mechanism of faceted crystals (Reference Fukuzawa and AkitayaFukuzawa and Akitaya, 1993) was incorporated into the SNOWPACK model by Reference Hirashima, Nishimura, Baba, Hachikubo and LehningHirashima and others (2004). Moreover, a new parameter (the dry-snow metamorphism or DSM factor) was induced in the expression for shear strength as a function of water vapor transport for continuous changes in shear strength (Reference Hirashima, Abe, Sato and LehningHirashima and others, 2009). After faceted crystals have been buried, the DSM factor decreases under equi-temperature conditions and was parameterized and incorporated into the SNOW-PACK model (Reference Hirashima, Abe and SatoHirashima and others, 2011). Reference Hirashima, Yamaguchi, Sato and LehningHirashima and others (2010) incorporated the new water transport model in SNOWPACK, which then produced an unstable water-saturated layer at the boundary between different grain sizes. In this study we estimate the snowpack using the improved version of the SNOWPACK model.
Among the input meteorological data, air temperature and precipitation were measured at a meteorological station near the runout zone of the avalanches (810 m a.s.l.) since 2005. Data on sunshine duration and wind speed, and air temperature and precipitation before 2005, were obtained from the nearest site (Sekiyama: 350ma.s.l.) of the Automated Meteorological Data Acquisition System (AMeDAS) of the Japanese Meteorological Agency (Fig. 2). Sunshine duration was used to estimate the global and atmospheric radiation for simulation by SNOWPACK. Air temperature was corrected for the starting zone altitude (1700ma.s.l.) considering a lapse rate of 6.5 × 10⁻³°Cm−1. The precipitation was not corrected for the elevation. The slope angle (40°) and direction were input to be the same as those in the starting zone (Fig. 3). The 2002 avalanche started from the east-northeast-facing slope at the head of the valley, while the other four avalanches started from the southeast-facing slope. The reason for this is thought to be that the 2002 avalanche was a wet-snow avalanche triggered by sunshine and snowmelt, while the others started during heavy snowfall.

Fig. 2. Location map. Solid black circles show the positions of the meteorological station and the Sekiyama site of the AMeDAS.

Fig. 3. The starting zone of large-scale avalanches in the Makunosawa valley. North is to the right on the photograph. Photograph taken in January 2010 by Y. Ito.
Snow-pit observation
For validation of the snowpack model simulation, the results were compared with snow-pit observation data for snow deposited naturally. The observations were carried out on the flat area (∼800ma.s.l.) near the runout zone of the avalanches shortly before and after the avalanche in 2000 and shortly after those in 2002 and 2008. The grain shape, grain size, snow density, snow hardness and liquid water content were all measured.
Results and Discussions
Validation of the snowpack model
Before the simulation for snowpack in the avalanche-starting zone, we estimated the snowpack near the runout zone, and the simulation results were compared with the snow-pit observation data. Snow height was considerably underestimated by the simulation for February 2000 (Fig. 4b and d) because the precipitation measured at lower altitude (350ma.s.l.) was used without correction by altitude. As precipitation is generally considered to increase with altitude in mountain regions, correction of precipitation by altitude is necessary to reproduce the real snow height by the SNOWPACK model. In February 2000, faceted crystals were observed in a snow profile (Fig. 4c) taken 2 days (18 February) after the avalanche (16 February) in the runout area at ∼800ma.s.l. This layer could not be found in an earlier profile (Fig. 4a) from 10 February. Similarly, this layer of faceted crystals can be observed in the model results on 18 February (Fig. 4d), but not on 10 February (Fig. 4b).
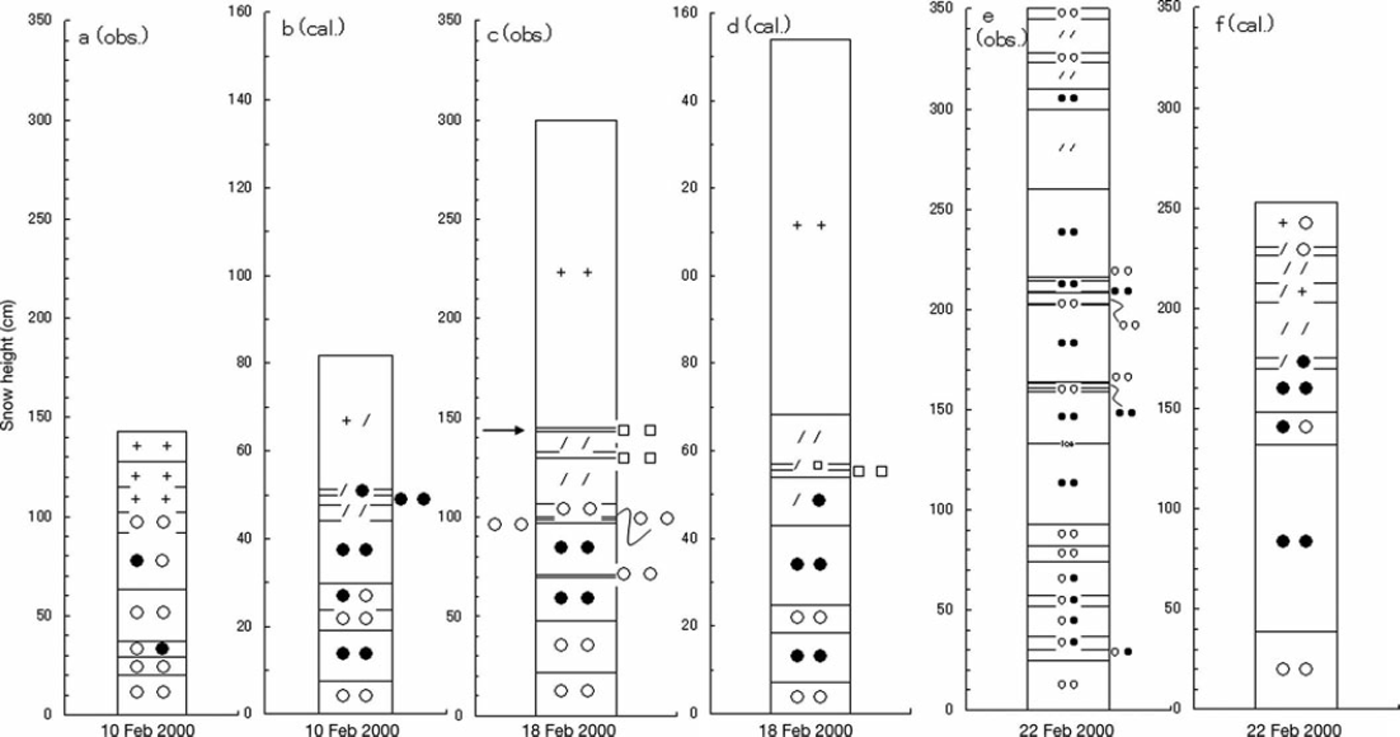
Fig. 4. Comparison of stratigraphy between snow-pit observation and the numerical model simulation. (a) Observation on 10 February 2000; (b) calculation for 10 February 2000; (c) observation on 18 February 2000; (d) calculation for 18 February 2000; (e) observation on 22 February 2008; and (f) calculation for 22 February 2008. +: precipitation particles;/: decomposing and fragmented precipitation particles; solid circles: rounded grains; open circles: melt forms.
In the snow-pit observation of 22 February 2008, the main grain shape of the upper 100 cm was decomposing and fragmented precipitation particles followed by 150cm of rounded grains, while the bottom 100 cm consisted of melt forms. Some thin meltform layers were recognized among the decomposing and fragmented precipitation particles and rounded grain layers, but no weak layer was apparent (Fig. 4e). Similarly, the model results show that the main grain shape of the upper layer was decomposing and fragmented precipitation particles, under which lay thick rounded grains and melt forms at the bottom (Fig. 4f). No weak layer such as faceted crystals was formed by the model, similar to the observation result. The results show reasonable agreement between observations and model results. Only the total snow height of model results is underestimated.
Snowpack estimations in the starting zone of avalanches
The input meteorological data for the simulation on the five avalanches and the calculation results are shown in Figures 5–9. In 2000, after the surface snow had been warmed due to solar radiation and the air temperature increased during the daytime of 12 February, there was snowfall and the air temperature rapidly decreased during the night 12–13 February. Consequently, the temperature gradient in the surface snow layer was estimated to increase and the faceted crystals appeared to be formed under the precipitation particles layer. Because heavy snow had been deposited rapidly from 15 to 16 February, the stability index of the faceted crystals layer, formed on 13 February, was estimated to decrease to 0.7 at the time of avalanche release on 16 February. Accordingly, it was estimated that the faceted crystals layer became the sliding surface of the dry-slab avalanche of 16 February 2000 (Fig. 5).

Fig. 5. Meteorological observations preceding the avalanche on 16 February 2000: (a) air temperature and precipitation and (b) global radiation. Simulation results: (c) temperature gradient of the surface layer, (d) stratigraphy and snow grain shape and (e) minimum stability index (SI). The symbols for the snow grain shapes are the same as in Figure 4. An arrow indicates the time of avalanche release.

Fig. 6. Meteorological observations preceding the avalanche on 4 January 2001: (a) air temperature and precipitation and (b) global radiation. Simulation results: (c) temperature gradient of the surface layer, (d) stratigraphy and snow grain shape and (e) minimum stability index. The legend for snow grain shape is shown in Figure 5d. The symbols for the snow grain shapes are the same as in Figure 4. An arrow indicates the time of avalanche release.

Fig. 7. Same as Figure 6, but for 26 February 2005.

Fig. 8. Same as Figure 6, but for 17 February 2008.

Fig. 9. Same as Figure 6, but for 17 March 2002.
In 2001, a large-scale snow avalanche occurred early in the winter on 4 January. It was estimated that the minimum stability index (1.5) occurred in the thick precipitation particles layer at the time of avalanche release, while no weak snow layers such as faceted crystals were formed in the simulation. According to the meteorological data preceding the avalanche, snowfalls were observed and the snow height increased under low air temperatures from 31 December 2000 to 1 January 2001 and from 2 to 3 January 2001. Intensive snowfall started at about 03:00 on 4 January and total precipitation accumulated to 44mm by 19:00 when the avalanche was released. It is assumed that the stability index in the precipitation particles layer was reduced due to the rapid increase in deposited snow (Fig. 6).
In 2005, the simulation indicates the minimum stability index in the faceted crystals layer. Figure 7 shows little snowfall from 20 to 26 February. The temperature gradient in the surface layer was estimated to be considerable at night due to the daytime solar radiation and night-time radiative cooling. The faceted crystals were assumed to have formed near the surface before the intense snowfall started due to this large temperature gradient. Subsequently, the intense snowfall, which started in the afternoon of 26 February, deposited on the faceted crystals layer and the stability index seemed to decrease to 0.6, representing a highly unstable condition.
In 2008, it was estimated that the surface snow had melted due to solar radiation on 11 February, and faceted crystals formed on the refrozen layer at 2m (Fig. 8). Since new snow was deposited on the faceted crystals layer immediately after, the minimum stability index of the snowpack was estimated to decrease to 0.8, making it highly prone to avalanches. Accordingly, the sliding surface of the avalanche was presumed to be the faceted crystals, which had formed on 13 February and which remained in the snowpack until 17 February.
The 2002 avalanche was the only wet-snow avalanche of the five avalanches considered in this paper. In 2002, the air temperature exceeded 0°C from 14 to 15 March and the upper part of the snowpack was assumed to change to wet melt forms. As shown in Figure 9e, it was estimated that the liquid water content of the snow increased and the stability index of the snow layer, in which the liquid water content peaked throughout the snowpack, decreased simultaneously on 14, 15, 17 and 18 February 2002. In the simulation result, some thin layers of rounded grains with fine grain size remained among the meltform layers with coarse grain size, while infiltrated meltwater seemed to remain in the boundary of the layers with different grain size due to capillary force. The rise in liquid water content seemed to cause a decrease in the shear strength of the snow and a reduced stability index. Therefore, the sliding surface of the wet-snow avalanche was presumed to be wet melt forms.
A snow-pit observation in the runout zone was conducted on 19 March 2002, 2 days after the avalanche release. The stratigraphy, snow hardness and stability index of the observation are shown in Figure 10. Snow hardness was measured using the digital load gauge (push gauge with diameter 15.30 mm). The stability index representing the 408 slope in the starting zone was estimated from the snow hardness using an empirical formula by Reference Yamanoi, Takeuchi and MurkamiYamanoi and others (2004). The upper 120cm of the snowpack was wet melt forms. Weak melt forms with coarse grain size of 1–2 mm could be recognized at heights of about 230 and 190 cm, and the snow hardness and shear strength of these layers were small. Snow layers with fine grain size of <1.0 mm remained at heights of 230–250cm and 190–225 cm, while weak melt forms with coarse grain size of 1–2mm were seen under the layers of fine grain size. These observation results support those of the simulation, showing that the sliding surface of the avalanche appeared to be the wet melt forms near the boundary of layers of different grain size.
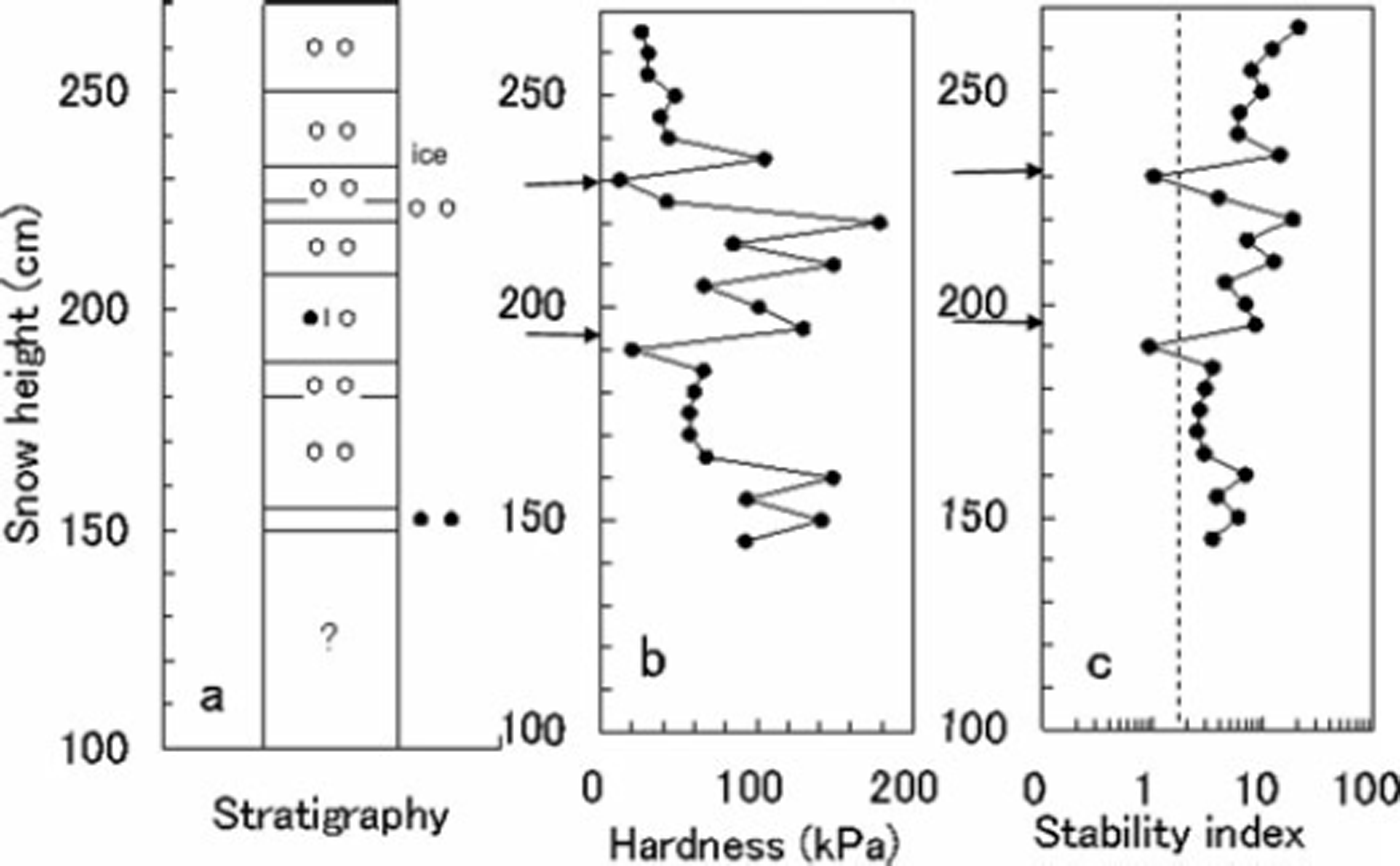
Fig. 10. Snow-pit observation results from 19 March 2002 for naturally deposited snow near the runout zone of the avalanche in the Makunosawa valley: (a) stratigraphy (solid black circles: rounded grains; open circles: melt forms); (b) snow hardness; and (c) stability index.
Conclusions
Three of the four dry-slab avalanches occurred in the middle or at the end of February. Similar meteorological characteristics were seen preceding these three avalanches: solar radiation and higher daytime air temperature with little snowfall and successive rapid decrease in air temperature causing an intensive temperature gradient in the surface layer at night. After the faceted crystals were estimated to form due to the large temperature gradient, heavy snowfall occurred and an avalanche was released. It is considered that the decrease in shear strength due to formation of the faceted crystals is one cause for the avalanche release and that the rapid loading from snowfall is another. Conversely, no layer of weak faceted crystals appeared to have formed before the avalanche released at the beginning of January 2001. The collapse of the layer of precipitation particles due to heavy snowfall was estimated to trigger the dry-slab avalanche. The only wet-snow avalanche observed at the beginning of the melt season in March 2002 was estimated to be caused by a decrease in shear strength due to infiltration of meltwater and increased liquid water content at the boundary of two layers with different grain sizes.
The model results give a reasonable estimate of the snowpack conditions in the avalanche-starting zone. The model results of snow grain shapes of the sliding surface and the formation of the weak layer fit well with the observed weather and the professional experience of avalanche release in the area. However, further work is required. It is recognized that a model producing a weak layer is sometimes coincident with the observed avalanche but quite different from the layer that is actually present at the fracture line. So for future warning of such avalanche events, it will be necessary to obtain observational data at the fracture line of avalanches.
In this study, snow height appeared to be underestimated by the snowpack model. This is most likely caused by using observed precipitation from lower altitudes as input to the model without correction for elevation differences. The correction in precipitation by altitude is necessary to reproduce the snowpack at high altitudes, such as the avalanche-starting zone.


