


Introduction
Oilseed crops are cultivated primarily for edible oils, and the by-products are used for animal diet or added to soil as biofertilizers for crop production. Rapeseed, sunflower and soybean are regularly produced oilseeds in Iran while palm, sunflower and soybean are mainly imported oilseed crops. In recent years, the shortage of vegetable oil has increased considerably, so this lack has been compensated by imports with huge costs (Rostami-Ahmadvandi and Faghihi, Reference Rostami-Ahmadvandi and Faghihi2021). To overcome for the oil shortage problem in Iran, production of oilseed crops could be increased by growing the most favourable cultivars especially in native tolerant oilseed crops to biotic and abiotic stresses. Safflower (Carthamus tinctorius L.) is native to Iran and has been used as an oilseed crop for centuries and with 30–40% oil content, has potential to meet much of oil demand in semi-arid environments. Safflower has an efficient root system that generally penetrates up to a depth of 2.5 m which allows the plant to absorb water and nutrients from deep soil (Kiran et al., Reference Kiran, Mukta, Kadirvel, Alivelu, Senthilvel, Kishore and Varaprasad2017; Sarto et al., Reference Sarto, Bassegio, Rosolem and Sarto2018). Safflower is more tolerant to drought and low temperatures stresses compared to other oilseed crops so in semi-arid environments. For this reason, safflower can be used in rotation with winter cereals and legumes in semi-arid environments. Safflower can be used in many ways, like making vegetable oil and dye for food and industry whereas it has good oil that can aid controlling blood sugar and cholesterol decease (Hassani et al., Reference Hassani, Talebi, Pourdad, Naji and Fayaz2020a). The increasing demand for oil requires development of new safflower cultivars with high performance particularly over harsh districts since safflower is influenced by different constraining stresses (Hassani et al., Reference Hassani, Talebi, Pourdad, Naji and Fayaz2020b). In spite of its relative tolerance, drought is an important stress that restricts safflower performance reduced growth rate under these conditions may decrease its final yield performance (Manvelian et al., Reference Manvelian, Weisany, Tahir, Jabbari and Diyanat2021). Drought stress reduces crop potential to perform reliable yield performance but cultivars which show good transpiration efficiency, are more adaptable and provide acceptable yield performance even under drought stress (Manikanta et al., Reference Manikanta, Pasala, Kaliamoorthy, Basavaraj, Pandey, Vadlamudi, Nidamarty, Guhey and Kadirvel2023).
Majidi and Zadhoush (Reference Majidi and Zadhoush2014) previously utilized multivariate analysis to assess genetic variation based on the morphological traits of 102 safflower accessions. Their findings, as demonstrated by clustering and principal coordinate analysis, successfully separated accessions based on their species. Baljani et al. (Reference Baljani, Shekari and Sabaghnia2016) studied the genetic variation of 64 Iranian safflower accessions via multivariate methods and found that a greater number of capitula per plant, high biomass, wider diameter of lateral and secondary capitula as well as more harvest index can be used by breeders for generating high-yielding safflower cultivars. Ghanbari et al. (Reference Ghanbari, Soltani-Najafabadi, Abbasi and Bihamta2022) investigated 106 safflower accessions from Germany and showed that safflower focuses more on the number of seeds for the survival instead of focusing on the production of stronger seeds as heavier thousand seed weight. However, there is limited research on safflower evaluation by large number of simple biomarkers like morphological traits on various distinct genotypic groups from different countries, so the main objective of this study was to evaluate the genetic diversity of some Iranian (as one of the safflower origins) and foreign germplasm using multivariate tools and to identify better accessions for maintenance of genetic diversity and refining programs for oil production under rainfed conditions in semi-arid regions to adapt to the problem of climate change and the extent of water shortage.
Materials and methods
Trials
A collection of 100 safflower accessions sourced from various geographic locations was assembled. Seeds were procured from two distinct repositories: (i) Plant Gene Resources of Canada (PGRC) in Saskatchewan, Canada, and (ii) the National Plant Gene Bank of Iran. Online Supplementary Table S1 of Supplementary File provides detailed information, including code, name, and origin, for each safflower accession. Cultivation of accessions sowed in Maragheh, situated at 37°23′29″N; 46°14′30″E, with a yearly average temperature of 13°C and an approximate yearly rainfall of 320 mm. The experimental designs are performed the 2022 and 2023 growing seasons individually, employing a 10 × 10 lattice configuration with two replications Five accessions were lost to pests in the first year so 95 accessions were evaluated in 2022 100 accessions were evaluated in 2023. Each experimental plot, measuring one metre in width and two metres in length, comprised four lines (with 25 cm distance) per accession (about 40 plants per area). Manual hand drill sowing, subsequent thinning, and rainfed cultivation with two supplemental irrigations were employed. Preceding the sowing date, field tillage was conducted, and owing to low organic matter fertility, chemical fertilizers were applied before sowing, including 60, 30, and 20 kg ha−1 for nitrogen, phosphate, and potassium, respectively. Notably, in the inaugural year, five accessions exhibited insufficient growth and were consequently excluded from the dataset.
Traits
Observations were made for various parameters, including days to 50% flowering (DF) and days to maturity (DM). Additionally, from ten randomly selected plants, measurements were taken for plant height (PH), height of the first lateral branch (HFL), height of the first capitulum (HFC), stem diameter (SD), diameter of the lateral capitulum (DLC), diameter of the secondary capitulum (DSC), secondary branches per plant (SBP), lateral branches per plant (LBP), capitula per secondary branches (CSB), capitula per lateral branch (CLB), seeds per lateral capitulum (SLC), seeds per secondary capitulum (SSC), weight of the lateral capitulum (WLC), and weight of the secondary capitulum (WSC). These measurements were collected from ten randomly selected plants which selected with equal chance, adhering to the Safflower Standard Descriptor of the International Board for Plant Genetic Resources (now Bioversity International), FAO. Seed yield (SY) was documented at maturity, adjusted to 12.5% seed moisture, and the thousand-seed weight (TSW) was determined using three random sub-samples from each plot. The ratio of seed yield performance to biological yield was computed as harvest index (HI).
Statistical analysis
Normality distribution was assessed using the Anderson-Darling test, while outliers were visualized with Boxplot. Descriptive statistics, encompassing central tendency indices like mean, and dispersion indices like standard coefficient of variance (CV), were computed for all traits across the two experimental years. To reduce the dimensionality of the dataset and identify underlying patterns among correlated traits, factor analysis based on principal component analysis was employed. Following extraction, the factor loading matrix underwent orthogonal type of rotation (varimax), and the array of communality which representing the magnitude of variance collectively explained by the common factors, was approximated through the large amount of association in each array. To enhance the interpretability of scores, the Varimax rotation method with Kaiser normalization was applied and showed that the index of sampling adequacy stood at 0.78 and 0.75 for the first and second years, respectively; affirming that factor analysis is appropriate for the dataset. For cluster analysis, the means of 20 agro-morphological traits of safflower were utilized. Pair-wise distances between accessions were computed via squared Euclidean distance, and Ward's procedure was employed for cluster formation. The cutting point for cluster analysis was determined using multivariate analysis of variance, with group membership assessed through some multivariate statistics like Wilks' lambda. The analytical tools employed for these procedures included SPSS version 13.0 (Brace et al., Reference Brace, Kemp and Snelgar2006), MS-Excel (Carlberg, Reference Carlberg2014), as well as ggplot2 and factoextra packages of R-3.2.4.
Results
Descriptive statistics
The simple and combined analysis of variance revealed significant main effects of year and accession, and year by accession interaction effect for all measured traits of safflower accessions (detailed results not shown). These findings indicate the presence of substantial variation among safflower accessions. Table 1 provides descriptive statistics for various traits for the first and second years, respectively. In the first year (Table 2), the highest CV values were observed for seeds per secondary capitulum (SSC), number of capitula per plant (NCP), and weight of lateral capitulum (WSC). This was followed by capitula per lateral branch (CLB), seeds per lateral capitulum (SLC), and weight of main capitulum (WLC). Conversely, the lowest CV values were seen for days to 50% flowering (DF) and days to maturity (DM), followed by plant height (PH), diameter of lateral capitulum (DSC), diameter of lateral capitulum (DLC), and thousand-seed weight (TSW). The average seed yield (SY) in the first year was 1197.0 kg ha−1, with a range from 668.2 kg ha−1 (minimum) to 1979.8 kg ha−1 (maximum), indicating a relatively wide range of 1311.6 kg ha−1 and substantial differences among the studied safflower accessions (Table 1). The CV value of SY was moderate, similar to height of first lateral branch (HFL), height of first capitulum (HFC), stem diameter (SD), number of lateral branches per plant (NMB), and harvest index (HI). In the second year, the highest CV values were observed for number of capitula per plant (NCP) and capitula per lateral branch (CLB), followed by number of secondary branches per plant (NSB), capitula per secondary branch (CSB), seeds per lateral capitulum (SLC), seeds per secondary capitulum (SSC), weight of lateral capitulum (WLC), and weight of secondary capitulum (WSC). The lowest CV values were found for days to 50% flowering (DF), days to maturity (DM), diameter of lateral capitulum (DLC), diameter of secondary capitulum (DSC), and plant height (PH) (Table 1). The other remined traits (HFL, HFC, SD, NLB, TSW, HI, SY) had relatively moderate CV values in the second year (Table 1). The mean yield (SY) was 1189.9 kg ha−1, and ranged from 537.7 kg ha−1 as minimum to 2164.9 kg ha−1, as maximum, so the statistical range was relatively wide (1591.2 kg ha−1) and indicated high differences among safflower accessions in the second year (Table 1). The observed variation among safflower accessions across both years, may indicate relatedness of traits as well as accessions which can used in genetic diversity maintenance in germplasm collections and genetic improvement programs.
Table 1. Descriptive statistics of safflower accessions across years 2022 and 2023
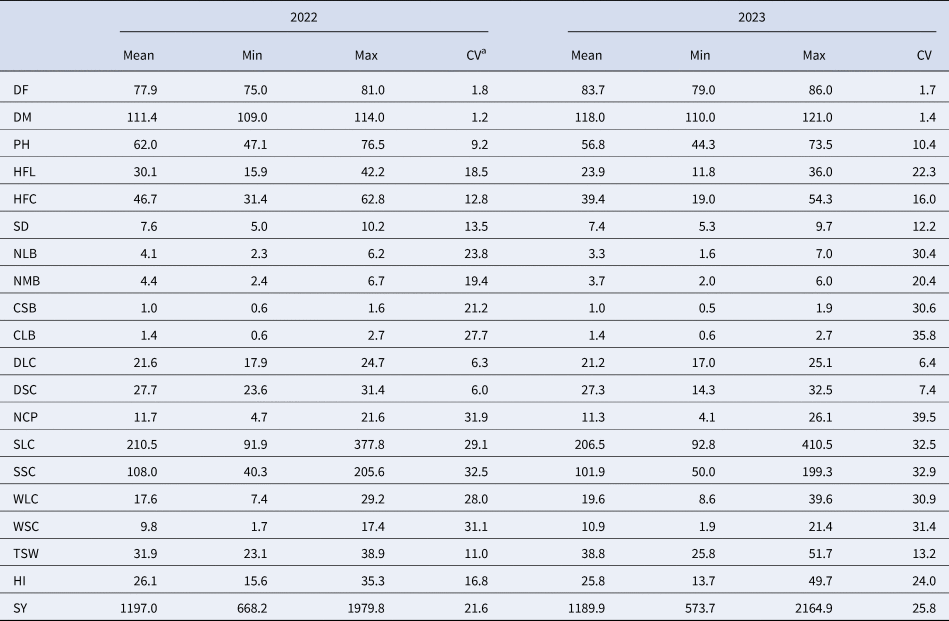
Traits abbreviations are: DF, days to 50% flowering; DM, days to maturity; PH, plant height; HFL, height of first lateral branch; HFC, height of first capitulum; SD, stem diameter; NLB, number of secondary branches per plant; NMB, number of lateral branches per plant; CSB, capitula per secondary branches; CLB, capitula per lateral branch; DLC, diameter of lateral capitulum; DSC, diameter of secondary capitulum; NCP, number of capitula per plant; SLC, seeds per lateral capitulum; SSC, seeds per secondary capitulum; WLC, weight of lateral capitulum; WSC, weight of secondary capitulum; TSW, thousand-seed weight; HI, harvest index and SY, seed yield.
a CV, Coefficient of variation.
Table 2. Factor analysis for morphological traits in safflower accessions during 2022 and 2023
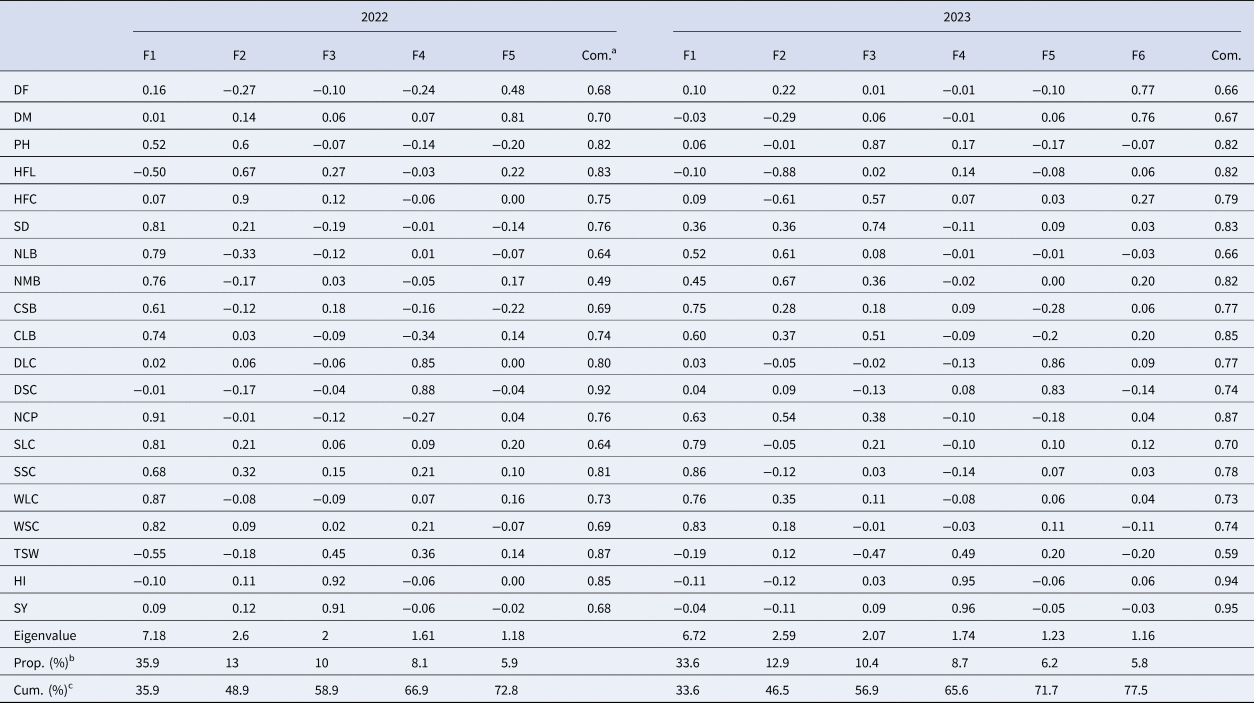
Traits abbreviations are: DF, days to 50% flowering; DM, days to maturity; PH, plant height; HFL, height of first lateral branch; HFC, height of first capitulum; SD, stem diameter; NLB, number of secondary branches per plant; NMB, number of lateral branches per plant; CSB, capitula per secondary branches; CLB, capitula per lateral branch; DLC, diameter of lateral capitulum; DSC, diameter of secondary capitulum; NCP, number of capitula per plant; SLC, seeds per lateral capitulum; SSC, seeds per secondary capitulum; WLC, weight of lateral capitulum; WSC, weight of secondary capitulum; TSW, thousand-seed weight; HI, harvest index and SY, seed yield.
a Communality.
b Proportion.
c Cumulative (%).
Factor analysis
For the magnitude of communalities in the first year (Table 2), it can be concluded that the most proportion of each trait's variability that can be described by the extracted factors. The first Factor (F1) accounted for maximum variation (about 36%) and it was related to some properties of capitula, seeds and branches, whereas it was related to NLB and NSB (number of branches), CSB, CLB and NCP (number of capitula), SLC and SSC (number of seeds), WLC and WSC (weight of capitula), and stem diameter (SD) (Table 2). These traits are the yield contributing traits, suggesting that this factor can aptly be designated as the ‘yield components factor.’ The second factor (F2) explained 13% of the observed variation and associated with plant height, such as PH, HFL, and HFC (Table 2), so F2 can be appropriately labelled as the ‘height factor.’ In the third factor (F3), which accounted for 10% of the total variation, three pivotal traits; SY, TSW, and HI, demonstrated high scores. Consequently, this factor can be denoted as the ‘yield performance factor.’ The fourth factor (F4), contributing about 8% to the variability, showed a positive association with the diameter of lateral and secondary capitula (DLC and DSC) in the first year (Table 3). Hence, this factor can be termed the ‘capitulum diameter factor.’ The fifth factor (F5), accounting for approximately 5% of the total variance, displayed high scores for phenological traits, specifically days to 50% flowering (DF) and days to maturity (DM) in the first year (Table 3). Consequently, this factor can be aptly named the ‘phenological factor.’
Table 3. Mean values for clusters based on morphological traits of safflower accessions during 2022 and 2023
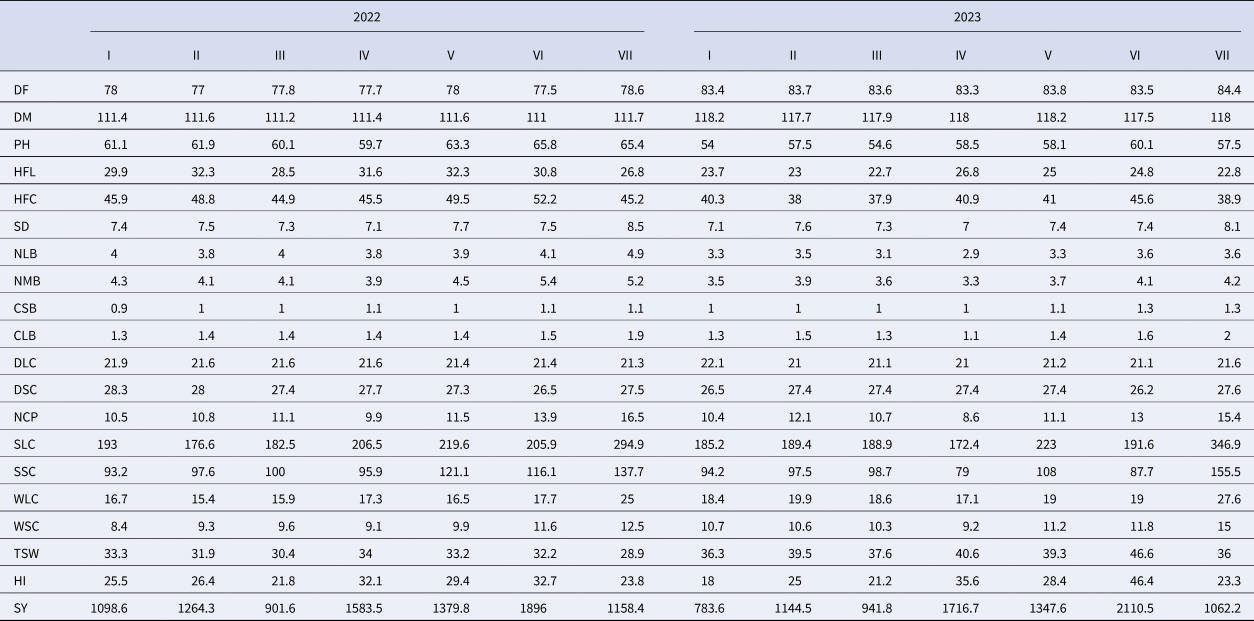
Traits abbreviations are: DF, days to 50% flowering; DM, days to maturity; PH, plant height; HFL, height of first lateral branch; HFC, height of first capitulum; SD, stem diameter; NLB, number of secondary branches per plant; NMB, number of lateral branches per plant; CSB, capitula per secondary branches; CLB, capitula per lateral branch; DLC, diameter of lateral capitulum; DSC, diameter of secondary capitulum; NCP, number of capitula per plant; SLC, seeds per lateral capitulum; SSC, seeds per secondary capitulum; WLC, weight of lateral capitulum; WSC, weight of secondary capitulum; TSW, thousand-seed weight; HI, harvest index and SY, seed yield.
In the second year, the magnitudes of communalities (Table 2) were notably high and generally acceptable for most traits. In this year, the safflower traits are grouped into six main components which the first factor (F1) accounted for about 34% of the observed variability; the second factor (F2) for about 13%; the third factor (F3) for about 10%; the fourth factor (F4) for about 9%; the fifth factor (F5) for about 6%; and the sixth factor (F6) for 6% of the observed variability (Table 2). The F1 of the second year was relatively similar to the F1of the first year, whereas it was related to number of capitula (CSB, CLB and NCP), number of seeds (SLC and SLC), and weight of capitula (WLC and WSC) while it had not high scores for NLB and NSB (number of branches), and stem diameter (SD). Regarding contribution of these traits to safflower yield components, similar to the last year, F1 can be named as yield component factor. The second Factor (F2) contributed more positively to the NLB and NSB (number of branches), in the second year (Table 2), suggesting it can be named as branches factor. The third Factor (F3) indicated high scores in the height related traits like PH and HFC as well as stem diameter (SD), in the second year (Table 2), showing that it can be named as height factor. Similar to the first year, three important traits (SY, TSW and HI) showed large positive scores in the fourth Factor (F4), so this factor can be named as yield performance factor. Like to the last year, the diameter of lateral and secondary capitula (DLC and DSC) had high scores in the fifth Factor (F5) (Table 2), suggesting that it can be named as capitulum diameter. Similar to first year, phenological traits (DF and DM) indicated large positive scores in the sixth Factor (F6), so this factor can be named as phonologic factor (Table 2).
Cluster analysis
Safflower accessions were divided into seven main clusters in both experimental years according to cluster analysis (Figs 1 and 2). In the first year, Cluster-I is comprised of 22 accessions and some important features of these accessions were late flowering (78 days), thicker DLC (21.9 mm for diameter of lateral capitulum), thicker DSC (28.3 mm for diameter of secondary capitulum), and weighted TSW (33.3 g for thousand-seed weight) (Table 3). Contribution of Cluster-II was eight accessions which indicated late maturity (about 117 days), higher HFL (32.3 cm height of first lateral branch), and thicker DSC (28.3 mm). Cluster-III decorated by 21 accessions with lowest or moderate values for the measured traits, thus these accessions cannot be considered for yield and its components breeding projects. Contribution of Cluster-IV was eight accessions which indicated higher HFL (31.6 cm), more CSB (1.1 capitula per secondary branches), thicker DSC (27.7 mm), weighted TSW (34.0 g), more harvest index (32.1%), and more seed yield performance (1583.5 kg ha−1). In the first year, Cluster-V is comprised of 21 accessions and some important features of these accessions were late flowering (78 days), late maturing (about 112 days), higher HFL (32.3 cm), weighted TSW (33.2 g), and more seed yield (1379.8 kg ha−1) (Table 3). Cluster VI was the shorter one decorated by only two accessions and they were tall plants (65.5 cm) with tall first lateral branch (30.8 cm) as well as tall first capitulum (52.2 cm), also, these accessions had more lateral branches (NMB = 5.4), more capitula per secondary branches (CSB = 1.1), weighted secondary capitula (11.6 g), more harvest index (32.7%), and more seed yield (1896.0 kg ha−1). Finally, the seventh cluster of the first year (Cluster VII), is comprised of 13 accessions while they showed more values for most of the traits except HFL, HFC, DLC, DSC, TSW, HI and SY but they indicated more recorded values for most of yield components (Table 3).

Figure 1. Dendrogram showing the genetic relationship among 95 safflower (Carthamus tinctorius L.) accessions during 2022.
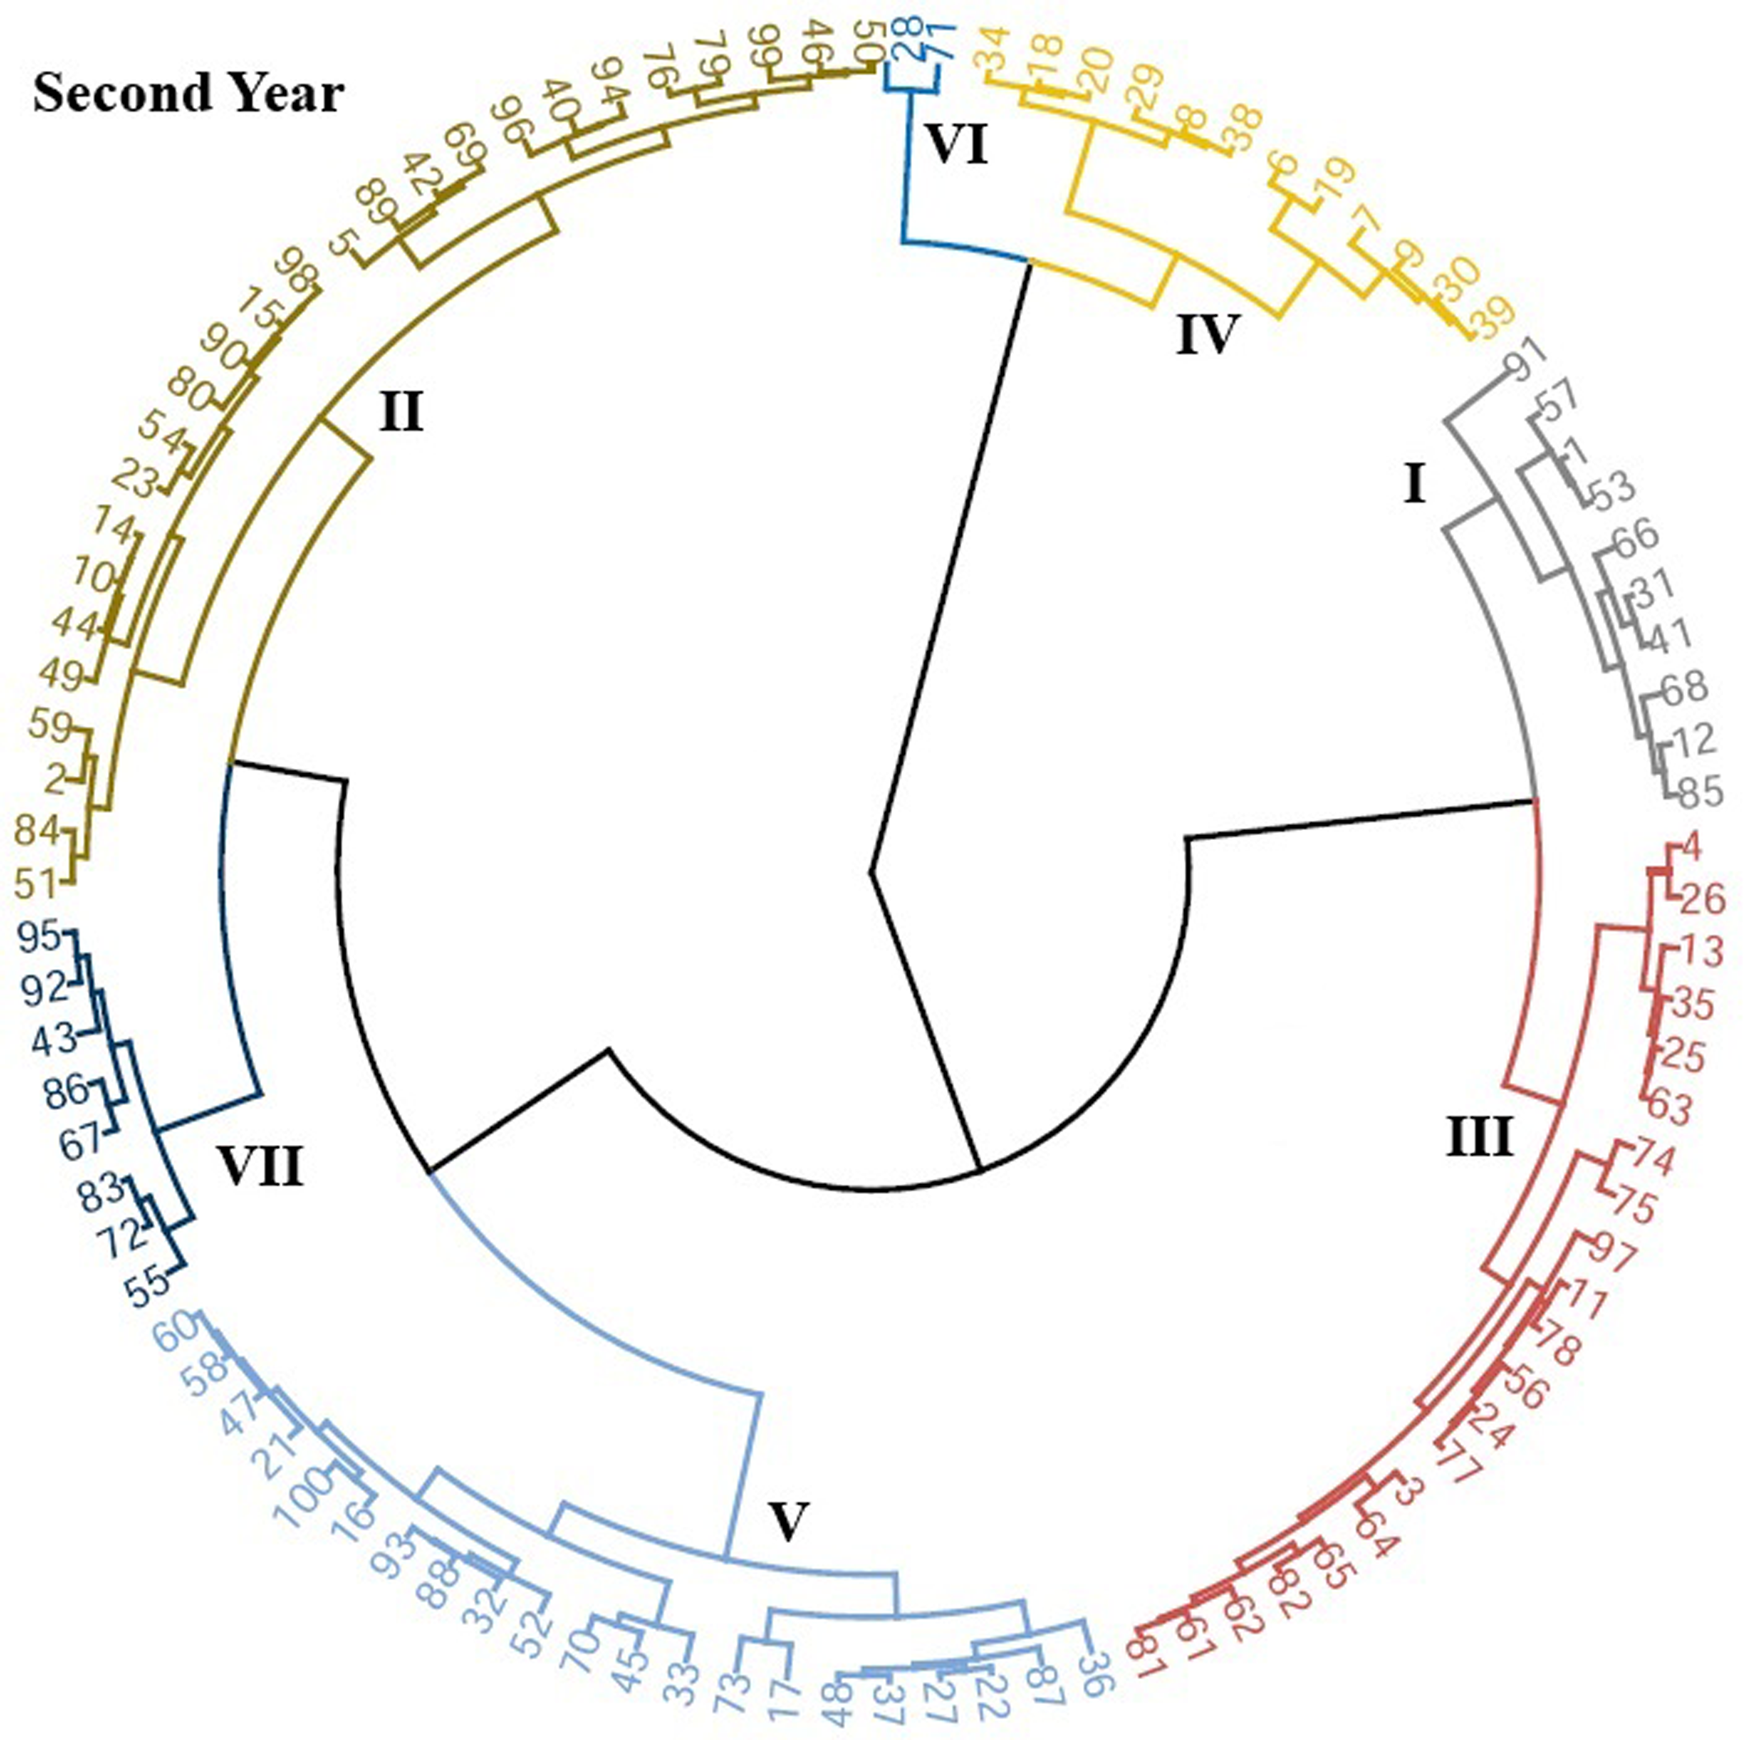
Figure 2. Dendrogram showing the genetic relationship among 100 safflower (Carthamus tinctorius L.) accessions during 2023.
In the second year, Cluster-I is comprised of 10 accessions and the most important characteristic of these accessions were thicker diameter of lateral capitulum, DLC = 22.1 mm (Table 3). Contribution of Cluster-II was 26 accessions which indicated large numbers of NSB (3.5) and NLB (3.9) as well as thicker DSC (27.4 mm). Cluster-III decorated by 21 accessions with lowest values for most of the measured traits except thicker DSC (27.4 mm), thus these accessions cannot be advised for genetic improvement of seed yield and components. Contribution of Cluster-IV was 12 accessions which indicated late maturity (about 118 days), taller plants (PH = 58.5 cm), taller HFL (26.8 cm), and thicker DSC (27.4 mm). In the second year, Cluster-V is comprised of 21 accessions and some important issues of these accessions were late maturity (about 118.2 days), taller plants (PH = 58.1 cm), and thicker DSC (27.4 mm) (Table 3). Similar to the first year, Cluster VI was the shorter one decorated by only two accessions and they were tall plants (60.1 cm) with tall first capitulum (45.6 cm), which had more lateral and secondary branches (NLB = 4.1 and NSB = 3.6), more capitula per secondary branches (CSB = 1.3), more capitula per plant (NCP = 13), weighted TSW (46.6 g), more harvest index (46.4%), and more seed yield (2110.5 kg ha−1). Finally, the seventh cluster of the second year (Cluster VII), is comprised of eight accessions while they showed more values for most of the traits including DF (84.4 days), DM (118 days), SD (8.1 mm), NSB (3.6), NLB (4.2), CSB (1.3), CLB (2), DSC (27.6 mm), NCP (15.4), SLC (346.9), SSC (155.5), WLC (27.6 g) and WSC (15 g), so they indicated more values for most of yield components (Table 3).
Comparison of dendrogram of two years revealed that some accessions were grouped in similar clusters, thus the performance of such accessions were not influenced by genotype by environment interaction. In first cluster (Cluster I), two accessions (1 and 12, IR-00101 and C-46, respectively), in Cluster II, three accessions (2, 14 and 23, IR-00102, Kurdistan-9 and Bregon, respectively), in Cluster III, eleven accessions (3, 4, 25, 26, 61, 62, 63, 64, 77, 78 and 82), and in Cluster IV, seven accessions (6, 7, 9, 18, 19, 20 and 30) were grouped in similar clusters across two experimental years (Figs 1 and 2). Also, in fifth cluster (Cluster V), fourteen accessions (16, 17, 21, 22, 27, 32, 33, 37, 45, 47, 52, 58, 70 and 93), in Cluster VI, two accessions (28 and 71, C-47 and Lesaf-175, respectively), and in Cluster VII, six accessions (67, 72, 83, 86, 92, 95) were grouped in similar clusters across two experimental years (Figs 1 and 2).
Discussion
The present investigation revealed large genetic variation among safflower accessions in both years, which provides a good opportunity for maintenance of genetic diversity in germplasm collections. Computation the magnitude of genetic diversity is the important step involved in variation analysis of various accessions and for achieving this goal, using several multivariate tools was needed to show the findings more clearly (Sabaghnia et al., Reference Sabaghnia, Ahadnezhad and Janmohammdi2015). The identified factors in the first year were as yield components (F1), height (F2), seed yield (F3), capitulum diameter (F4) and phonology (F5); similarly, these five factors were detected in the second year but one factor (number of branches) of the second year was in excess of the first year. We found good agreement in results of both years; thus, the yield components factor with the largest contribution of the total variation, show high potential in yield components of safflower. The other factors including height, yield, capitulum diameter and phonology issues, are the most important reasons of variation and indicate potential of our safflower accessions for improvement of these characteristics. Similarly, Baljani et al. (Reference Baljani, Shekari and Sabaghnia2016) found that number and diameter of capitula as well as seeds of capitulum as the first factor while plant height and biomass as the second factor and seed yield and harvest index as another factor. Thus, it seems that characteristics of capitulum (number and diameter) and plant highest are repeated in most investigations and must be regarded as the most important traits in safflower. When interpreting the results of factor analysis, it is crucial to take into account the associated costs in estimating genetic parameters (Kadirvel et al., Reference Kadirvel, Ravi, Mukta, Montoya-Coronado, Ghuge, Singh and Varaprasad2017; Van Rheenen et al., Reference Van Rheenen, Peyrot, Schork, Lee and Wray2019). The communalities values from the factor analysis in this study highlighted that a majority of safflower traits exhibited high communalities, signifying a substantial contribution to the overall variation. This finding aligns with similar results reported by Ghanbari et al. (Reference Ghanbari, Soltani-Najafabadi, Abbasi and Bihamta2022), where they identified five factors encompassing yield and yield components, plant height, number of seeds, and phenological parameters in their factor analysis of safflower. They emphasized using of physiological concepts for confirmation of factor analysis to increasing power of selection for breeders and showed that the biological control system of the safflower is related to the number of seeds instead of seeds' weight. The convergence in results underscores the consistency and reliability of these identified factors across different studies.
Although, factor analysis is a powerful tool for extracting hidden trends and patterns of dataset but it must be used to recognition of biological systems whose components have multiple relationships in hidden mood (Toledo-Aguilar et al., Reference Toledo-Aguilar, López-Sánchez, López, Aguilar-Rincón, Vaquera-Huerta, Santacruz-Varela, González-Hernández, López-Pérez, Hernández-Galeno and Ramírez-Meraz2023). It seems that, extracted factors can be similar to regions of the genome which have pleiotropic properties. Plants do not have a central nervous system (similar to the animals) to control components and issue centralized biological commands while they cannot be considered as a mass of cells next to each other with different functions. Investigating the physiological passes of plants in different internal and environmental conditions led to the emergence of the hypothesis of the existence of a coordinating system among components, preserving the independence of cells or the concept of plant neuroscience (Ojaq et al., Reference Ojaq, Mozafari, Jabbari and Sani2020; Segundo-Ortin and Calvo, Reference Segundo-Ortin and Calvo2022). Thus, the extracted factors can indicate a part of the internal control system and the coordinator of these components. To confidence the statistical accuracy of factor analysis, the samples should be large so that an accurate and reliable pattern can be extracted. The study, identified seed yield, yield components, plant height, capitulum diameter, and phenological traits as primary factors. This underscores the importance of giving more emphasis to these components in safflower breeding. Focusing on these key factors could lead to more successful breeding programs by targeting and enhancing the traits that significantly contribute to overall safflower performance and yield.
We found 45 accessions had such characteristics which were located in Cluster I (2 accessions), Cluster II (3 accessions), Cluster III (11 accessions), Cluster IV (7 accessions), Cluster V (14 accessions), Cluster VI (2 accessions) and Cluster VII (6 accessions). The two accessions of Cluster VI (no. 28 or C-47 from unknown origin and no. 71 or Lesaf-175 from Canada) had relatively the most stable performance across two years and can be advised for advanced breeding steps. These mentioned accessions from each cluster can be used in the breeding programs to achieve the targets traits, for example, two accessions of Cluster VI (28 and 71, C-47 and Lesaf-175, respectively), can be used for breeding of PH, HFL, HFC, NLB, CSB, WSC, HI and SY traits. Also, these accessions can be released as high yielding cultivars for semiarid and cold upland regions which have climatic conditions of Maragheh, Iran (37°23′26″N 46°14′25″). In other word, most safflower accessions are not as successful as released cultivars maybe due to their low uniformity while these identified accessions (C-47 and Lesaf-175) can be released as after standard evaluation. Also, maintenance of such valuable accessions which show high variability for various target traits of interest can be ideal for gene banks germplasm collections and used for future breeding projects.
In the current study, considerable diversity was observed in the majority of measured traits among safflower accessions, a finding consistent with previous research by Majidi and Zadhoush (Reference Majidi and Zadhoush2014), Baljani et al. (Reference Baljani, Shekari and Sabaghnia2016) and Ebrahimi et al. (Reference Ebrahimi, Sabaghnia, Javanmard and Abbasi2023), who verified the importance of number of capitula per plant and diameter of capitulum. Moreover, our results align with the findings of Gholami et al. (Reference Gholami, Sabaghnia, Nouraein, Shekari and Janmohammadi2018) and Ghanbari et al. (Reference Ghanbari, Soltani-Najafabadi, Abbasi and Bihamta2022), who emphasized the morphological relationships among diverse safflower genotypes and highlighted high genetic diversity in seed yield and yield components. The genetic improvement of safflower is a crucial effort with a time-consuming and costly process which aims to optimize its performance. Thus, it needs exact sketching, implementation, and assessment and to ensure its effectiveness, the reliability and validity of used tools like traits association and selection indices must be demonstrated. Therefore, the validation of our results on some genotypes with the previous reports on the other genotypes enables breeders to decide effectively with more trust. Previous studies have validated the strong correlation between morphologic traits of safflower and its productivity in semi-arid regions (Oarabile et al., Reference Oarabile, Emongor, Oagile and Phuduhudu2016). Finally, for obtaining high yielding safflower cultivars, breeders must focus on the number of seeds per capitulum followed diameter of capitulum instead selecting of higher thousand seed weight. Such strategy was suggested for wheat breeding using increase of number of grains per area because the physiological capacity of grain weight is relatively complete (Slafer et al., Reference Slafer, García, Serrago and Miralles2022). This strategy is useful for obtaining high-yielding cultivars but it cannot predict yield performance to management or genetic improvement efforts because the mechanisms for the interaction among yield components are not understand completely. Overall, our results indicate that yield and yield components of these safflower genotypes were more distinct and can be entered in future breeding programs.
Conclusion
The safflower accessions used in this investigation indicated remarkable diversity using factor analysis and clustering. Identifying accessions with favourable performance in target traits like seed yield is a valuable outcome. These well-performing accessions can be utilized to enrich the existing germplasm, contributing to an overall increase in genetic diversity. This approach is instrumental in mitigating genetic erosion within the safflower population, as the introduction of high-performing accessions enhances the overall genetic pool and provides valuable genetic resources for future breeding programs and research initiatives. Also, accessions with high yield performance were detected, which can be used in future breeding projects. Furthermore, the best selected accessions like C-47 and Lesaf-175 can be entered directly in multi-environmental trials for cultivar release proposes.
Supplementary material
The supplementary material for this article can be found at https://doi.org/10.1017/S1479262124000200
Acknowledgements
The authors are grateful to Plant Gene Resources of Canada (PGRC) in Saskatchewan, Canada, and National Plant Gene Bank of Iran for providing of the safflower accessions. Finally, we would like to thank the two anonymous reviewers and the Editor-in-Chief for their valuable comments to improving this manuscript and language editing.
Authors contributions
Naser Sabaghnia designed, analysed and wrote manuscript, Amin Ahadnezhad performed experiments and measured traits, Mohsen Janmohammdi read and checked manuscript.
Funding statement
This study was supported by the University of Maragheh.
Competing interests
None.
Ethical standards
No human or animals were used in the present research.
Consent for publications
All authors read and approved the final manuscript for publication.
Availability of data and material
All the data are embedded in the manuscript.
Informed consent
The authors declare not to use any patients in this research.


