


Introduction
Peltigera membranacea (Ach.) Nyl. is a cyanolichen distributed on the western side of continents of the Northern Hemisphere. In the boreal ecozone, the species is common and locally abundant. It usually grows on the ground among bryophytes and graminoids in sites with some woody vegetation or in grasslands, on the base of tree trunks or on moss-covered rocks. Peltigera membranacea differs morphologically from other species of Peltigera by its downy, raised veins on the lower surface, its papery-thin thallus, its long, isolated, squarrosely branched rhizines, and by the size of its ascospores (Vitikainen Reference Vitikainen1994; Martinez & Burgaz Reference Martinez and Burgaz1996).
The haploid mycobiont (i.e. the lichen-forming fungus P. membranacea) forms a mutualistic symbiosis with cyanobacterial Nostoc photobionts. Its photobiont strains are closely related to (but not identical with) N. punctiforme (Miao et al. Reference Miao, Rabenau and Lee1997; Gagunashvili & Andrésson Reference Gagunashvili and Andrésson2018). By channeling nitrogen fixed by its cyanobacterial photobiont, P. membranacea is important for ecosystem function in northern ecosystems, where locally it grows in comparatively high abundance.
While the phylogeny and taxonomy of the genus Peltigera is well studied (Miadlikowska & Lutzoni Reference Miadlikowska and Lutzoni2000, Reference Miadlikowska and Lutzoni2004; Miadlikowska et al. Reference Miadlikowska, Lutzoni, Goward, Zoller and Posada2003; O'Brien et al. Reference O'Brien, Miadlikowska and Lutzoni2009; Wedin et al. Reference Wedin, Wiklund, Jørgensen and Ekman2009; Jüriado et al. Reference Jüriado, Kaasalainen and Rikkinen2017, Reference Jüriado, Kaasalainen, Jylhä and Rikkinen2019; Magain et al. Reference Magain, Tniong, Goward, Niu, Goffinet, Sérusiaux, Vitikainen, Lutzoni and Miadlikowska2018), its population subdivision has received little attention to date, partly because of a lack of suitable markers. So far, the development of microsatellites has been reported for 18 species of lichen-forming fungi (Walser et al. Reference Walser, Sperisen, Soliva and Scheidegger2003; Magain et al. Reference Magain, Forrest, Serusiaux and Goffinet2010; Widmer et al. Reference Widmer, Dal Grande, Cornejo and Scheidegger2010; Mansournia et al. Reference Mansournia, Wu, Matsushita and Hogetsu2011; Jones et al. Reference Jones, Green, Hogg and Wilkins2012; Guzow-Krzeminska & Stocker-Wörgötter Reference Guzow-Krzeminska and Stocker-Wörgötter2013; Werth et al. Reference Werth, Cornejo and Scheidegger2013; Alors et al. Reference Alors, Dal Grande, Schmitt, Kraichak, Lumbsch, Crespo and Divakar2014; Belinchón et al. Reference Belinchón, Ellis and Yahr2014; Devkota et al. Reference Devkota, Cornejo, Werth, Chaudhary and Scheidegger2014; Nadyeina et al. Reference Nadyeina, Cornejo, Boluda, Myllys, Rico, Crespo and Scheidegger2014; Tõrra et al. Reference Tõrra, Cornejo, Cheenacharoen, Grande, Marmor and Scheidegger2014; Prieto et al. Reference Prieto, Romera, Merinero, Aragón and Martínez2015; Lutsak et al. Reference Lutsak, Fernández-Mendoza, Greshake, Dal Grande, Ebersberger, Ott and Printzen2016; Lagostina et al. Reference Lagostina, Dal Grande, Ott and Printzen2017).
Peltigera membranacea lacks specialized small vegetative propagules and, in our study area, thalli with apothecia do occur but are uncommon. Clonal spread through thallus fragments should thus be its predominant dispersal mode, and it has been shown that thallus fragments disperse over very short distances (Dettki Reference Dettki1998; Heinken Reference Heinken1999), relative to other propagule types. If dispersal by short-reaching thallus fragments predominated in P. membranacea, we would expect substantial genetic differentiation between sampling sites. However, populations of P. membranacea are often large, implying that it would take an extended time period before differentiation could be observed between populations. The mycobiont could also disperse via microscopic ascospores and associate with local cyanobionts in new sites. Establishment of new individuals from ascospores would uncouple fungal and cyanobacterial genetic structures and could involve much larger distances, which could lead to low genetic differentiation. For example, ascospores reached on average two orders of magnitude further than symbiotic propagules of Lobaria pulmonaria (Ronnås et al. Reference Ronnås, Werth, Ovaskainen, Várkonyi, Scheidegger and Snäll2017). Here, we report 20 new microsatellites for the lichen-forming fungus P. membranacea to enable studies of population subdivision in this widespread terricolous species and 14 simple sequence repeat markers for its Nostoc photobiont. We also report an assay based on the ITS region to check the species identity of P. membranacea against two of its morphologically similar congeners, P. canina and P. praetextata.
Materials and Methods
Study area and sampling
A total of 122 thalli of P. membranacea were collected from four sites in western Iceland (Fig. 1). We contrasted a coastal site (HF6: 64.34421°N, 22.01367°W, 3 m a.s.l.) with three sites located further inland (LA1: 64.21237°N, 20.85986°W, 184 m a.s.l.; LL1: 64.16659°N, 19.15357°W, 500 m a.s.l.; LL3: 64.12108°N, 19.78241°W, 285 m a.s.l.). We collected thalli while walking along a transect through the population, leaving at least 2 m between adjacent samples. The thalli were air-dried and stored at −20 °C until DNA extraction.
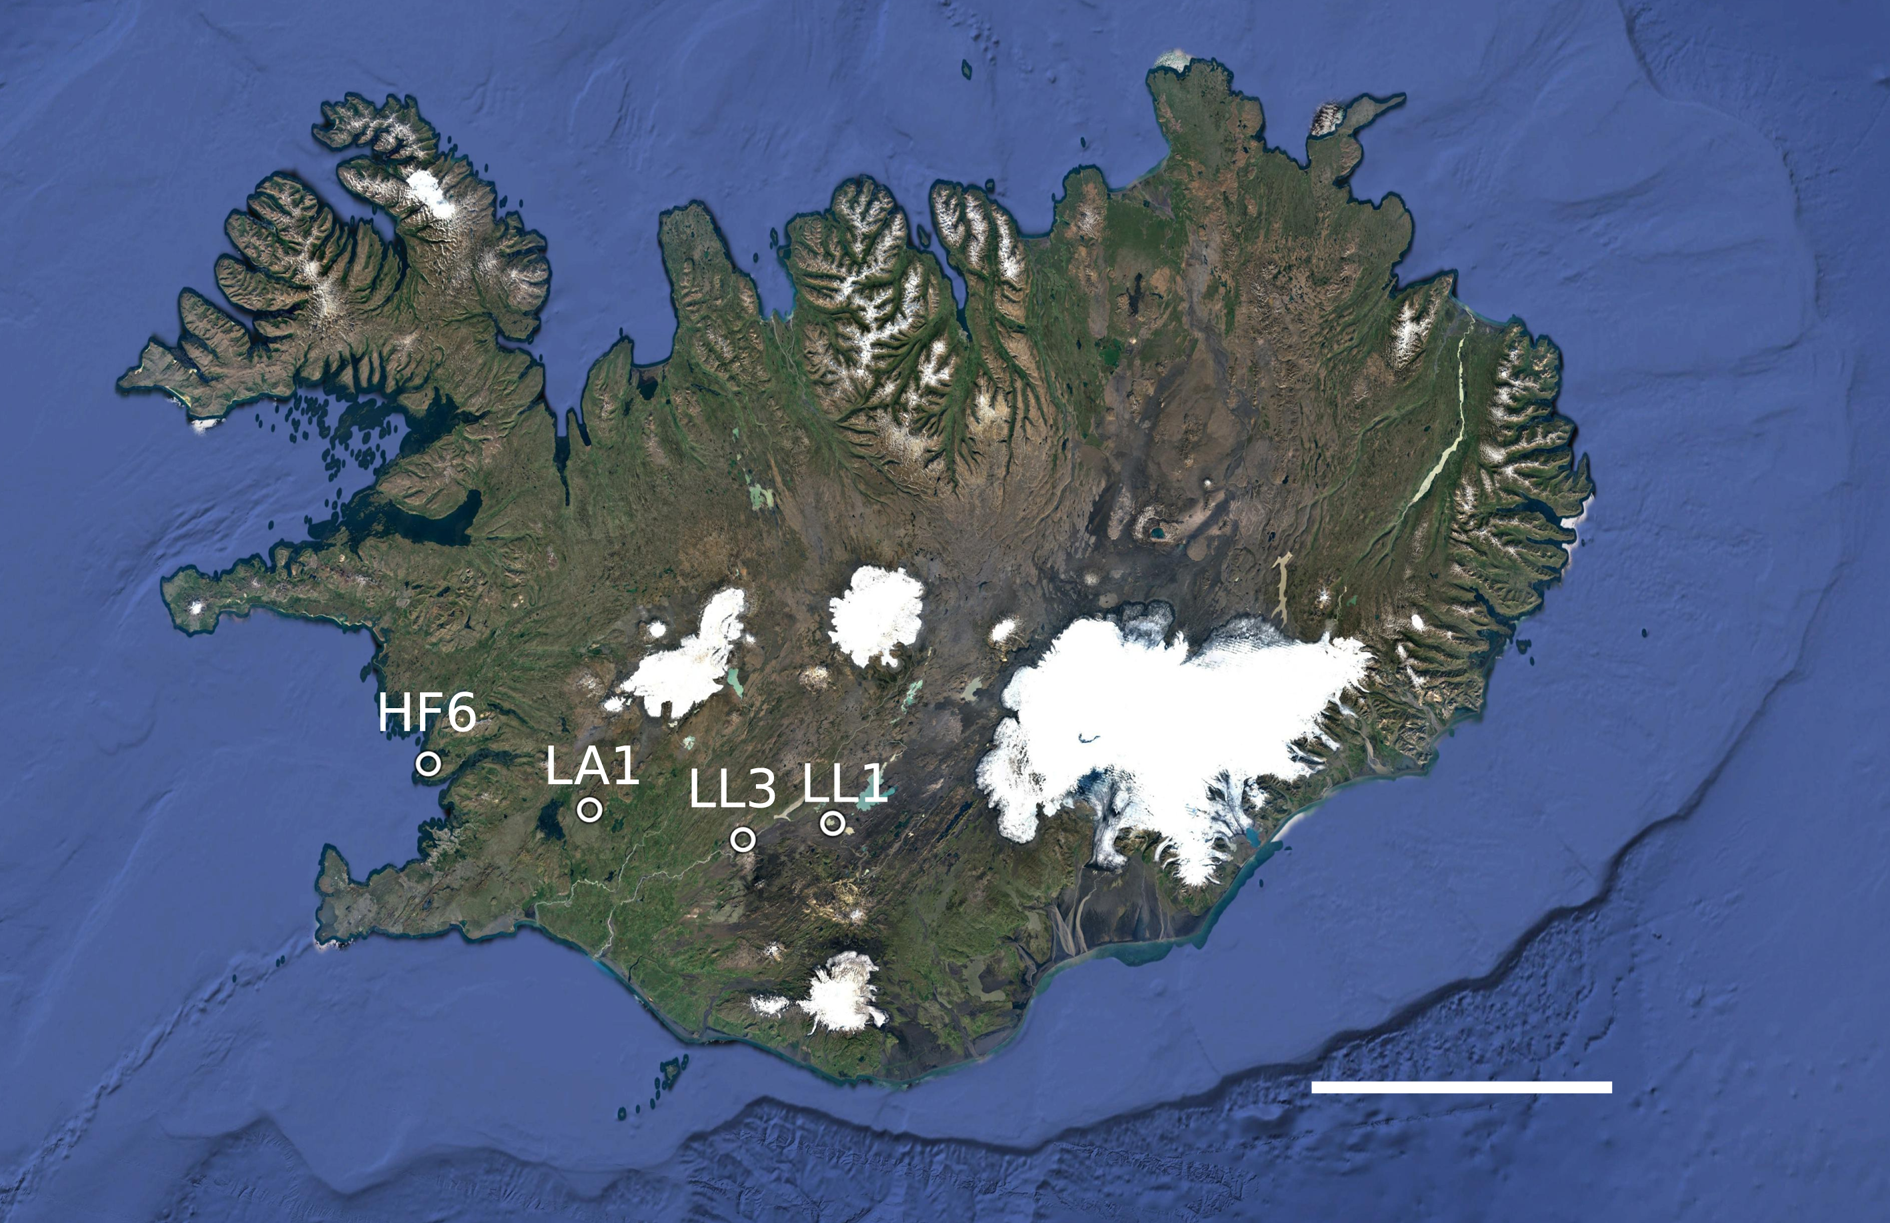
Fig. 1. Map of the collecting localities (labelled) in western Iceland. The largest distance between sites was 140 km. The map was made with Google Earth v.7.3.3.7786. Data attribution: SIO, NOAA, US Navy, NGA, GEBCO, Image Landsat/Copernicus, Image IBCAO. Scale = 100 km. In colour online.
Microsatellite discovery and characterization
Metagenomic DNA of P. membranacea was used for 454 pyrosequencing, performed by Microsynth AG (Balgach, Switzerland) following standard protocols on a GS FLX instrument (Roche, Schlieren, Switzerland). Additionally, Illumina Solexa 2 × 35-bp reads were sequenced at a commercial facility, generating 1.4 GB of Illumina data, yielding c. 50-fold coverage of the Nostoc genome (Xavier et al. Reference Xavier, Miao, Jónsson and Andrésson2012; Kampa et al. Reference Kampa, Gagunashvili, Gulder, Morinaka, Daolio, Godejohann, Miao, Piel and Andrésson2013). The 454 data were assembled using the Newbler program, yielding 150 581 contigs with an average length of 900 nucleotides, 135 511 117 bases in total. Contigs were sorted by homology to known genomes and base composition and homology with poly-A cDNA (mycobiont) was also used. The contigs sorted as mycobiont were then assembled together with Illumina mate-pair data using MIRA v.3.2.1. Finally, SSPACE was used to scaffold the contigs, yielding 43 Mb in 2250 scaffolds for Peltigera membranacea. MSATCOMMANDER v.0.8.2 (Faircloth Reference Faircloth2008) was used to find dinucleotide, trinucleotide, tetranucleotide, pentanucleotide, and hexanucleotide repeats in the P. membranacea metagenomic assembly; the search was restricted to retrieve only contigs containing ≥ 10 repeats in trinucleotides, and ≥ 9 in all others. In order to establish that the microsatellites found in the metagenomic assembly were specific to the mycobiont, we used only contigs that had a high coverage and blasted to Ascomycota, since high coverage could originate from either mycobiont or photobiont. We performed BLAST searches (Altschul et al. Reference Altschul, Madden, Schäffer, Zhang, Zhang, Miller and Lipman1997) of the translated nucleotide sequences containing the microsatellite repeats (blastx) against protein databases (swissprot, refseq_protein, nr) to determine whether a given contig was of ascomycete origin.
The genome of Nostoc strain N6 originating from Keldur in Reykjavik, Iceland was sequenced on the Illumina platform and assembled in MIRA for a prior study (Gagunashvili & Andrésson Reference Gagunashvili and Andrésson2018). This genome provided the Nostoc SSRs. TandemRepeatFinder v.4.08 (Benson Reference Benson1999) was used to search the Nostoc N6 genome for SSRs. Primers were designed for an annealing temperature of 55 °C using the software PrimerBlast (Ye et al. Reference Ye, Coulouris, Zaretskaya, Cutcutache, Rozen and Madden2012) which employed Primer3 for primer design (Rozen & Skaletsky Reference Rozen, Skaletsky, Krawetz and Misener2000).
Species identity assay
During fieldwork it was noticed that Peltigera membranacea thalli in sparsely vegetated areas in Iceland tend to have narrower lobes and shorter, more branched rhizines than those in areas with substantial vegetation cover, thus becoming morphologically similar to P. canina. To verify the accuracy of our field species identifications, we developed a molecular assay based on the internal transcribed spacer (ITS) region, a part of the nuclear ribosomal gene cluster, based on sequences downloaded from GenBank. Part of the ITS region is hypervariable in members of the genus Peltigera, containing a microsatellite and many indels (Miadlikowska et al. Reference Miadlikowska, Lutzoni, Goward, Zoller and Posada2003). We included all specimens of P. membranacea, P. praetextata and P. canina in GenBank (accessed 5 May 2021) which had a full coverage of the region spanned by our new primers, thus providing a representative sample. A number of the specimens included in the alignment were from Iceland (P. membranacea: 2 out of 17, P. praetextata: 3 out of 7, P. canina: 7 out of 9). Additional species of Peltigera occurring in Iceland that were analyzed included P. islandica (10 of 11 samples from Iceland), P. monticola (6 samples from Iceland) and P. neckeri (2 samples from Iceland). Each of these were aligned together with one sample of P. membranacea of known size. Sequences were aligned with Clustal Omega v.1.2.1. (Sievers et al. Reference Sievers, Wilm, Dineen, Gibson, Karplus, Li, Lopez, McWilliam, Remmert and Söding2011) or with MUSCLE (Edgar Reference Edgar2004) implemented in MEGA X (Stecher et al. Reference Stecher, Tamura and Kumar2020) (see Supplementary Material Table S1, available online). Expected allele sizes were 386 or ≥ 469 bp in P. membranacea, 379–380 bp in P. canina, 380 bp in P. praetextata, 428–432 bp in P. degenii, 348 bp in P. islandica, 418 bp in Icelandic P. monticola, 408 bp in Icelandic P. neckeri, and 412–431 bp in P. ‘scotteri’ (Miadlikowska et al. Reference Miadlikowska, Lutzoni, Goward, Zoller and Posada2003), one of the species belonging to the P. canina complex (Supplementary Material Table S2, available online). Peltigera ‘scotteri’ and P. degenii have not been reported from Iceland (Hansen Reference Hansen2009). The alignment of the relevant hypervariable part of the ITS region in the P. canina complex is shown in Supplementary Material Table S1. The ITS region includes several consecutive mononucleotide microsatellites in P. membranacea (Supplementary Material Table S1), which we included in the characterization of microsatellite polymorphism (locus name: Pme_ITS, Tables 1 & 2). We genotyped 1606 samples field-identified to Peltigera membranacea from different locations around Iceland and from two sites in Scotland with the ITS assay. Location information is included in Supplementary Material Table S3 (available online). Specimens are deposited in AMNH (Akureyri).
Table 1. Overview of SSR markers developed for the lichen fungus Peltigera membranacea (Ascomycota, Peltigerales) and its Nostoc (Cyanobacteria, Nostocales) photobiont.
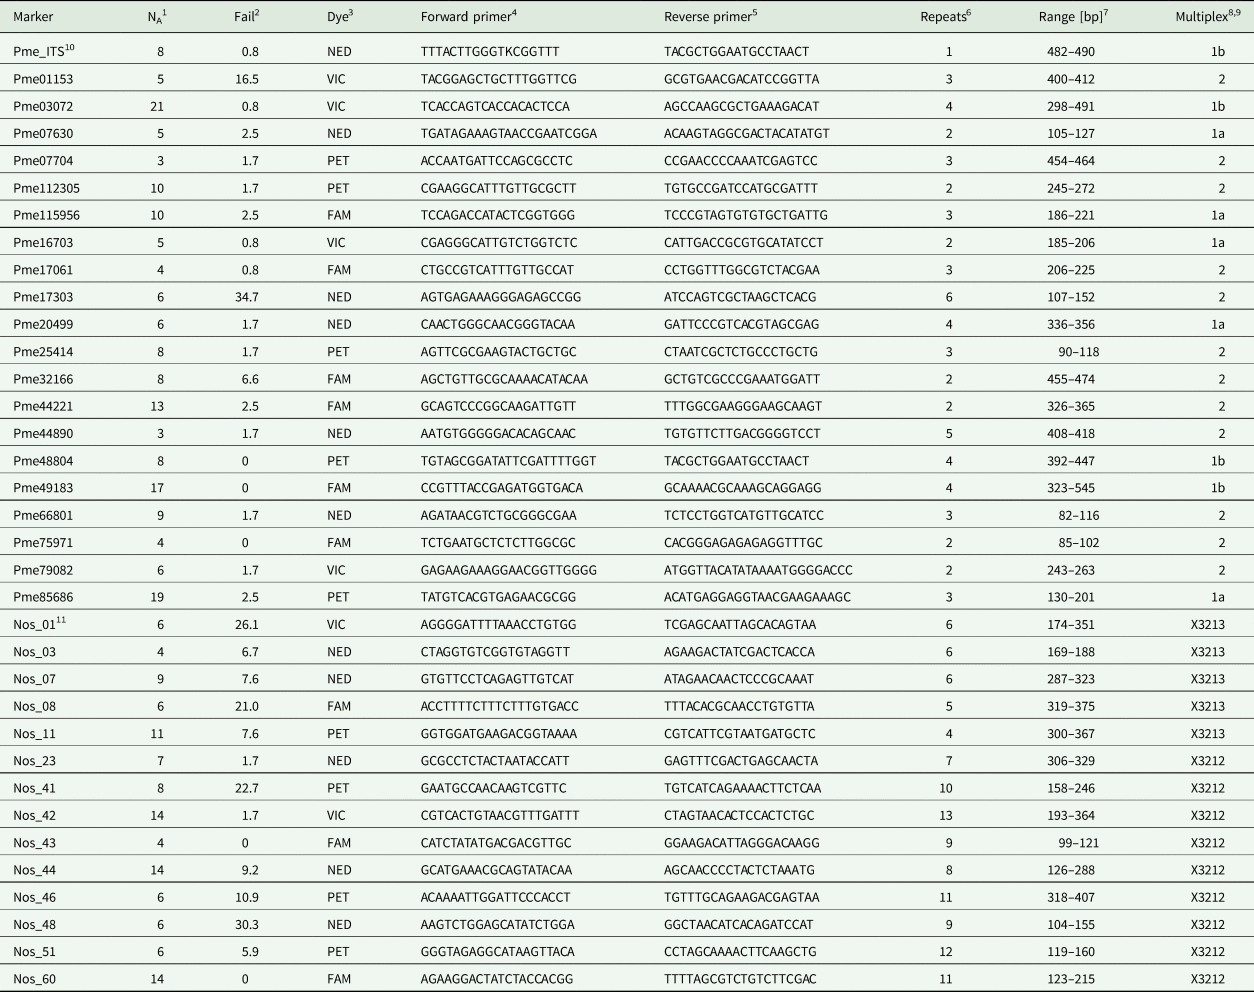
1 Number of alleles.
2 Percentage of PCR failures.
3 Fluorescent dye.
4 Sequence of M13(21)-labelled forward primer from 5′ to 3′.
5 Sequence of reverse primer from 5′ to 3′.
6 Number of repeated bp.
7 Range of allele sizes in bp.
8 Allocation to multiplex.
9 Primers were designed for an annealing temperature of 55 °C. Sample sizes are n = 121 in P. membranacea, and n = 119 in Nostoc.
10 ‘Pme’ in the primer name stands for a primer of the mycobiont, Peltigera membranacea.
11 ‘Nos’ stands for a primer of the Nostoc cyanobiont of P. membranacea.
Table 2. Diversity statistics in 20 simple sequence repeat loci of Peltigera membranacea and 14 of its Nostoc cyanobiont, calculated for populations from western Iceland. HF6, LA1, LL1 and LL3 = collecting localities.
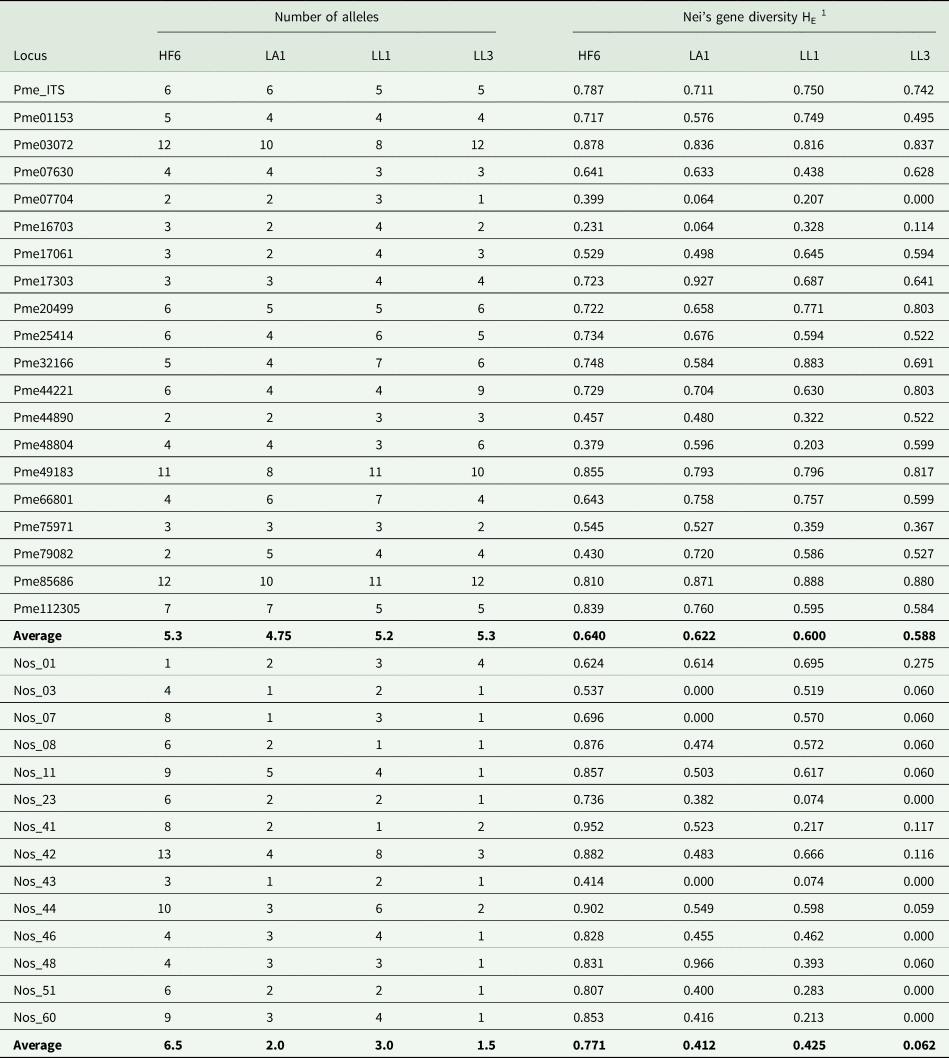
1 Nei's unbiased gene diversity HE (Nei Reference Nei1978).
Laboratory procedures
DNA extraction was performed with the DNeasy Plant Kit (Qiagen, Hilden, Germany) following the manufacturer's instructions.
Test-PCRs with M13(-21) dye labelling
Initial screening for amplification and polymorphism was performed in 5 μl reaction volumes using the M13 method (Schuelke Reference Schuelke2000), adding 1 μl of primer mix containing all loci to be labelled with the same fluorescent dye (forward primer without M13-tail = 0.15 μM; M13(-21)-tailed forward primer = 0.01 μM; dye-labelled M13(-21) primer = n × 0.15 uM, n = number of loci in multiplex; reverse primer = 0.15 μM), 2.5 μl Jump-Start Taq ReadyMix (Sigma-Aldrich, Buchs, Switzerland), 0.5 μl genomic DNA, and 1 μl ddH2O. PCR products were labelled with four fluorescent dyes (6FAM, VIC, PET, NED; Life Technologies, Rotkreuz, Switzerland) via the M13(-21) primer and were pooled before fragment analysis, which proceeded with an internal size standard, GeneScan-500 LIZ (Life Technologies, Rotkreuz, Switzerland) on a 3130xl Genetic Analyzer (Life Technologies, Rotkreuz, Switzerland) at WSL. PCR amplifications used an initial denaturation of 94 °C for 5 min, followed by 30 cycles of 30 s at 94 °C, 45 s at the annealing temperature of 55 °C, 45 s at 72 °C; followed by 8 cycles of 30 s at 94 °C, 45 s at 53 °C, 45 s at 72 °C to incorporate the dye-labelled M13(-21) primer (5′- TGT AAA ACG ACG GCC AGT -3′); and a final extension at 72 °C for 30 min.
PCR with dye-labelled primers
In a second step, PCR and fragment analyses were performed with fluorescent dye-labelled primers by deCODE Genetics (Reykjavik, Iceland). Fluorescent dye-labelled primers were used in three multiplex PCRs. Microsatellite panels were created using a Packard MultiPROBE II pipetting robot. PCR set-up for microsatellite genotyping and post-PCR liquid handling was carried out using a Zymark Sciclone Alh500 pipetting robot. For primer sequences and multiplex setup, see Table 1. The PCR contained 0.496 × PCR Gold Buffer, 3.26 mM MgCl2, 324.8 μM dNTPs, and 0.04 U/μl AmpliTaq Gold Polymerase. PCR cycling conditions were: 95 °C for 10 min; five cycles of 95 °C for 15 s, 63 °C for 30 s (−2.5 °C per cycle), 72 °C for 30 s; 12 cycles of 95 °C for 15 s, 55 °C for 30 s, 72 °C for 1 min; 23 cycles of 89 °C for 15 s, 55 °C for 30 s, 72 °C for 1 min; followed by a final extension at 72 °C for 3 min. Again, alleles were sized using GeneScan-500 LIZ as an internal size standard but this time a 3730 DNA Analyzer (Life Technologies, Rotkreuz, Switzerland) was utilized for capillary electrophoresis. Samples were genotyped using the Microsatellite Plugin v.1.4 in Geneious v. 7.1.9 (Biomatters Ltd, Auckland, New Zealand).
Protocol for the species identification assay in singleplex
PCR products were labelled with NED fluorescent dye (Life Technologies, Rotkreuz, Switzerland) via the M13(-21) primer (NED-5′- TGT AAA ACG ACG GCC AGT -3′). PCR was performed in 5 μl reaction volumes, adding 1 μl of primer mix (Pme_ITS-F = 0.15 μM; M13(-21)-Pme_ITS-F (5′- TGT AAA ACG ACG GCC AGT TTT ACT TGG GTK CGG TTT -3′) = 0.01 μM; NED-dye labelled M13(-21) primer = 0.15 μM; Pme_ITS-R = 0.15 μM), 2.5 μl Jump-Start Taq ReadyMix (Sigma-Aldrich, Buchs, Switzerland), 0.5 μl genomic DNA, and 1 μl ddH2O. Fragment analysis proceeded as above with a GeneScan-500 LIZ internal size standard (Life Technologies, Rotkreuz, Switzerland) on a 3130xl Genetic Analyzer (Life Technologies, Rotkreuz, Switzerland) at WSL. PCR cycling conditions were: initial denaturation at 94 °C for 5 min; followed by 30 cycles of 30 s at 94 °C, 45 s at the annealing temperature of 55 °C, 45 s at 72 °C; followed by 8 cycles of 30 s at 94 °C, 45 s at 53 °C, 45 s at 72 °C to incorporate the NED-labelled M13(-21) primer; and a final extension at 72 °C for 30 min. Fragment lengths were determined with Geneious v.7.1.9 (Biomatters Ltd, Auckland, New Zealand) as above.
Data analysis
Twenty-one loci were checked for polymorphism based on 122 thalli of Peltigera membranacea, collected from four localities. Polymorphism was determined using our own code in R v. 3.0.0 (R Core Team 2018). We calculated Nei's unbiased gene diversity H E (Nei Reference Nei1978) and allelic richness A R, the average number of alleles per locus. To test whether populations and coastal/inland groups of populations were subdivided, analysis of molecular variance and pairwise F ST values were calculated with Arlequin v.3.5 (Excoffier & Lischer Reference Excoffier and Lischer2010).
For the molecular species identification assay, alignments were inspected using MEGA X (Stecher et al. Reference Stecher, Tamura and Kumar2020) to determine the length of the sequences spanned by the primers developed in this study. Furthermore, a bar plot was generated showing the frequency of ITS amplicon sizes.
Results
The amplicon size of the ITS region allowed discrimination of 99.7% of Icelandic Peltigera membranacea specimens from two other common lichens in Iceland with similar morphology, P. canina and P. praetextata, as well as from P. degenii, P. ‘scotteri’, P. islandica and P. monticola (Table 1; Supplementary Material Tables S1 & S2, available online). Screening of 1606 thalli revealed few (25, 1.5%) markedly shorter fragments (386 bp; Fig. 2), with a similar size to the expected amplicon size in P. canina or P. praetextata. When these samples were reinspected morphologically, 14 of these turned out to be P. canina, five were not P. membranacea but could not be identified further, and five (0.3%) had the typical morphology of P. membranacea.
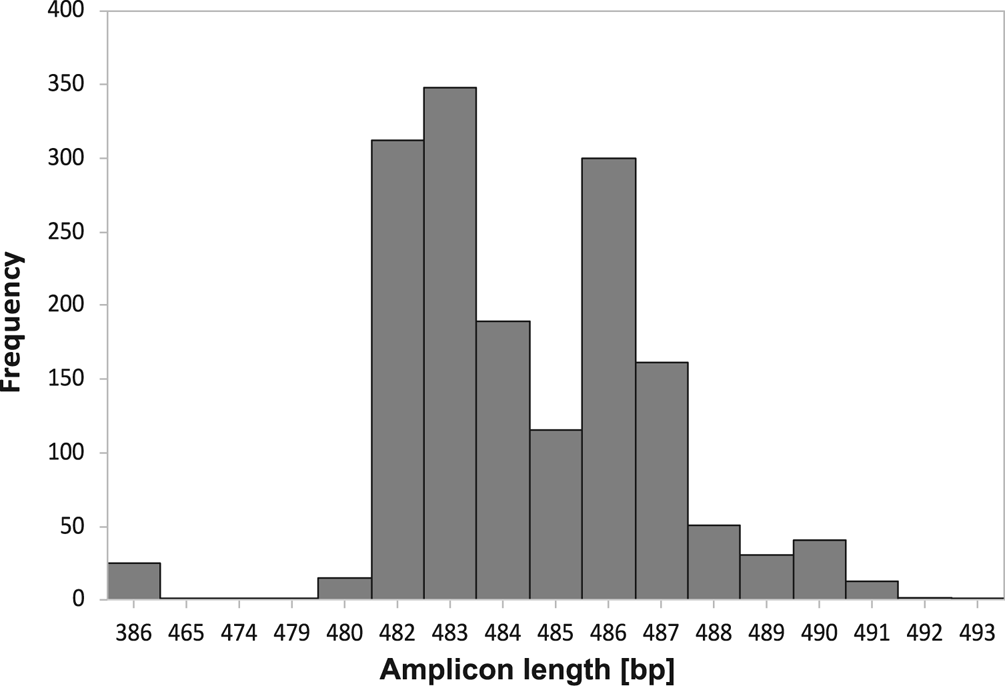
Fig. 2. Frequency of amplicon lengths (base pairs) of the internal transcribed spacer (ITS) region in 1606 thalli of Peltigera membranacea from Iceland, amplified with the Pme_ITS-primers (this study).
Out of 355 contigs that contained microsatellites, 218 contigs blasted to ascomycetes (89 dinucleotides, 101 trinucleotides, 22 tetranucleotides, 2 pentanucleotides, 4 hexanucleotides). We tested polymorphism for P. membranacea in 20 SSR loci. All loci were polymorphic. Two loci had PCR failure rates > 10%. The number of alleles per locus ranged from 1–12, and gene diversity ranged from 0–0.927 (Table 2). The Nostoc N6 genome contained a total of 598 repeats, mostly with larger period sizes (average 61.9) and an average copy number of 6.3. There were 137 SSR with period sizes < 10 bp and 39 SSR with period sizes 10–20 bp. The distribution of period sizes in the Nostoc N6 genome was strongly asymmetrical (Fig. 3), with the most frequent period sizes for repeats under 20 bp being 7 (118 loci), 14 (18 loci), and 9 (12 loci).

Fig. 3. Frequency of simple sequence repeat (SSR) loci with different period sizes [base pairs] for the genome of Nostoc N6, the strain used to design SSR markers. The figure is based on data from a search with TandemRepeatFinder v.4.08 (Benson Reference Benson1999).
The studied populations were significantly differentiated, both for the mycobiont and the photobiont (Tables 3 & 4), but the overall level of differentiation among populations was approximately four times higher in the photobiont (27.83% variance compared to 5.92% in the mycobiont; Table 3).
Table 3. Analysis of molecular variance in Peltigera membranacea based on 20 SSR loci of the mycobiont and 14 of the Nostoc photobiont.
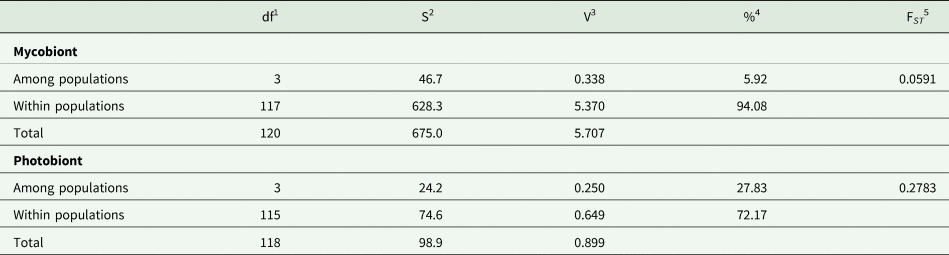
1 Degrees of freedom.
2 Sum of squares.
3 Variance component.
4 Percentage of variance.
5 F-statistics. Both FST values were highly significant (P < 0.01).
Table 4. Pairwise F ST values in four populations of the lichen Peltigera membranacea (below diagonal) and geographical distances (km) between them (above diagonal), based on 20 mycobiont and 14 cyanobiont SSRs. HF6, LA1, LL1 and LL3 = collecting localities.
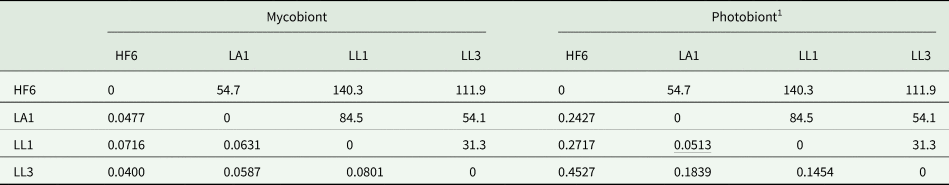
1 Nonsignificant F ST value underlined (P = 0.05).
Discussion
The size of the ITS region amplified by our new set of loci can act as a valuable proxy to sort out suspicious field-identified specimens. The ITS sizes of P. membranacea and P. canina overlap somewhat in Icelandic populations, but the short allele size is quite rare in P. membranacea (found in five or 0.3% of the specimens examined). Screening the ITS region of 1606 samples revealed that misidentifications did not represent a major concern in our data set; this differs from what has been reported for Lobaria section Lobaria from the Macaronesian Islands (Werth et al. Reference Werth, Cornejo and Scheidegger2010). While the ITS size assay works well in an area with comparatively little variability within Peltigera membranacea and allies such as Iceland, more work would be necessary before it can be applied to other places with higher variability in these species, or with more species belonging to the same group.
The variability of the microsatellite loci developed for the mycobiont P. membranacea was similar to that of microsatellites developed for other lichen-forming fungi, such as Peltigera dolichorhiza (Magain et al. Reference Magain, Forrest, Serusiaux and Goffinet2010), which is the only species of Peltigera for which microsatellites are currently available. The four studied populations of P. membranacea exhibited moderate amounts of variability, a level that was comparable to that of populations of Lobaria pulmonaria in the Swiss Jura subjected to uneven-aged forestry (gene diversity H E ≈ 0.5) (Werth et al. Reference Werth, Wagner, Holderegger, Kalwij and Scheidegger2006). The genetic diversity of the photobiont of P. membranacea varied markedly between populations, seemingly independent of the variation of the mycobiont populations.
We found significant differentiation between all studied populations of the mycobiont of P. membranacea and between all but one populations of the photobiont. This result was not unexpected as the localities studied were remote from each other (31–140 km; Fig. 1), at distances where we would not expect frequent gene flow via thallus fragments or ascospores. The new microsatellites provide a valuable tool to quantify population level variability in Peltigera membranacea and its Nostoc photobiont.
Acknowledgements
This study was funded by the Icelandic Research Fund (grant # 120247021. 141102-051 and 174307-052 to SW and ÓSA) and by the European Commission within FP7 (Marie Curie Actions, IEF, ‘LICHENOMICS’, grant # 302589). Logistical support was provided by deCODE Genetics and the University of Iceland. PCRs and fragment analyses were performed by the genotyping team at deCODE Genetics. Sigrún Reynisdóttir helped with DNA extractions. Steffen Fabian, Antoine Morin and Sigurður B. Magnússon are thanked for their assistance with fieldwork.
Author Contribution
SW conceived the study, performed DNA isolations, genotyped the samples, analyzed the data and wrote the first draft of the manuscript. SÞP performed PCRs and fragment analyses. ÓSA contributed to manuscript writing.
Author ORCIDs
Silke Werth, 0000-0002-4981-7850; Ólafur S. Andrésson, 0000-0002-8451-5671.
Supplementary Material
To view Supplementary Material for this article, please visit https://doi.org/10.1017/S0024282921000384


 Open access