


Introduction
A foundation of motivational theory is the supposition that motivation contributes to explaining variance in second language learning proficiency; in some social contexts it has been presented as the main driver of increased achievement (Gardner & Lambert, Reference Gardner, Tremblay and Masgoret1972). More recent research has been devoted to exploring constructs from the L2 Motivational Self System (L2MSS) (Dörnyei, Reference Dörnyei2005), with the most recent ones delving deep into the conceptualization of its key notions, ideal L2 self and ought to-L2 self (e.g., Feng & Papi, Reference Feng and Papi2020; Papi et al., Reference Papi and Khajavy2019; Papi & Khajavi, Reference Papi and Teimouri2021).Whilst there is a body of research demonstrating the relationship between measures of effort invested in language learning and L2MSS constructs, caution needs to be taken in interpreting and comparing findings, as often the measures of proficiency used are not stringent, or rely on self-reported intended effort (cf. Al-Hoorie [Reference Shavelson, Hubner and Stanton2018]).
Several recent studies meanwhile provide sophisticated insights into the multiple and diverse motivational profiles of learners (Csizér & Dörnyei, Reference Csizér and Dörnyei2005; Kangasvieri, Reference Kim, Kim, Csizér and Magid2017; Papi & Teimouri, Reference Peal, Lambert, Gardner and Lambert2014). Findings indicate a diversity in the levels of a range of motivational traits for different groups of language learners. However, in exploring the motivation-proficiency relationship, these studies tended to employ mainly correlational analyses, which imposes a simplified view of the relationships at play from the outset. We believe there is a clear need to explicitly integrate recent understandings of motivational profiles into explorations of how motivation relates to proficiency. To this end, the present study integrates a robust measure of language proficiency into a motivational profile analysis using a person-centered analytic approach. This escapes the variable-centered assumption that the nature of the relationship between motivational traits and proficiency will be the same for all learners in the sample. The methodology employed, Latent Variable Mixture Modeling (LVMM), is consistent with previous research into motivational profiles, and, by integrating a fully validated measure of English language proficiency, is open to nuances in the motivation-proficiency relationship that might otherwise have been overlooked.
Literature review
Language learning motivation
Research on language learning motivation has a long history. In the current study, we adopt Dörnyei’s L2MSS as the main framework through which to explore motivational influences, but also draw on other constructs to provide what we believe to be a more complete picture of the different aspects of motivation. The L2MSS proposes that the decision to pursue and sustain language learning might be underlined both by a vision of what the individual wants to achieve, coined as the “ideal L2 self,” and individual’s belief of what one should aspire to, referred to as “ought-to L2 self” (Dörnyei, Reference Dörnyei2005). Another component that affects these decisions is “language learning experience” that concerns the effect of the immediate environment on language learning. The key motivational force in Dörnyei’s theory is driven by the gap between the future selves (ideal and/or ought-to) and current self-perception. The latter corresponds to English self-concept (Shavelson et al., Reference Yun, Hiver and Al-Hoorie1976), which reflects how the learner views their L2 self at the present moment. Other constructs drawn on in this study reflect learning goals. The most commonly researched language learning goals are “instrumentality,” which concerns the utilitarian reasons for learning a language (Gardner & Lambert, Reference Gardner, Tremblay and Masgoret1972) such as better job prospects, and “international orientation,” where English is learned to be able to communicate with other English speakers, and learn more about other cultures (Yashima, Reference Hessel2000).
Studies linking language learning motivation and language proficiency
Early studies of language learning motivation revealed a link between language learning motivation and proficiency, in particular motivation underlined by integrative motives, that is the willingness to be like a valued member of the target language community (Anisfield & Lambert, Reference Anisfield and Lambert1961; Gardner, Reference Gardner1960; Gardner & Lambert, Reference Gardner and Lambert1959, Reference Gardner, Tremblay and Masgoret1972; Peal & Lambert, Reference Ryan, Dörnyei and Ushioda1972). However, this body of research had substantial methodological limitations. Studies employed a mixture of measures, some of which were highly subjective or only tenuously related to language proficiency. Examples include: school grade reported by students; number of years speaking the language; average grade across a wide range of courses; and teachers’ rating of achievement (Lambert et al., Reference Gardner, Tremblay and Masgoret1972; Peal & Lambert, Reference Ryan, Dörnyei and Ushioda1972). A study in the 1990s by Gardner et al. (Reference Hancock, Mueller, Cudeck, du Toit and Sorbom1997) found motivation to be, in fact, more closely related to grades allocated by teachers than other more objective measures of achievement.
The line of research exploring the link between motivation and language proficiency appears to have been virtually abandoned, with few studies on the topic published after the initial wave in the 1960s and early 1970s. A number of studies since 2010 do, however, explore the relationship of L2MSS constructs with L2 proficiency (Dörnyei & Chan, Reference Dörnyei and Chan2013; T.-Y. Kim & Kim, Reference Kim and Kim2014; Y.-K. Kim & Kim, Reference Lamb2011; Lamb, Reference Lamb2012; Moskovsky et al., Reference Muthén, Hancock and Samuelson2016; Papi & Khajavy, Reference Papi and Teimouri2021; Saito et al., Reference Schwarz2019). Yet often the measures of proficiency are not robust, which makes comparisons difficult. Of these studies, in fact only a handful have the central aim to investigate the link between motivation and proficiency. These deserve some more attention here. Lamb’s study (2012) employed the C-test to measure Indonesian students’ proficiency level. Regression analysis revealed that only one motivational variable positively contributed to explaining variance in the test results, namely language learning experience at school. The role of the self-guides (ideal and ought-to) was, however, not clear. Moskovsky et al. (Reference Muthén, Hancock and Samuelson2016) used reading and writing tasks to measure the proficiency of English majors at a Saudi university. Correlation analysis showed the ideal L2 self to have a negative relationship with test results, with nonsignificant correlations for ought-to L2 self and language learning experience. The third study, which was longitudinal, focused on oral skills, and employed comprehensibility judgments by professional raters to measure proficiency (Saito et al., Reference Schwarz2019). Similar to the two previous studies, Saito et al.’s (Reference Schwarz2019) results pointed to a negligible role of the ought-to L2 self in explaining oral proficiency gains of Japanese learners of English but the ideal L2 self was found to be positively related to proficiency. Papi and Khajavy (Reference Papi and Teimouri2021) explored this further and showed that ideal L2 self and ought-to L2 self with different regulatory focus (own/other) lead to qualitative differences in motivated behavior that in turn affect achievement in different ways. Clearly there are nuances in the motivation-proficiency relationship that are not being captured by existing approaches to researching this area.
Al-Hoorie’s meta-analysis which incorporated 39 unique samples and 32,078 language learners (Al-Hoorie, Reference Shavelson, Hubner and Stanton2018) pointed to some of the conceptual difficulties in comparing studies. Such discrepancies are understood to have led to an overall unclear picture of relationships between L2 language proficiency and the motivational traits specified by contemporary theorists. There are also differences in the research context and type of analysis employed, as well as a focus on different language skills, and use of different measures of proficiency. It is clear that there is a need for further comprehensive studies that clarify the relationship between constructs in the L2MSS and L2 achievement.
Motivational profiling
The profiling approach can add to our understanding of the relationship between L2 motivation and L2 proficiency. Profiling is a person-centered methodology, which assumes heterogeneity in the population studied, bringing advantages for the level of analytic insight for a given dataset (Marcoulides & Heck, Reference Masyn and Little2013). Simply put, profiling is a means of grouping study participants based on their comparative levels across a series of metrics. For example, in terms of L2 skills, a profiling approach may show that one group of students performs comparatively better in productive over receptive skills, whilst the reverse may be true for a different group of students. In this case looking at learner profiles helps to qualitatively discriminate L2 ability for different groups of students. Such classification and understanding of the characteristics of students of different profiles opens up avenues for future interventions, changes in curriculum, or instructional modifications to provide bespoke support for different groups of learners.
Profiling has been used in SLA research to explore the interrelationships between motivational traits. Four key studies are relevant to mention here, three of which used cluster analysis to establish patterns of motivational trait levels: Csizér and Dörnyei (Reference Csizér and Dörnyei2005) studied motivation profiles of Hungarian eighth-grade language learners; Yun et al. (Reference O’Sullivan, Dunlea, Spiby, Westbrook and Dunn2018) worked with college students from South Korea; and Papi and Teimouri (Reference Peal, Lambert, Gardner and Lambert2014) Iranian secondary school students. A further study by Kangasvieri (Reference Kim, Kim, Csizér and Magid2017) employed latent profile analysis (LPA) to investigate motivational profiles of Finnish secondary school students learning a range of foreign languages. These four studies are not directly comparable to one another because they employed differing motivational variables and methodologies; there are, however, two clear parallels between their results. First, each study identified four or five distinct motivational profiles, with contrasting profiles of students with weak and strong motivation. Second, distinctions between groups were not always uniform across the traits, for example Kangasvieri (Reference Kim, Kim, Csizér and Magid2017) revealed self-concept in particular to vary independently of other motivational traits between the different profile groupings.
Of the four studies discussed here, only Yun et al. (Reference O’Sullivan, Dunlea, Spiby, Westbrook and Dunn2018) incorporated a measure of proficiency (Test of English Proficiency [TEPS], developed by Seoul National University), which enabled them to identify five distinct learner profiles: Thriver, Engaged, Striver, Dependent, and Disengaged. The possibilities engendered by integrating proficiency measures into motivation profiles is also emerging in other fields of educational assessment. A key example is from Michaelides et al. (Reference Moskovsky, Assulaimani, Racheva and Harkins2019) who use cluster analysis to explore the relationship between motivation and achievement in mathematics across a range of contexts. These researchers emphasize that a person-centered analytic approach enables motivational predictors of achievement to “interact in ways that will reveal stronger and weaker associations with achievement, compared to the average relationships observed in variable-centred approaches” (Michaelides et al., Reference Moskovsky, Assulaimani, Racheva and Harkins2019, p. 4). The study reported here is likewise premised on the possibility that the strength, or even the directionality, of motivation-proficiency relationships can vary between learners and learner groups. In taking a person-centered profiling approach in modeling L2 motivation and integrating robust measures of L2 proficiency, the study described in this article aims to set the groundwork for a more comprehensive and intricate understanding of the relationship between motivation and proficiency than has come before.
Rationale and research questions
This study takes steps toward addressing acknowledged gaps in our understanding of the relationship between L2 language learning motivation and proficiency. The review of literature suggests that multiple motivational subpopulations exist within a given group of teenage English language learners, each with a distinct profile. Notably, it has also been shown that integrating proficiency information into this profiling approach has the potential to add a valuable dimension to the findings. The current research progresses our understanding by integrating information from a validated language test into a rigorously executed and methodologically robust motivational profiling study. The following research questions are addressed:
Are there heterogenous subgroups of students within the “English Impact” Madrid data? If so, how do these profiles differ with respect to L2 proficiency and motivational traits?
To answer these questions, the data collected for the British Council’s English Impact Madrid study (Shepherd & Ainsworth, Reference Taguchi, Magid, Papi, Dörnyei and Ushioda2017) was revisited to establish the number and nature of subpopulations in this learner group with respect to motivation and proficiency. The data comprised of 15.5-year-old English language learners’ answers to a motivational questionnaire and the results of a multiskill English language test; all learners were currently attending state schools in the Madrid region of Spain. It is hoped that these results will be a basis for further research that will ultimately lead to a better understanding of the needs of different groups of learners and how they can be addressed by instructional intervention and curricular reform.
Method
Sampling and participants
Data were collected as part of a wider study run by the British Council in 2017 (Shepherd and Ainsworth, Reference Taguchi, Magid, Papi, Dörnyei and Ushioda2017). Participants from within the Madrid state school system were selected using two-stage cluster sample methodology designed and executed by the Australian Council for Educational Research (ACER). First a sample of schools based on defined stratification variables (school type, geographical location, and bilingual status) was chosen, and then a random selection of 12 students from each school was sampled.
Participating students were from Compulsory Secondary Education (ESO) 4 and their mean age was 15.6. They were currently studying English as part of their studies at this grade level for at least 90 minutes per week. In total, 1,773 students from 169 schools participated, 50.9% of whom were female and 49.1% male. A total of 29.6% attended bilingual schools and a further 70.4% came from nonbilingual schools. The participation levels reached the minimum statistical required to be considered representative of this population of learners in the Madrid region.
Data-collection instruments
Multiskill English language test
The British Council’s Aptis for Teens (O’Sullivan et al., Reference O’Sullivan, Dunlea, Spiby, Westbrook and Dunn2020), a test specifically designed for 13–17-year-olds, was used to measure English proficiency. It comprised five components: reading, writing, speaking, and listening, plus grammar and vocabulary. The Aptis testing system is based on the sociocognitive model proposed by Weir (Reference Weiss2005) and OʼSullivan and Weir (Reference Papi, Bondarenko, Mansouri, Feng and Jiang2011) and aligned with the Common European Framework of Reference (CEFR; Council of Europe, 2001). Receptive skills components are automatically scored; meanwhile trained raters mark the speaking and writing responses using an online system. Scores for all components are reported on a 0–50 scale, and CEFR level allocations are given for the four language domains, but not grammar and vocabulary.
Motivational questionnaire
A questionnaire comprising 51 items, delivered in Spanish, captured students’ opinions of their schooling and language learning experiences, their language learning motivations, plus a range of socioeconomic indicators, including parental education levels, employment status, and household possessions.
The motivation section of the questionnaire was tailored to the population of 15-year-old Spanish students. There were 32 items in total, divided equally into eight scales:Footnote 1
-
• Ideal L2 self—the vision of oneself as a successful language user.
-
• Ought-to L2 self—perceptions of the importance of English based on the opinion of important others in their immediate language learning environment.
-
• Language learning experience—language learning attitudes that can be seen a reflective of language learning experience.
-
• Instrumentality—students’ understanding of the utilitarian value of English learning.
-
• International orientation—attitudes toward English as a language which enables learners to communicate with a wide variety of people.
-
• English self-concept—students’ perceptions of themselves as learners of English based on their past experiences and social comparison.
-
• Parental encouragement—students’ opinions about parental support and their attitudes toward learning English.
-
• Motivated learning behavior—a measure of effort that learners invest in learning English.
The scales were adapted from the motivational questionnaire used by Iwaniec (Reference Iwaniec2014), who also worked with a sample of 15-year-old students, albeit from a different European country (Poland). The exception was the ought-to L2 self scale, adapted from Taguchi et al. (Reference Weir2009), which was originally used with a wider age sample (12 to 53 years) in three different contexts: China, Japan, and Iran. The main adaptation involved shortening the scales to four items each, although a small number of other minor changes in wording were made. These were made to adjust the scales to the context studied and to minimize time investment of the participants. To ensure the suitability of the questionnaire for our sample, a pilot study was conducted before the main study.
Procedure
The tests and questionnaires were delivered using an offline-enabled tablet in fully invigilated conditions during a period of one month in March 2017. Full involvement and approval of the Madrid Ministry of Education was obtained prior to conducting this study. Individual participation in the study was contingent on receiving written parental consent.
Analysis
The main data analysis took part in two stages using statistical software Mplus 8 (Muthén & Muthén, 1998–Reference Nagin2017). The initial Confirmatory Factor Analysis (CFA) used to confirm the measurement model is summarized in the results that follow and reported in full elsewhere Footnote 2 (Shepherd & Ainsworth, Reference Taguchi, Magid, Papi, Dörnyei and Ushioda2017). The analysis novel to this study explored the motivation and proficiency profiles of the participants using LVMM, with the specific model applied being a Factor Mixture Model (FMM).
Confirmatory Factor Analysis
To assess the measurement qualities of the questionnaire, CFA of the current dataset was undertaken. This specified a “measurement model” hypothesizing the eight sets of four observed responses to be indicators of the eight underlying latent variables (please refer to Appendix A for the full path diagram). Whilst this instrument was developed and validated specifically for the use of teenagers learning English in the European Union (Iwaniec, Reference Kangasvieri2015), it had not been applied in the Spanish context before the data-collection exercise described. Verifying this latent structure as a reasonable representation of the data as part of a preliminary assessment was essential before moving forward to the main analysis in the current project, in which the measurement model forms an integral element of the final model, see the following text. To assess whether the hypothesized measurement model achieves this successfully, a number of fit statistics are employed. For the fit indices reported here, it is usually expected that the comparative fit index (CFI) and Tucker–Lewis index (TLI) statistics be above 0.9 (or ideally 0.95), and the root mean square error of approximation (RMSEA) below 0.05 for good model fit (Byrne, Reference Byrne2012).
Latent Variable Mixture Modeling
The main analysis employed LVMM, a “person-orientated” approach to data modeling, which focuses on characteristics of the individuals from whom the measurements are taken (Bergman & Magnusson, Reference Bergman and Magnusson1997). This analysis identifies unobserved heterogeneity in a population and can be used to divide individuals into subtypes that, as a group, exhibit similar traits or patterns of behavior (Collins & Lanza, Reference Collins and Lanza2010).
A range of model structures can be described as LVMMs. The model applied here can be defined as a FMM that falls within category of “hybrid latent variable models” (Muthén, Reference Muthén and Asparouhov2007; Muthén & Asparouhov, Reference Muthén and Muthén2006) because it includes both continuous and categorical latent variables. Our model comprised eight continuous latent factors, each representing a motivational trait. These factors, alongside the five observed test score outcomes, acted as indicators for the latent categorical variable. Classifications could therefore vary with respect to the factor mean for each motivational trait, plus the observed means on the five language skill tests, meaning that each participant was allocated to a latent class in the model based on both motivation and proficiency indicators. A key point to note is that this approach does not assume that the high performers will have high motivation levels, and vice versa, but rather allows the relationship between motivation and proficiency, or indeed between specific measures within each of these, to vary between classes.
Figure 1 plots the relationships modeled, where: C = single latent categorical variable (comprising k categories); m 1-5 = measured language test scores; f 1-8 = latent factors representing the motivational traits; u 1-4 = observations from motivational questionnaire items; and factor loadings are assumed invariant across classes. Important to note here is that the latent class k is hypothesized to explain both the observed test scores (m1—m5) and the unobserved motivational traits (f1–f8). The results discussion will focus predominantly on how each latent class is characterized with respect to their levels across all these metrics.

Figure 1. Path diagram showing structure of relationships modeled in the current study.
The model comprised 37 dependent variables (each of the 5 language test scores, plus the 32 questionnaire responses); 8 continuous latent variables (representing the motivational traits); and 1 categorical latent variable (defining the classifications of interest). The model estimated loadings between each question response and its associated continuous latent variable (these were held constant across latent classes); latent means and thresholds for each continuous latent variable (these were allowed to vary between classes, with one class set for reference); and means for each observed test score (these were allowed to vary between classes). The full model specification in Mplus is given in Appendix D.
Analytic aims
This investigation first seeks to establish the number of distinct latent classes (k) in the current data with respect both to the participants’ English language proficiency and levels of language learning motivation. As with exploratory factor analysis, this is a heuristic technique, and it is not always the case that a definitive answer will arise from the data. In selecting the final number of classes there are statistical indicators that can be drawn upon to aid researchers; however, there is not one single indicator that is accepted for deciding on the number of classes (Nylund et al., Reference OʼSullivan, Weir and OʼSullivan2007). It is best therefore to examine a range of indicators (Masyn, Reference McLachlan and Peel2013; Nylund et al., Reference OʼSullivan, Weir and OʼSullivan2007). In the modeling exercise reported here, a series of successive models are estimated with the same overall structure (Figure 1) but with an incrementally increasing number of classes specified in the latent categorical variable (C). Model assessment took two stages: (a) examination of statistics to gauge relative model fit and (b) consideration of a range of metrics to judge the quality of class enumeration for the closest fitting models. The evidence accrued from this multistage statistical modeling exercise was then considered against the substantive nature of the class characteristics, as well as the theoretical backdrop provided by previous studies in this field, before establishing the final model. Note there was no explicit consideration of absolute model fit; the standard chi-square statistic can be oversensitive, especially in the case of large datasets, and unfortunately it was not possible to examine the residuals for each response pattern, as recommended by Masyn (Reference McLachlan and Peel2013), as Mplus did not report the output (citing: “the frequency table for the latent class indicator model is too large”). Footnote 3
Under (a), the following statistics provided information about relative fit: Bayesian Information Criterion (BIC; Schwarz, Reference Sclove1978); Consistent Akaike’s Information Criterion (CAIC; Bozdogan, Reference Bozdogan1987); Approximate Weight of Evidence Criterion (AWE; Banfield & Raftery, Reference Banfield and Raftery1993); and Sample size adjusted BIC (aBIC; Sclove, Reference Shepherd and Ainsworth1987). Each of these criteria take into account the fit of the model using log-likelihood values whilst penalizing for model complexity (Masyn, Reference McLachlan and Peel2013). Additionally, as the models with successive numbers of latent classes are nested, likelihood ratio tests can be used to compare two competing models. The LMR (Lo–Mendel–Rubin adjusted likelihood ratio test) compares the improvement in fit between models with adjacent numbers of classes (Lo et al., Reference Marcoulides, Heck and Teo2001). This measure provides a p-value, with a significant value suggesting that a greater number of classes are required in the latent variable.
Evaluations of class enumeration under (b) are only considered for models that have already been shown to reach a reasonable level of fit under (a); good class separation in itself does not indicate an overall well-fitting model (Masyn, Reference McLachlan and Peel2013). Average class probabilities (AvePP) provide a measure of the certainty with which model can predict membership of each class (Collins & Lanza, Reference Collins and Lanza2010). High classification certainty in the model, yields AvePP near 1 with values above 0.7 considered to indicate adequate precision in class assignment (Nagin, Reference Netemeyer2005). Additionally, as the accuracy of class allocation increases, so do the odds of correct classification ratio (OCC; Nagin, Reference Netemeyer2005). Values above 5 indicate good separation and class assignment (Nagin, Reference Netemeyer2005). Finally, entropy is a standardized index of model-based classification accuracy which ranges from 0 to 1, with values approaching 1 indicating favorable delineation of the classes (Celeux & Soromenho, Reference Celeux and Soromenho1996). The usefulness of entropy lies in highlighting problems with a model, rather than endorsing a particular model choice (Masyn, Reference McLachlan and Peel2013). It is reported in the current analysis as an indicator of the suitability of a solution, rather than a selection criterion.
Before moving on to discuss the results, a summary of the analytic steps is given in Table 1.
TABLE 1. Summary of analysis steps and aims

Results
Descriptive statistics
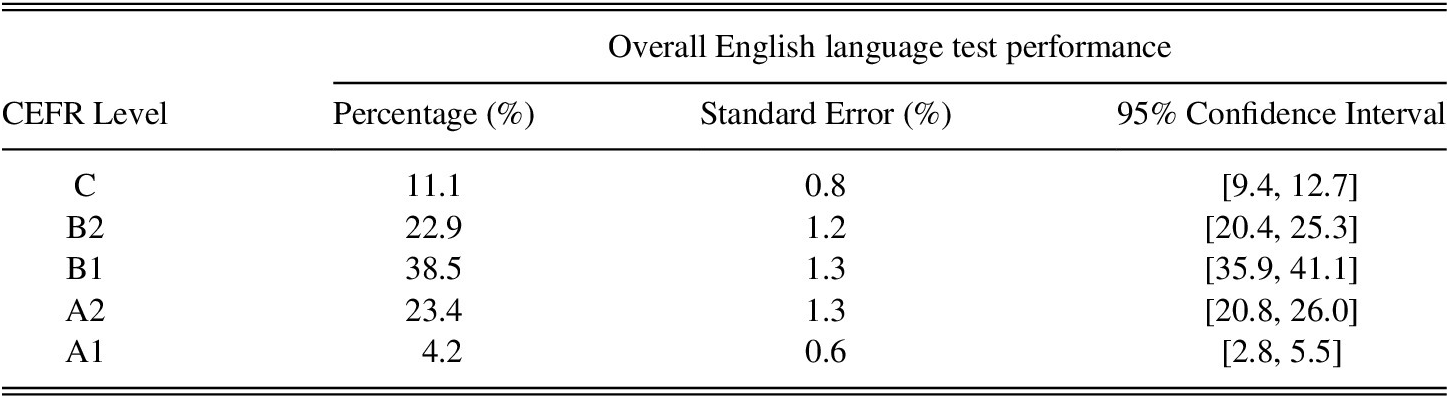
The participants displayed a wide range of proficiency levels as evidenced by their overall Aptis test performance (see Table 2). The majority of participants were between A2 and B2.
TABLE 2. Distribution of student population for overall test performance by CEFR level (Shepherd & Ainsworth, Reference Taguchi, Magid, Papi, Dörnyei and Ushioda2017, p. 44)
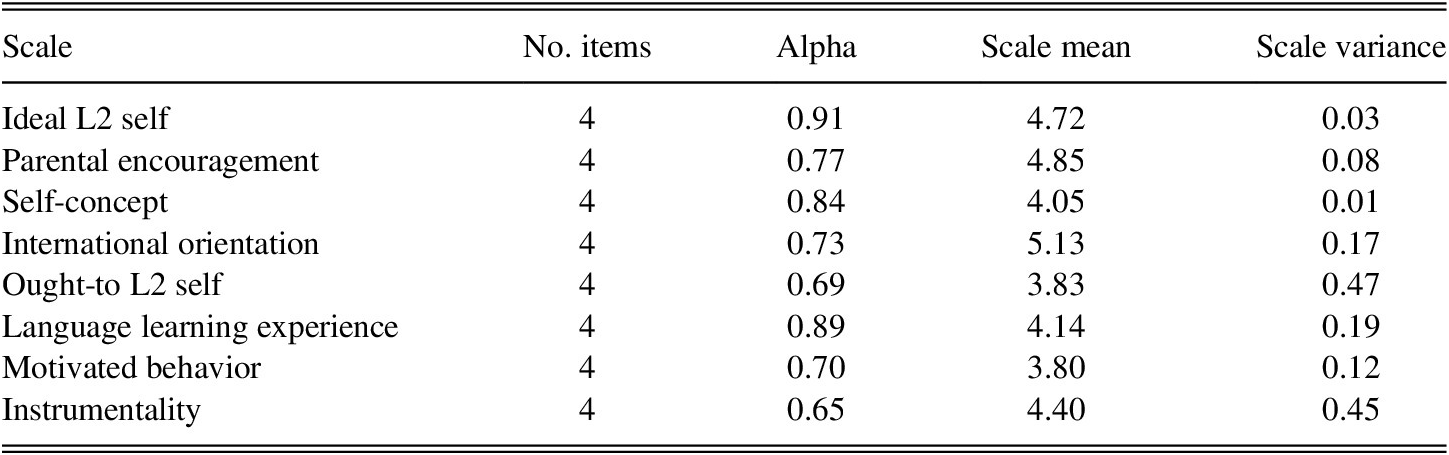
Responses to the motivation questionnaire tended, as expected, toward negatively skewed distributions (i.e., leaning toward agree/strongly agree). There was nonetheless a good variation in the options selected, with standard deviations of 1 or more for most items. Alpha statistics ranged from reasonable (>0.6 for instrumentality; ought-to L2 self) to very good (>0.85 for ideal L2 self; language learning experience). Table 3 summarizes the descriptive statistics.
TABLE 3. Scale statistics for the motivation questionnaire
Measurement model
The CFA analysis of the motivational responses reflected the questionnaire design, eight correlated latent traits each with four items loading onto them were tested. The path diagram is shown in Appendix A. This structure displayed reasonable fit statistics (CFI = 0.930; TLI = 0.920; RMSEA = 0.051 [0.049, 0.053]). This analysis was carried out by the authors as part of a previous research project and is reported in full elsewhere (Shepherd & Ainsworth, Reference Taguchi, Magid, Papi, Dörnyei and Ushioda2017). Footnote 4 Table 4 summarizes the extent to which each latent variable incorporated in the measurement model accounts for variance in the observed response data, plus the reliability of the constructs (Netemeyer et al., Reference Nylund, Asparouhov and Muthén2003) and coefficient H (Hancock & Mueller, Reference Iwaniec, Csizér and Magid2001). There is some variation between traits, but overall, it was concluded that the questionnaire gave a reasonable reflection of the eight distinct motivational latent traits with all values above 0.7.
TABLE 4. Summary statistics for latent motivation constructs in the measurement model

† Calculations made using online tool from Weiss (Reference Yashima2011).
Factor mixture model
Having established the viability of the measurement model to derive the continuous latent variables representing each of the motivational traits, this section describes the process by which the final FMM was arrived at, with the focus of analysis being on the number of classes incorporated in the latent categorical variable.
Whilst the structure of the model is hypothesized in Figure 1, the exploratory nature of the modeling applied in this study means that no explicit hypothesis is tested regarding the number of latent classes to incorporate in the model. Rather the starting point for this exercise was to hypothesize some differences in the motivation and proficiency relationship within the total sample, to which end a two-class model is tested against the one-class model (i.e., a homogeneous population). The number of classes was then increased across successive models until it was clear that adding further classes did not make a statistically significant improvement in the model. In total eight models were run, each incorporating a single latent categorical variable with one to eight classes, respectively. No other element of the model changed between the successive models.
The comparative statistical qualities of the models are described in the following text. It was not possible to derive a measure of overall fit because the software was unable to compute the chi-square test, Footnote 5 however given known sensitivities to large sample size, the chi-square test is likely to have been of limited value. Model evaluation and comparison therefore starts with assessing relative fit for all models, followed by an examination of information about class enumeration for a select range of models. This broadly follows the recommendations given by Masyn (Reference McLachlan and Peel2013). In reaching the final model, statistical findings are evaluated alongside theoretical insights from previous studies.
Relative model fit
Examining the figures for relative model fit provided by the information criteria estimates shown in Table 5, it can be seen that, following a steep drop for all criteria between 1 and 2 categories in the latent variable, the estimate continues to reduce as the number of categories increase, albeit with smaller increments, until a rise between seven and eight categories. Table 6 shows the Approximate Correct Model Probabilities (cmP_A; Masyn, Reference McLachlan and Peel2013) based on the Schwarz Information Criterion (SIC [−0.5 BIC]; Schwarz, Reference Sclove1978) that gives a comparative probability that each model is the correct model based on all models under consideration. These figures suggest that the 7-class model has the edge over models containing other numbers of latent classes, though the distinction is only marginal. This initial information would suggest that a latent variable incorporating up to seven categories would be statistically beneficial to the model, however from five categories onward, marginal gains become negligible (see Figure 2).
TABLE 5. Model comparison: Information criteria

TABLE 6. Approximate Correct Model Probabilities, comparing models including 2–8 classes


Figure 2. Elbow plot mapping information criteria estimates for successive models.
Although the IC-based evidence presented in the preceding text indicates that model improvements are derived up to the inclusion of seven categories in the latent variable, the p-value associated with the LMR becomes nonsignificant with the addition of the sixth category. See Table 7 for full details.
TABLE 7. Model comparisons: Likelihood ratio tests

Class enumeration
In considering class enumeration across a restricted range of models, the relative entropy indicates that there are no problematic classifications in any of the models, as all are above .9. However, this averaged figure can mask latent class assignment error for specific individuals in the data. In comparing the AvePP for each model shown in Table 8, it is notable that the model incorporating the 5-class latent variable sees the most even dispersal of probabilities across classes, each clustered around .95. There is greater variation in classification probability for each of the other models listed. This pattern is also reflected in the OCC estimates shown in Table 9.
TABLE 8. Relative entropy and average latent class probabilities for most likely class membership for models incorporating 4–7 latent categories

TABLE 9. Odds of correct classification ratios (OCC) for models incorporating 4–7 latent categories

Overall, having considered the evidence presented in the preceding text, the statistical indicators suggest that the latent categorical variable should incorporate at least five latent classes, with potential gains from including as many as seven. To make the final decision on class number, estimates for each of the three models were compared, and the relative value of the substantive insights considered.
With respect to the language skills profile, the 5-, 6-, and 7-class models all revealed classes of students that fell into one of two strata of achievement, higher and lower. Without having the space to go into full details, it was determined that the 5-class model reflected a core set of relationships between proficiency and motivation, with the 6- and 7-class models adding shades of distinction to this with respect to relationships with individual motivation traits. In this respect, the additional classes in the 6- and 7-class models were understood not to reflect substantively distinct categorizations of learners. The decision was taken therefore to move forward with the 5-class model. Incorporating five classes in the categorical latent variable reflects the class enumeration settled on in the previous motivation studies discussed in the preceding text; it also represents the most parsimonious of the statistically acceptable options in the current modeling exercise, thus avoiding overly convoluting the interpretation. The discussion of the results in the text that follows takes a closer look at the pattern of language test scores and motivation factor scores for students in each class.
Substantive findings
The final model incorporating five classes in the latent categorical variable was created. To reach a stable solution (McLachlan & Peel, Reference Michaelides, Brown, Eklöf and Papanastasiou2000; Muthén & Muthén, 1998–2017) the number of random starts was increased to 2,000 (from the software default of 20). With this number of starting values, the best log-likelihood was replicated 30 times. This gave a good indication that localized solutions were avoided, important given the complexity of the model under consideration. The estimates from this model are given in the following text. Table 10 shows that there is a reasonable representation across the sample of all five classes, with class 1 having the fewest members and class 4 the greatest.
TABLE 10. Class counts and proportions

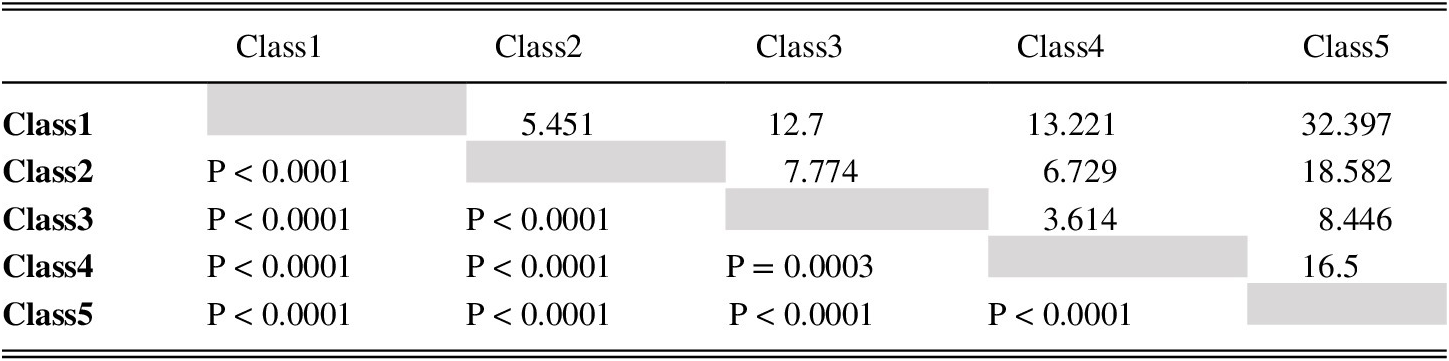
Mean scores across each of the language subskill tests and for each of the motivational traits are given in Tables 11 and 13, with Figures 3 and 4 depicting these estimates visually. The mean scores for the language skill tests are out of a possible total Footnote 6 of 50. Figure 3 shows two strata of achievement, with a reasonably wide separation between classes 4 and 5, and classes 1, 2, and 3. The distinction in performances for classes 1, 2, and 3 is marginally greater for productive than for receptive skills. A Kruskal–Wallis test indicates that the overall differences in L2 proficiency between classes is significant (p < .001), with Mann–Whitney U tests indicating significant differences between each pair of classes for each skill area (nonparametric tests were used owing to violation of the normality assumption). However, whilst these mean score differences are significantly different, with respect to overall English language ability, it should be acknowledged that the abilities represented in each class encompass a reasonably large ability range as shown by the overall CEFR level by class in Table 12. This also plays out at the individual skill level, please see Appendix B for details.
TABLE 11. Mean observed scores for language skill tests by class


Figure 3. Mean Aptis scale scores by class.
TABLE 12. Count of overall CEFR level by class

TABLE 13. Mean factor scores for motivational traits by class

1 Reference category.
Motivational trait levels are given as unweighted factor scores derived from the model, calculated in Mplus using expected a posteriori (EAP) estimation. It should be also noted that the scale of the factor scores bears no relationship to the original scale of the response options, but rather is determined within the statistical model. The mean of the factors for class 5 are fixed to zero for identification purposes and to set the metric of the factor distribution (Clark et al., Reference Clark, Muthén, Kaprio, D’Onofrio, Viken and Rose2013). Factor scores for each trait for the other classes of students should therefore be interpreted in relation to the baseline provided by class 5, with the chart in Figure 4 to be understood as showing the points of departure of the first four classes from the reference category, class 5. Note this does not mean that class 5 had uniform motivation levels because the estimation of factor scores for each trait are independent of each other.

Figure 4. Mean factor scores for motivational traits by class.
Figure 4 emphasizes differences in the relative degree of differentiation between classes across each trait. It is notable that much greater separation occurs between classes for the internalized traits of motivation: ideal L2-self, self-concept, and language learning experience. The traits with the closest estimates between groups are the external motivating factors of ought-to L2 self and parental encouragement.
Nonsignificant differences between trait levels are only observed in the following:
-
- International orientation: class 2 and class 4 (p = 0.613)
-
- Parental encouragement: class 2 and class 4 (p = 0.389); class 3 and class 5 (p = 0.520)
-
- Self-concept: class 3 and class 4 ( p= 0.866)
-
- Ought-to L2 self: class 2 and class 4 (p = 0.556); class 3 and class 5 (p = 0.691)
-
- Motivated behavior: class 2 and class 4 (p = 0.423)
The remaining factor score means each varied significantly at the 5% level between classes for each trait. A full report of the t-statistics and p values is given in Appendix C.
A key point to note from Figures 3 and 4 is that whilst the highest and lowest performing classes report the highest and lowest levels of motivation across all traits respectively, the interim classes do not follow a pattern linking proficiency to motivation in a straightforward fashion. Conspicuously, class 3, the higher performers in the lower strata, have the second highest levels of motivation, followed by high achievers in class 4. This switch between classes 3 and 4 would not have been detected in an analytic approach that assumed homogeneity in the motivation/proficiency relationship across the full sample.
Discussion
This is the first study to incorporate L2 skills measured by a robustly validated test of English language into profiles of language learning motivation. As well as demonstrating the motivational traits that separate students of differing proficiency levels to the greatest extent, the study can be viewed as a solid addition to the body of evidence providing support to the L2MSS. The value of using profile analysis to gain insights into the relationship between language learning motivation and proficiency is established under rigorous methodological conditions. In particular, by questioning the assumption of linearity in the relationship between motivation and proficiency variables made in previous correlational studies, the person-centered approach employed here reveals that this does not apply in all cases. A distinct and sizable group of students were shown to violate this pattern (class 3; 15% of students). In a variable-centered correlation analysis the contribution of these class 3 learners would have weakened the relationship but would not have refuted the overall picture. This highlights the sensitivity of the profiling methodology to nuances in the data that may have been overlooked.
Each latent class in the statistical model defines a group of students who exhibit commonalities with respect to the motivation and proficiency scales, each with straightforwardly interpretable characteristics. To this end we have been able to understand the five classes in the following broad terms: class 5 as high-flying; class 4 as coasting; class 3 as aspirational; class 2 as ambivalent; and class 1 as uninvested. Further details of this taxonomy are given in the following text. It should be highlighted for clarity that these classes of learners have been identified based on their pattern of responses, rather than hypothesized a priori. Employing this profiling approach opens options for understanding more clearly how and where policy intervention would be best targeted, by fully engaging with the distinguishing features of the learners in each group.
Learner profiles
Five motivation-proficiency profiles were identified amongst the sample of teenage language learners in Madrid. The results bear some similarities to studies profiling language learning motivations (Csizér & Dörnyei, Reference Csizér and Dörnyei2005; Kangasvieri, Reference Kim, Kim, Csizér and Magid2017; Papi & Teimouri, Reference Peal, Lambert, Gardner and Lambert2014; Yun et al. Reference O’Sullivan, Dunlea, Spiby, Westbrook and Dunn2018), in which multiple motivational profiles were identified. The current study therefore provides support for the perspective that learner motivation can be better understood in terms of a range of distinct motivational profiles, with the additional value of coalescing this approach with information about L2 skill levels. In doing so, we were able to show that increases in motivational trait scores are not always matched with a straightforward increase in L2 proficiency. In this section we discuss the classifications that emerge under this person-centered approach, and the characteristics of learners within each.
Students in class 1 unfailingly scored lowest on all the measures of both proficiency and motivation. As a result, this smallest class of students (10% of the sample; Table 5) can be referred to as “uninvested” learners. Students in class 2 (24% of the sample) have slightly higher proficiency than uninvested students and displayed somewhat higher levels of motivation. Because both their motivation and proficiency are still on the low side, these learners can be referred to as generally “ambivalent.” These uninvested and ambivalent classes of students can be contrasted against students in class 5, the “high-flyers.” High-flyers (23% of the sample) are characterized by the highest levels of proficiency of all classes and declare highest average motivation on six out of eight motivational variables.
To this extent, these findings are similar to those of the other studies (Csizér & Dörnyei, Reference Csizér and Dörnyei2005; Kangasvieri, Reference Kim, Kim, Csizér and Magid2017; Papi & Teimouri, Reference Peal, Lambert, Gardner and Lambert2014; Yun et al. Reference O’Sullivan, Dunlea, Spiby, Westbrook and Dunn2018) who also identified a clear separation between a group of very low and very highly motivated learners across all traits. More specifically, the high-flyers bear resemblance to the Yun et al.’s “thrivers,” with their exceptionally strong motivation, and the low motivation of ambivalent and uninvested learners are similar to the “dependent” profile from Yun et al.’s study. However, given some salient differences in the nature of the traits between the current study and that of Yun et al., it is not possible to draw direct comparisons.
Learners in class 4 (just under 28% of the sample) achieved relatively high levels of proficiency yet displayed only moderate motivation levels. On four of the motivation traits (international orientation, parental encouragement, ought-to L2 self, and motivated behavior), mean factor scores of students in this class are not significantly different from those of the ambivalent (class 2) class of learners. Additionally, although statistically significant, the numerical differences between these two classes for language learning experience and instrumentality are not large. Class 4, therefore, despite having good proficiency levels in English, could be described as not particularly engaged with the benefits of learning English, and perhaps “coasting” along. This bears resemblance to the finding reported by Hessel (Reference Al-Hoorie2017), who reported that upon reaching a relatively high level of productive proficiency, some learners may lose the motivational impetus for further study. In contrast to class 2 however, class 4 students tend to hold more robust visions of themselves as language learners, perhaps unsurprisingly given their higher achievement levels.
Students in class 3 are the most “aspirational” group of learners in the sample. They have, on average, slightly higher proficiency than those in classes 1 and 2, yet they exhibit comparatively far stronger motivation to learn English. In comparison to the high-achieving class 4 meanwhile, their motivation levels were higher on all bar one of the eight traits. The exception being the English self-concept scale, for which there was no significant difference between these two classes. It is also noteworthy that the aspirational learners in class 3 also reported the highest average levels of parental encouragement and ought-to L2 self of all classes.
Whilst the levels of motivation and proficiency of students from classes 1, 2, 4, and 5 largely rise in tandem, suggesting a positive relationship between motivation and proficiency, the emergence of the aspirational class 3 breaks this trend and adds complexity to the picture. One explanation could be that these students have a strong desire to learn English, but not the same access to resources to realize this vision. However, the fact that students in class 3 were attendant at a full range of schools in the sample indicates that this may be an overly simplistic interpretation. Indeed, it could be that these students have experienced a recent surge in motivation, the effects of which can be only accounted for in the future. In some respects, this group of students resembles the Indonesian learners of English interviewed by Lamb (Reference Lambert, Gardner, Barik, Tunstall, Gardner and Lambert2013), who were highly motivated, but of limited proficiency, with their future vision being almost “dreamlike” in nature. This temporal dimension represents a key complication in modeling the relationship between motivation and proficiency in a cross-sectional study. Where the proficiency levels represent the current ability of the participants in the L2 language, the motivational traits encompass a wider temporal domain. The situation with the learners in class 3 might be that they will go on to make much stronger progress than their peers in classes 1 and 2, but it is not possible to say from the current findings. The relatively greater prowess in productive skills compared to other classes in the lower strata of ability (classes 1 and 2) might be indicative of this incipient progression. For these aspirational learners, the relatively higher levels of productive skill performance, particularly speaking, is perhaps already reflective of this desire to use English to communicate, as expressed in their strong international orientation and understanding of the instrumental value of English.
The relationship between motivation and proficiency
This section examines more closely how the findings compare to existing understanding of the motivation-proficiency relationship as presented in exiting SLA studies. As observed above with respects to Figures 3 and 4, certain motivational traits separate classes of students to a larger extent than others. The traits displaying the most exaggerated gaps between classes of the learners with the highest and lowest English language proficiency are ideal L2 self, English self-concept, and language learning experience. This pattern indicates that these motivational traits play a key role in differentiating students at differing proficiency levels, although the profiling approach has helped us to emphasize why these relationships are not best expressed as straightforward correlations (see discussion regarding aspirational learners in class 3 in the preceding text). The findings from this study are broadly consistent with those reported by Kangasvieri (Reference Kim, Kim, Csizér and Magid2017) who also found that variables of self-concept and ideal L2 self to be robust differentiators between learners, and Al-Hoorie (Reference Shavelson, Hubner and Stanton2018) whose meta-analysis pointed to the positive role played by ideal L2 self and language learning experience in developing proficiency. In addition, Papi and Teimouri (Reference Peal, Lambert, Gardner and Lambert2014) reported the same for ideal L2 self and language learning experience.
The finding that language learning experience acts as an important differentiator between high and low proficiency students is in line with those of Lamb (Reference Lamb2012), who showed that learning experience in school could explain variance in the results of a proficiency test. This is the only other study to report links between language learning experience and proficiency. However, more broadly, previous literature has pointed to a close relationship between language learning experience and measures of effort investment (Csizér & Kormos, Reference Csizér, Kormos, Dörnyei and Ushioda2009; Ryan, Reference Saito, Dewaele, Abe and In’nami2009). Whilst this is not a direct association, such observations do imply that positive language learning experience is associated with a mindset that will engender heightened proficiency.
A similar second-order influence on proficiency can be found in the literature with respect to the relationship between ideal L2 self and students’ reported effort investment (see for example Iwaniec [Reference Dörnyei and Chan2014]; Csizér and Kormos [Reference Csizér, Kormos, Dörnyei and Ushioda2009]). These findings lend some credence to the more direct relationship between ideal L2 self and L2 proficiency reported here. However, this relationship is not clear-cut, for although our findings were in accordance with results reported by Saito et al. (Reference Schwarz2019), these findings contradict those of an earlier study from Moskovsky et al. (Reference Muthén, Hancock and Samuelson2016). Such discrepancies might well be ascribed to the differences between the contexts, or measures applied. The robust sampling methodology and comprehensive range of language proficiency measures incorporated in the current study make it a good baseline for future comparisons.
One key insight to be gleaned from the findings of the current study is that the ought-to L2 self does not appear to play a crucial role in determining language learning proficiency amongst this learner population, as there were no marked variations in the level of this variable between the five classes. A similar finding was made for the other externalized motivation trait: parental encouragement. It appears that the perception of the importance of English as communicated by important others has limited motivational properties for teenage learners in Madrid. This finding is in accordance with previous studies, most of which agreed about a lack of clear relationship between the ought-to L2 self and attainment (Al-Hoorie, Reference Shavelson, Hubner and Stanton2018; Lamb, Reference Lamb2012; Moskovsky et al., Reference Muthén, Hancock and Samuelson2016; Saito et al., Reference Schwarz2019; for exceptions see Papi et al. [Reference Papi, Bondarenko, Mansouri, Feng and Jiang2019], who found clear links between ought-to L2 self/own and motivated behavior in the ESL context of the United States).
Interestingly, the findings point to a weaker link between the measures of effort investment, as conveyed by the motivated behavior scale, in affecting English language proficiency, than the ideal L2 self and proficiency. This perhaps can be attributed to the “hybrid attributes” (Dörnyei & Ushioda, Reference Dörnyei and Ushioda2011) of the ideal L2 self, which is not only affective by nature but is also likely to have a cognitive component. An example of this is that the learner makes judgments on how plausible achieving their vision is. It is also possible that the comparatively weaker role for effort investment as reported in this study relates to a possible interference of other variables on the quality of effort that the Spanish students invest in language learning, such as language learning aptitude, the use of language learning strategies, or the degree of autonomy and self-regulation, for which the current model does not account.
Finally, the two language learning goals investigated in this study, international orientation and instrumentality, are shown to have a moderate potential to differentiate between students of varying proficiency. This finding is unsurprising, as the two goals are long term and need to be translated into a series of smaller goals to sustain motivation (Ford, Reference Ford1992). Although their motivational properties are not as strong as when the goals are integrated into a robust vision of themselves in the future, taken together, our finding suggests that they are more likely to contribute to proficiency than external pressures from parents and society.
Conclusion
This study identified five heterogeneous classes of learners amongst a representative sample of teenage language learners in the Madrid region. From the “ambivalent,” “uninvested,” and “coasting” students to the “aspirational” learners and the “high-flyers,” these students displayed a wide range of attitudes toward English language learning reflected in equally varied levels of proficiency. The value of taking a person-centered profiling approach to the analysis was that it was able to demonstrate that whilst there is undoubtedly a connection between motivation and proficiency, it is not a straightforward correlation.
The study contributes to a body of research that aims at substantiating Dörnyei’s (Reference Dörnyei2005) L2MSS. The majority of such studies have examined the relationship between the three main constructs of the L2MSS—ideal L2 self, ought-to L2 self, language learning experience—and measures of effort investment. The current study extends this by investigating links with proficiency for these three constructs and proficiency, plus motivated learning behavior. Similar to the previous research, our findings confirm the important role of the ideal L2 self and the learning environment in motivating English language learning. In contrast, our findings point to the limited potential of the ought-to L2 self in motivating 15-year-old Spanish students to learn English. At the same time, we have shown that employing additional motivational constructs can enrich our understanding of how motivation and proficiency are related. Of most importance here is the English self-concept, which differentiates clearly between participants of different proficiency levels. Traits indicating the extent to which learners identify with language learning goals (international orientation and instrumentality) provided additional insight, spanning a middle ground between the strong role of internalized traits and the weak role identified externalized traits. In contrast, including the parental encouragement scale strengthened the conclusion that external pressures with which the learners do not identify are of little motivational value for the Spanish teenagers.
This study makes a key contribution to research into SLA motivation by demonstrating the need to move away from the assumption of a uniform relationship between motivation and proficiency for all groups of learners. The person-centered approach side-stepped this assumption, thus providing the opportunity for a more intricate picture of the dynamic to emerge. This lays the groundwork for future research into different classes of language learners based on their motivation and proficiency. However, whilst there is a consensus that different motivational profiles of learners exist, little is known about why these profiles develop. In particular, investigations that account for the existence of “aspirational” learners who are highly motivated, yet with relatively low proficiency, are necessary. Similarly, research into “uninvested” learners could help us better understand what makes learners relatively successful, despite modest levels of motivation.
Motivation is one of many variables that interact with others in a dynamic way during the process of language learning. One limitation of this study is that other individual differences (e.g., personality) that could potentially have shed more light on the results were not included in the analysis. Another source of weakness in this study is the fact that the measures were taken at a single moment in time. Although it can be broadly assumed that the participants’ proficiency was increasing with time, the participants’ might have experienced fluctuations in their levels of motivation. A longitudinal design would be helpful in a more intricate unraveling of the relationship between motivation and proficiency. Additionally, the two-stage sampling approach was not explicitly accounted for in the analysis. Because the sample was clustered within a specified number of schools, this may have reduced variation in the dataset compared to a straightforward random sample, moving away from complete independence of observations between certain clusters of students. The shared educational experience of the students attending the same school may have engendered commonalities in motivation and proficiency relations. However, the school sample saw participation of 24% of the public schools within the Madrid region (169/707 schools), with between 8–12 students sampled at each school (mean number of students at each school: 10.5) (Shepherd and Ainsworth, Reference Taguchi, Magid, Papi, Dörnyei and Ushioda2017). Therefore, given this school coverage, and the already complex nature of the statistical model applied, it was decided to move forward with treating the data as a simple random sample for the purpose of this exploratory analysis. It should also be noted that the sampling approach applied is much less open to bias than smaller convenience samples often used for studies in this field.
The process of exploring motivation-proficiency profiles described in this article provides a new approach to unpicking this complex relationship. The value of this level of insight lies in the possibilities to highlight areas where educational and policy interventions could be of real benefit to learners; for example, it could be suggested that the aspirational class 3 could be most likely to benefit from positive interventions. This group is not an observed group of students classified by gender, school type, or social background, they are not picked out a priori for comparison, rather they are defined by the analysis. In taking the analytic approach that assumes commonalities in responses to language education not to necessarily be defined by such visible markers, this study shows how we as educationalists can break out of the usual comparative framework and make more astute appraisals of the situation.
Appendix A
Measurement model for motivational traits
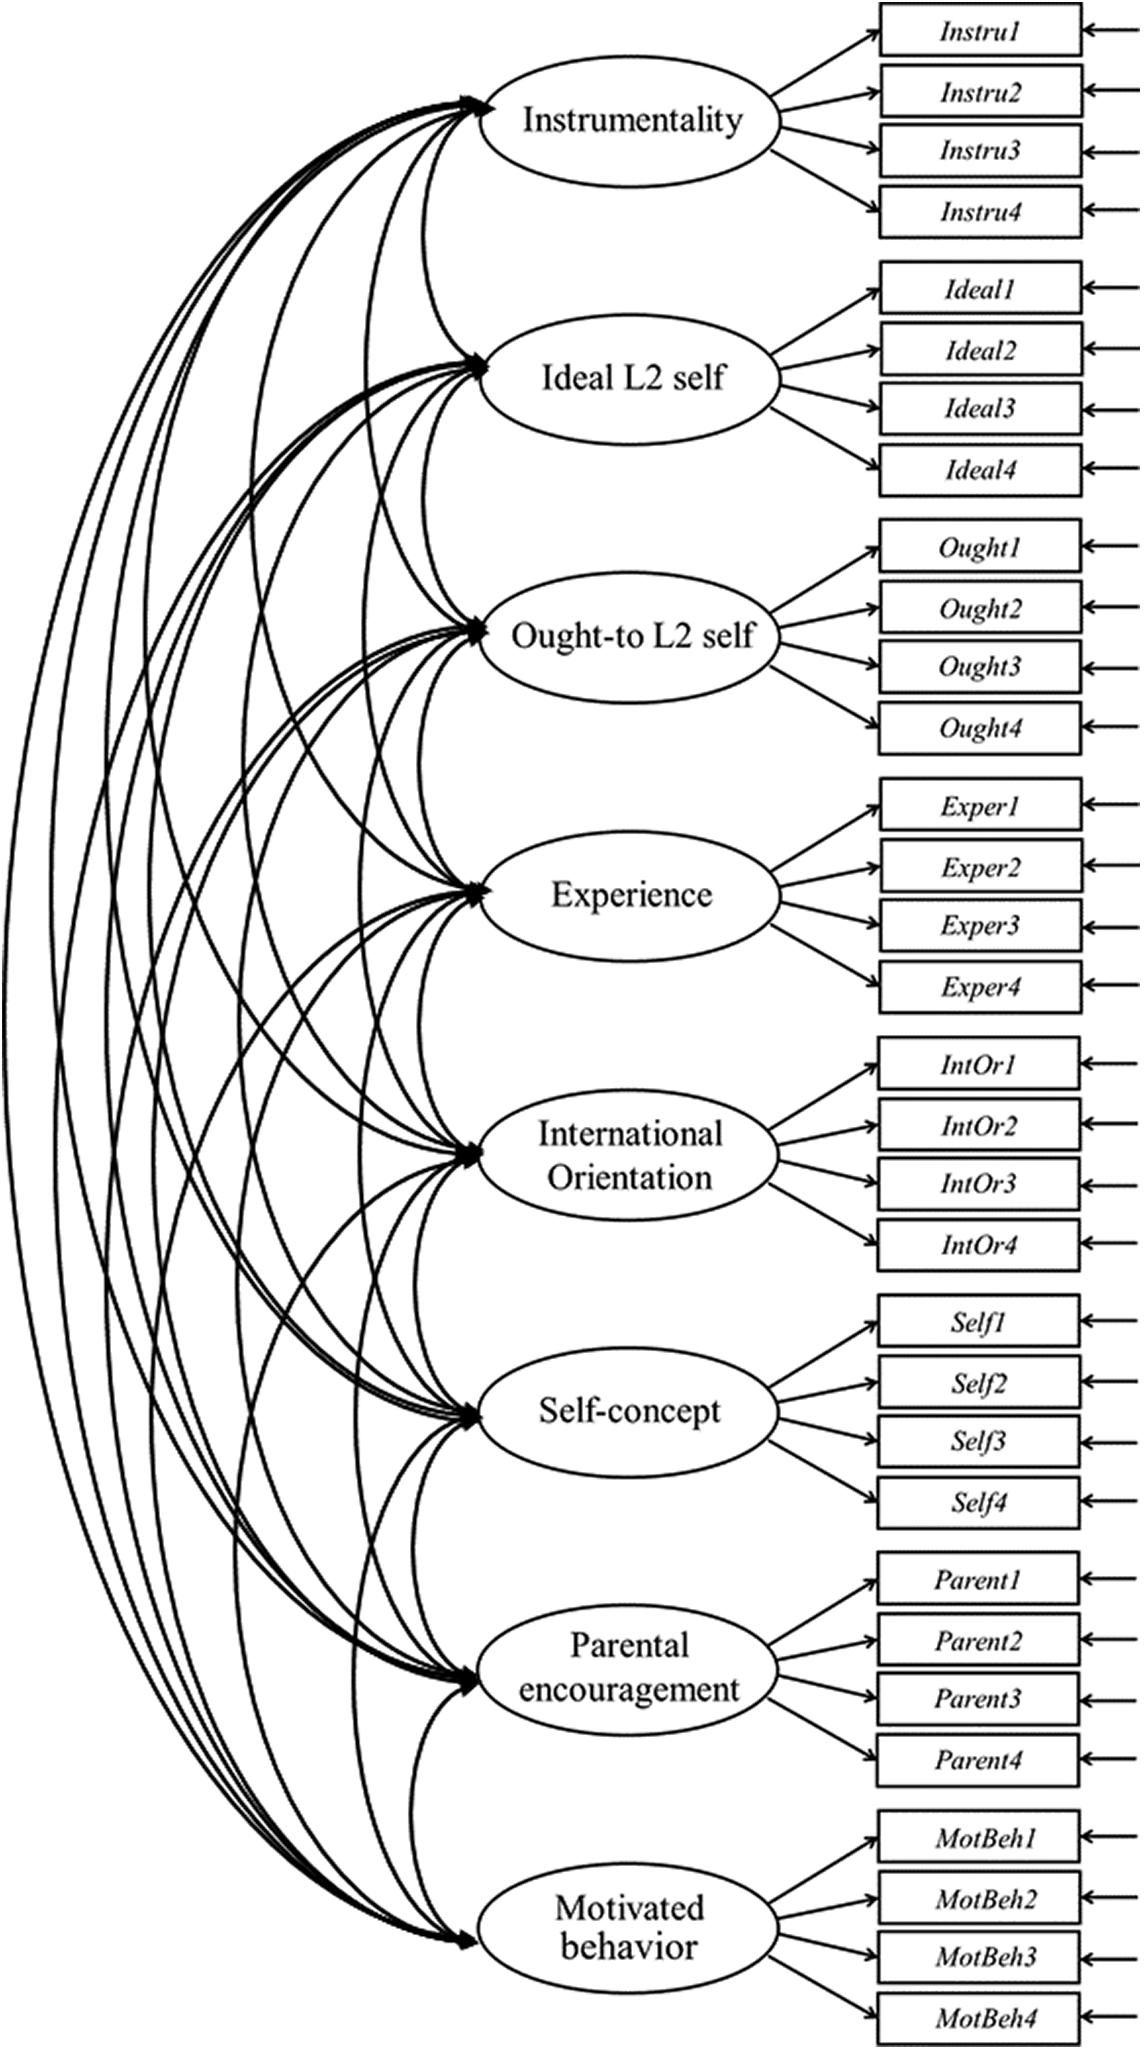
Figure A1. Measurement model for motivational traits.
Key to figure A1:
-
• Circles show the latent variables (motivational scales)
-
• Boxes show the observed variables (question responses)
-
• Double-headed arrows represent covariances between each of the latent variables
Appendix B
CEFR level breakdown by class for each skill areas
TABLE B1. Listening CEFR levels achieved by class
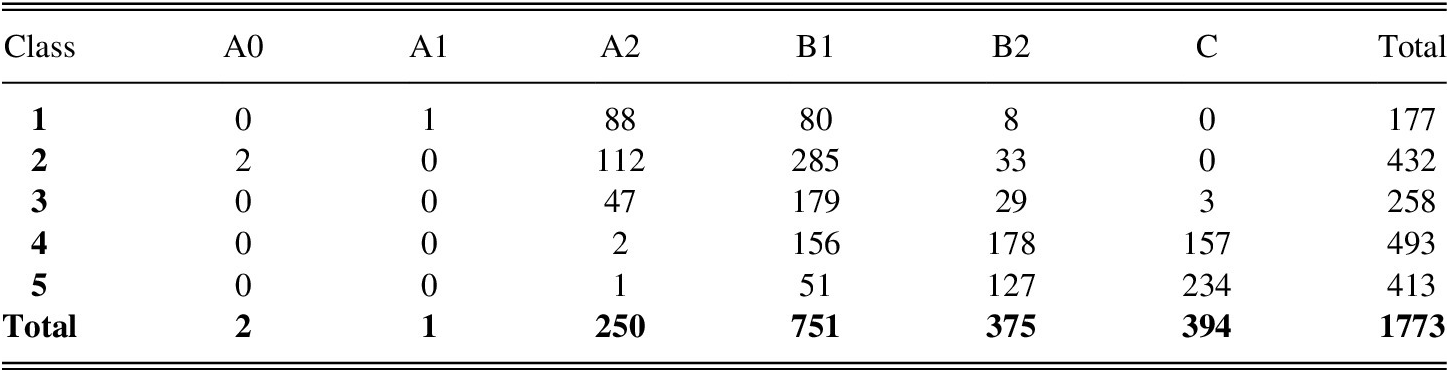
TABLE B2. Reading CEFR levels achieved by class
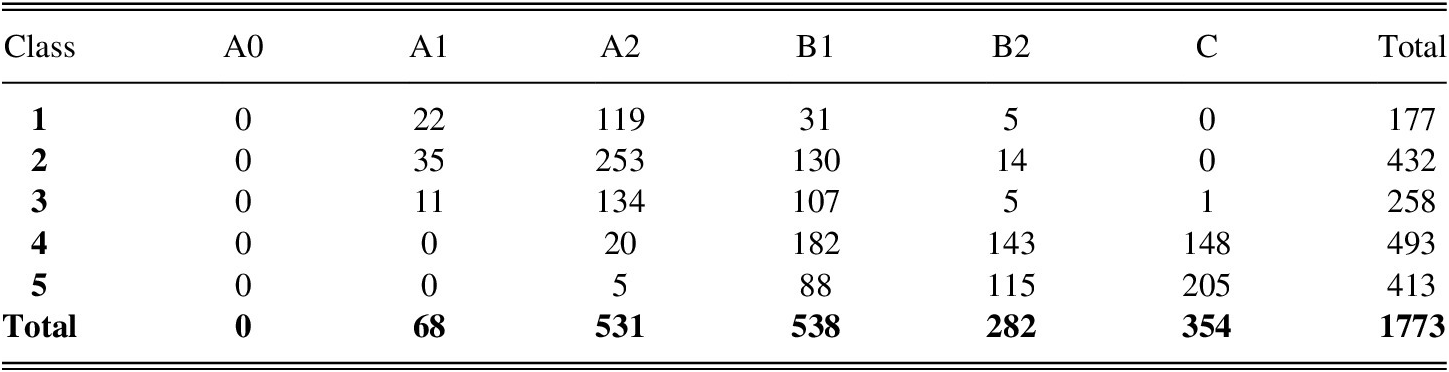
TABLE B3. Speaking CEFR levels achieved by class

TABLE B4. Writing CEFR levels achieved by class

Appendix C
Significance and t-statistics for comparison of trait scores between classes
TABLE C1. Factor 1—International orientation class comparisons

TABLE C2. Factor 2—Parental encouragement class comparisons

TABLE C3. Factor 3—Self-concept class comparisons

TABLE C4. Factor 4—Ought-to L2 self class comparisons
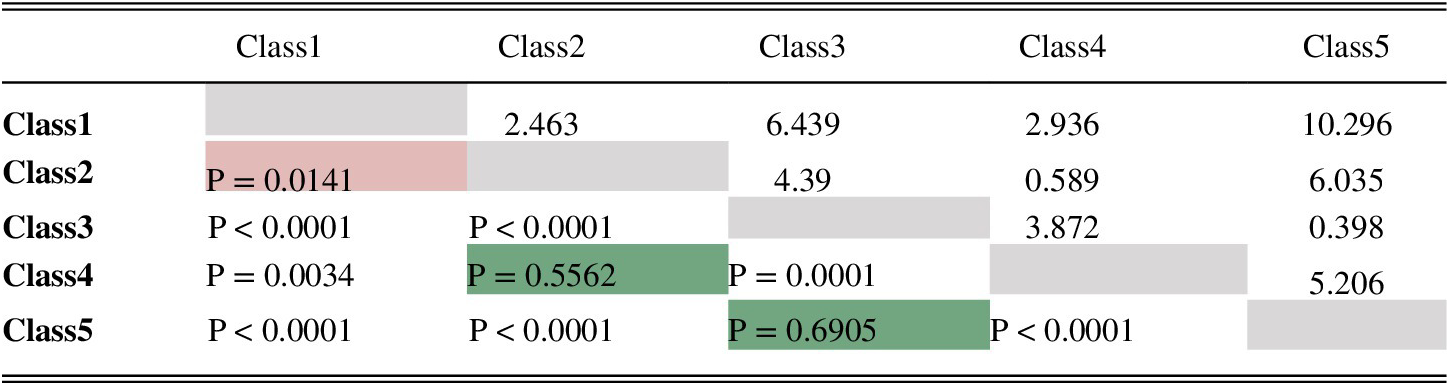
TABLE C5. Factor 5—Language learning experience class comparisons
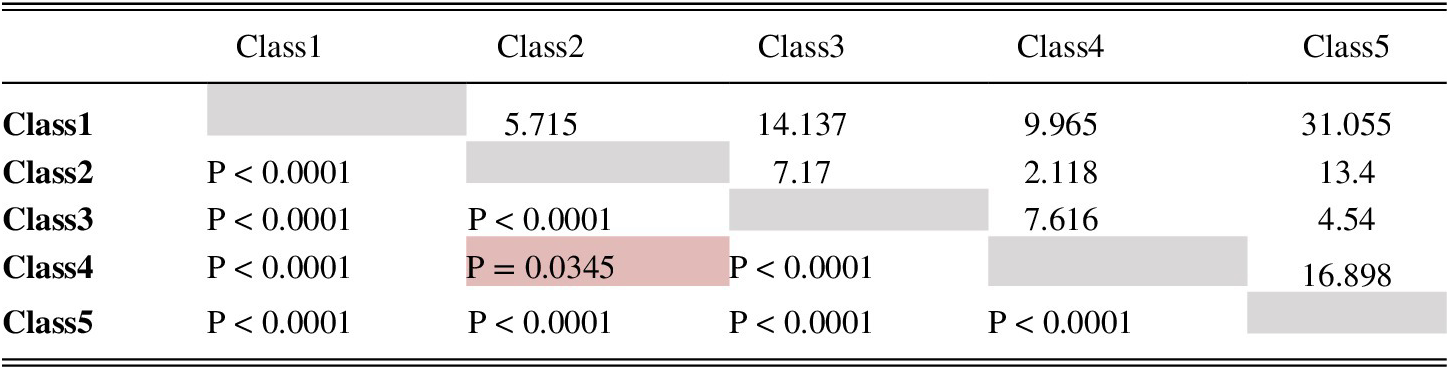
TABLE C6. Factor 6—Motivated behavior class comparisons

TABLE C7. Factor 7—Instrumentality class comparisons
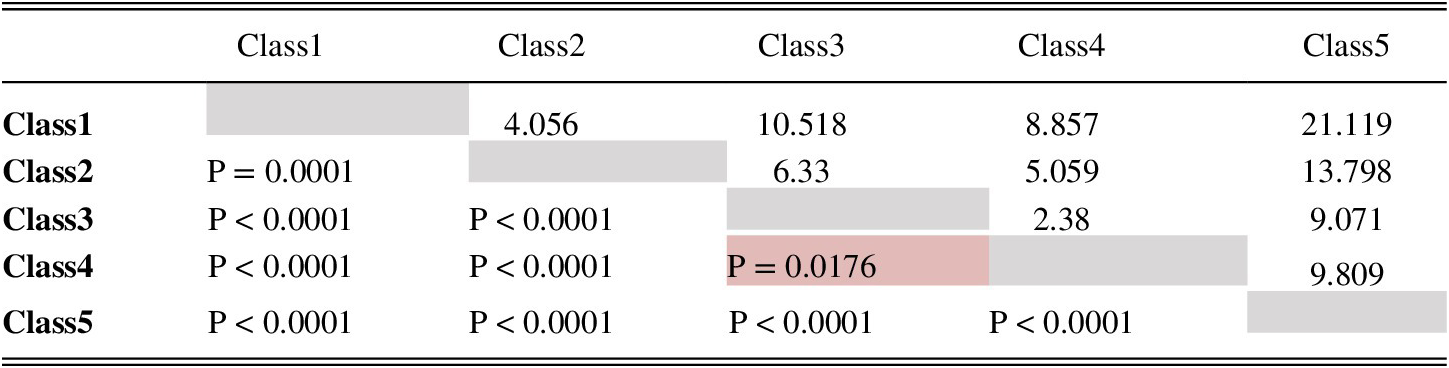
TABLE C8. Factor8—Ideal L2 self class comparisons
Appendix D
Mplus code


 Open access