According to the clinical practice followed in many countries worldwide, children’s growth and weight status is assessed via the use of national or (in the absence of national) international growth charts and relevant body-weight- and BMI-for-age cut-offs. In this context, the WHO Child Growth Standards for infants and children aged 0–5 years( 1 ) as well as the WHO Growth References for children and adolescents aged 5–19 years( Reference de Onis, Onyango and Borghi 2 ) are recommended for assessing populations of different ethnic backgrounds. Nevertheless, the WHO Growth References for children and adolescents aged 5–19 years derived from the reconstruction of the 1977 National Center for Health Statistics/WHO growth reference values, which were originally based on healthy, affluent populations before the outbreak of the obesity epidemic. This possibly explains the deviations observed for body weight and BMI distributions when populations of healthy Asian children were assessed using the relevant WHO reference values( Reference Zong and Li 3 , Reference Natale and Rajagopalan 4 ). Further to indigenous Asian population groups, similar deviations in BMI compared with the WHO Child Growth Standards and Growth References have been observed in South Asian population groups of infants and children who were born and grew up in the Netherlands( Reference de Wilde, van Dommelen and Middelkoop 5 , Reference de Wilde, van Dommelen and van Buuren 6 ).
The implication of these deviations is whether the WHO Child Growth Standards and Growth References are appropriate to be used as reference growth standards for all infants, children and adolescents worldwide. Genetic and environmental variations in different population groups of infants, children and adolescents around the globe( Reference Freedman, Khan and Serdula 7 – Reference Prader, Largo and Molinari 10 ) are probably supportive of initiatives for developing new national growth standards. While data available from growth and nutrition assessment surveys conducted in the past in some South-East Asian countries could support the development of national growth standards, still most of these data are outdated and were collected before the economic transition occurring in the region( Reference Kosulwat 11 , Reference Noor 12 ). Taking this limitation into consideration, in 2010 the South-East Asian Nutrition Survey (SEANUTS) examined a large country-representative population sample of infants and children aged 0·5–12 years from four South-East Asian countries, namely Indonesia, Malaysia, Thailand and Vietnam( Reference Schaafsma, Deurenberg and Calame 13 ).
The present study aimed to: (i) calculate body-weight- and BMI-for-age percentile values using the relevant data collected from SEANUTS and a similar methodology also followed by WHO for developing the Child Growth Standards( Reference de Onis, Garza and Victora 14 ); (ii) investigate whether the pooled (i.e. including all countries) SEANUTS weight- and BMI-for-age percentile values can be used for all SEANUTS countries instead of developing and using country-specific ones; and (iii) examine whether the weight- and BMI-for-age percentile values developed from the pooled SEANUTS sample differ from the WHO Child Growth Standards and Growth References.
Methods
Sampling
The procedures followed in SEANUTS for recruiting children have been described in detail previously( Reference Schaafsma, Deurenberg and Calame 13 , Reference Le Nguyen, Le Thi and Nguyen Do 15 – Reference Rojroongwasinkul, Bao and Sandjaja 18 ). More specifically, the sampling procedure followed in Indonesia and Thailand was population-based, while in Malaysia and Vietnam recruitment of study participants was conducted in nurseries, kindergartens and primary schools. Stratification was performed according to the region of residence (i.e. urban v. rural region), while the (sub)regions in each SEANUTS country were also taken into consideration as clustering units. In this context, the more densely populated demographic units in each country were considered as the primary clustering units. Sampling was also weighted for the number of boys and girls per age group in each sub-region, so as to reflect the number of boys and girls at a national level, which finally led to the recruitment of 16 744 infants and children aged 0·5–12 years. All children exhibiting no signs of physical, mental or genetic disorders at the time of recruitment were considered eligible for participating in SEANUTS.
Power analysis
A detailed description of the statistical power calculation procedures followed in the present study for the sample size estimation is provided in previous publications of data derived from the SEANUTS study( Reference Schaafsma, Deurenberg and Calame 13 , Reference Le Nguyen, Le Thi and Nguyen Do 15 – Reference Poh, Ng and Siti Haslinda 17 ).
Data collection
The measurements conducted in all SEANUTS countries were based on standardized equipment and procedures to facilitate the comparability among countries of collected data. More specifically, prior to study initiation a central training was organized with the participation of researchers from all SEANUTS countries, having an expertise on nutrition and/or biomedical analysis. In this training, all researchers were familiarized with the objectives of the study and the sampling procedures, and were rigorously trained on anthropometric measurements, clinical assessment and interviewing techniques, so as to minimize intra- and inter-researcher variability. At a later stage, researchers were also trained on ‘data entry’ and ‘data cleaning’. The registration number of the SEANUTS study in the Netherlands Trial Registry (http://www.trialregister.nl/trialreg/index.asp) is NTR2462.
Anthropometric and body composition data
Body weight was measured using calibrated digital weighing scales to the nearest 0·1 kg, with the children in light clothing and without shoes. Standing height was measured with the use of a stadiometer or microtoise, to the nearest 0·1 cm, with children standing straight and bare-footed, having their heels, shoulders, back and buttocks touching the wall and keeping their head aligned to the Frankfurt horizontal plane. In infants and toddlers up to 2 years of age, recumbent length was measured to the nearest 0·1 cm with the use of a length board. Weight and height or length measurements were used to calculate BMI (weight/height2, kg/m2).
Left triceps, biceps and suprailiac skinfold thicknesses were measured with a Holtain skinfold calliper. The sum of these three skinfolds was then calculated. Waist circumference was measured at the level of umbilicus to the nearest 0·1 cm. Bioelectrical impedance analysis, conducted by Biostat 1500 MD, was used for the assessment of children’s fat mass levels. Participants were instructed to abstain from any food or liquid intake and from any intensive exercise for 4 h prior measurement and not to wear any metal object during measurement. The assessment took place with the children lying on a non-conductive surface at neutral temperature.
Family sociodemographic characteristics and children’s health status data
A set of questionnaires was used to collect data on family sociodemographic characteristics, such as parental educational levels and income, and children’s health status. Data were collected either via interviews conducted by researchers with parents or via administration of questionnaires to parents, who filled them out and returned the completed questionnaires to the local research team members. Parents or caregivers provided all necessary information for infants and children in the age range of 6 months to 9 years, while for children older than 9 years, information was provided both from children and their parents.
Data processing and exclusion criteria
All data collected from each SEANUTS country were entered on software specifically developed for this purpose (in the case of Indonesia and Thailand) or Epi Info (in the case of Malaysia) or EpiData 3.1 (in the case of Vietnam). Microsoft® Excel 2010 files, having a fixed format, were also used in all countries for a final data overview. In all study centres, the accuracy of data entry was cross-checked via the double entry by different researchers of at least 10 % of all collected data. Following data entry all data sets and digital information related to the study were uploaded on a secured website. Data sets were uploaded on a regular basis and through the website all data were always accessible to the research team members.
All data sets were also regularly inspected for typing errors, outliers and missing data. Typing errors were corrected appropriately, outliers were discussed with the representatives per country and corrected if feasible, while missing values were not included in the final analyses and evaluation.
To achieve comparability of the anthropometric data collected in SEANUTS with those collected in the WHO Multicentre Growth Reference Study (MGRS), the sampling in SEANUTS followed the same approach as WHO( Reference de Onis, Garza and Victora 14 ) to exclude socio-economically disadvantaged and/or unhealthy children. The exclusion criteria applied in SEANUTS are presented in detail elsewhere( Reference Rojroongwasinkul, Bao and Sandjaja 18 ). Detailed information on the exclusion criteria used in the present study to identify eligible children in all participating countries is also provided elsewhere( Reference Rojroongwasinkul, Bao and Sandjaja 18 ). The application of the exclusion criteria resulted in a final pooled SEANUTS sample of 14 202 children having full data on anthropometric indices, age and sex, as previously reported( Reference Rojroongwasinkul, Bao and Sandjaja 18 ). Considering that the average body weight and BMI levels in the excluded children (n 2364) were found to be significantly lower compared with the relevant average levels in the eligible children, this indicates that the exclusion criteria used in the current study were appropriate for excluding actual cases of infants and children with possible health and/or socio-economic constraints on their growth.
Statistical analysis
Smoothing methods
Cole and Green’s LMS method( Reference Cole and Green 19 ) was used in the present study to convert data to normality, minimize skewness of the data set (L), the median (M) and the coefficient of variation (S), and calculate body-weight- and BMI-for-age percentile (P) values. In this context, the ‘smoothed’ percentile values for body weight and BMI at P3, P5, P50, P95 and P97 were calculated for 14 202 children aged 0·5–12 years by sex and age using the LMS ChartMaker software (version 2.54). Prior to all calculations, the samples of Malaysia, Thailand and Vietnam were weighted using a weight factor of ‘2’ as a means of adjusting for the unequal sample sizes in the four study sites and avoiding the over-representation of Indonesia in the total sample. Additional information on the exact statistical procedures followed to extract the ‘smoothed’ percentile values can be found elsewhere( Reference Rojroongwasinkul, Bao and Sandjaja 18 ).
Assessment of body weight and BMI differences
The current study initially assessed the differences in the ‘smoothed’ body-weight- and BMI-for-age percentile values between (i) the pooled SEANUTS sample and the remaining pooled SEANUTS samples after successively excluding one SEANUTS country and (ii) the pooled SEANUTS sample and WHO growth reference values. The ‘standardized site effects’ (SSE) were calculated and used to assess these differences in body-weight- and BMI-for-age percentile values. In this regard, in the comparisons of WHO with the pooled SEANUTS data, the SSE were calculated by dividing the differences between WHO and pooled SEANUTS percentile values by the relevant WHO standard deviation. For instance, the formula used to calculate the SSE for body weight or BMI in the 95th percentile was the following:
The exact same procedure was also followed for calculating the SSE and conducting comparisons between the pooled SEANUTS sample and the remaining pooled SEANUTS samples after successively excluding one SEANUTS country. Absolute SSE values (
![]() $\left| {{\rm SSE}} \right|$
) of ≥0 to <0·2 were considered small;
$\left| {{\rm SSE}} \right|$
) of ≥0 to <0·2 were considered small;
![]() $\left| {{\rm SSE}} \right|$
values ≥0·2 to <0·5 were considered medium; and
$\left| {{\rm SSE}} \right|$
values ≥0·2 to <0·5 were considered medium; and
![]() $\left| {{\rm SSE}} \right|$
values ≥0·5 were considered large(
Reference Cohen
20
). As also described by the WHO MGRS Group(
21
), all
$\left| {{\rm SSE}} \right|$
values ≥0·5 were considered large(
Reference Cohen
20
). As also described by the WHO MGRS Group(
21
), all
![]() $\left| {{\rm SSE}} \right|$
values calculated in the current study were indicative of acceptable (non-significant) differences if these were <0·5.
$\left| {{\rm SSE}} \right|$
values calculated in the current study were indicative of acceptable (non-significant) differences if these were <0·5.
Lastly, Student’s t test and the χ 2 test were used to assess differences between continuous and categorical variables, respectively. These latter analyses were performed using the statistical software package IBM SPSS Statistics for Windows version 24.0. All analyses were two-tailed and the level of statistical significance was set at P<0·05.
Results
Table 1 presents two principal sociodemographic characteristics (i.e. region of residence and maternal educational level) of the study population and the differences among SEANUTS countries. According to these data, the majority (>50 %) of children recruited in Malaysia (61·3 %) and Indonesia (51·6 %) were living in urban areas compared with children from Thailand (35·6 %) and Vietnam (29·2 %; P<0·001). In addition, the percentage of mothers who had graduated from high school was significantly higher in Malaysia (34·5 %) compared with Thailand (24·4 %), Vietnam (22·1 %) and finally Indonesia (7·3 %; P≤0·05). On the contrary, higher percentages of illiterate or low educated (i.e. primary school) mothers were observed in Indonesia (42·1 %) and Thailand (32·2 %) and these were significantly higher compared with those observed in Vietnam (12·6 %) and Malaysia (4·7 %; P≤0·05).
Table 1 Sociodemographic characteristics of the study population by SEANUTS country

SEANUTS, South-East Asian Nutrition Survey.
* P value derived from the χ 2 test. Pairwise comparisons of percentages appearing in the same row were conducted using the two-sample Z-test for proportions and revealed statistically significant differences in all comparisons.
The skewness (L), median (M) and coefficient of variation (S) values of the corresponding body weight and BMI distributions are presented for boys and girls in the online supplementary material, Supplemental Table 1. All L values in the ages from 0·5 to 12 years were lower than ‘1’, indicating skewness of body weight and BMI distributions to the right. Furthermore, all values of S were progressively increasing with age, showing that their ranges were also increasing.
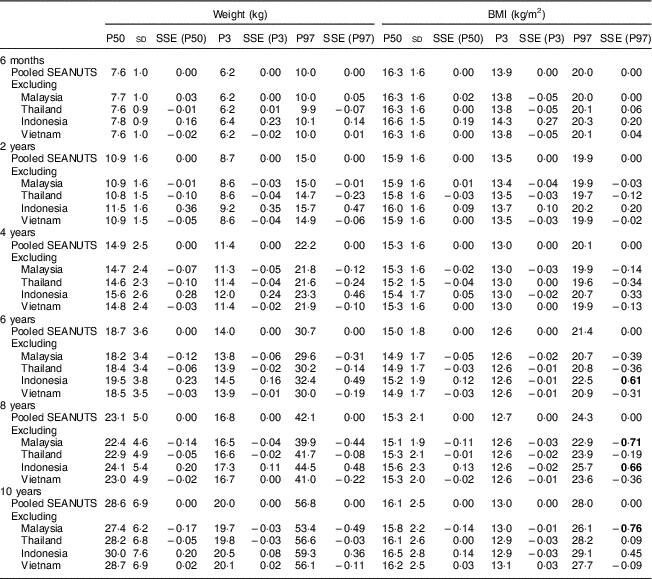
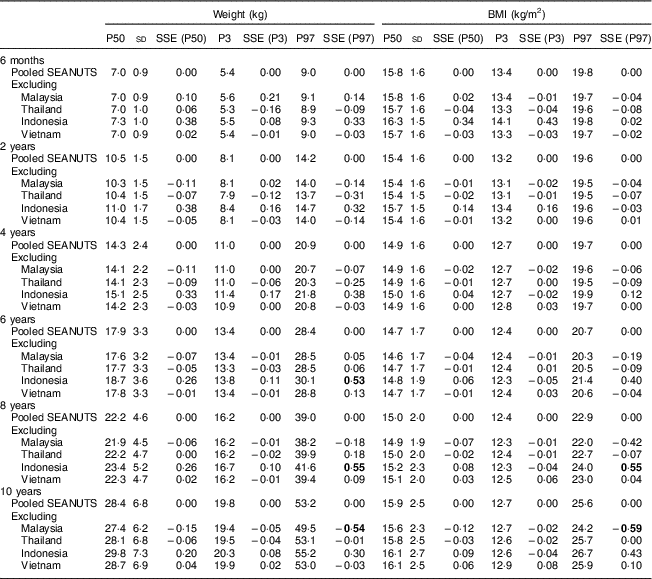
In accordance with the first objective of the present study (i.e. calculating body-weight- and BMI-for-age percentile values from the pooled SEANUTS population), the online supplementary material, Supplemental Tables 2 and 3 and Supplemental Tables 4 and 5, present the body-weight- and BMI-for-age percentile values (at P3, P5, P50, P95 and P97) in the age groups of 0·5–12 years for boys and girls, respectively. A summary of these data for specific percentiles (i.e. P3, P50 and P97) and age groups is also presented in Tables 2 and 3 for boys and girls, respectively.
Table 2 Differences in body-weight- and BMI-for-age percentile values in boys between the pooled SEANUTS and the remaining pooled SEANUTS samples after successively excluding one SEANUTS country
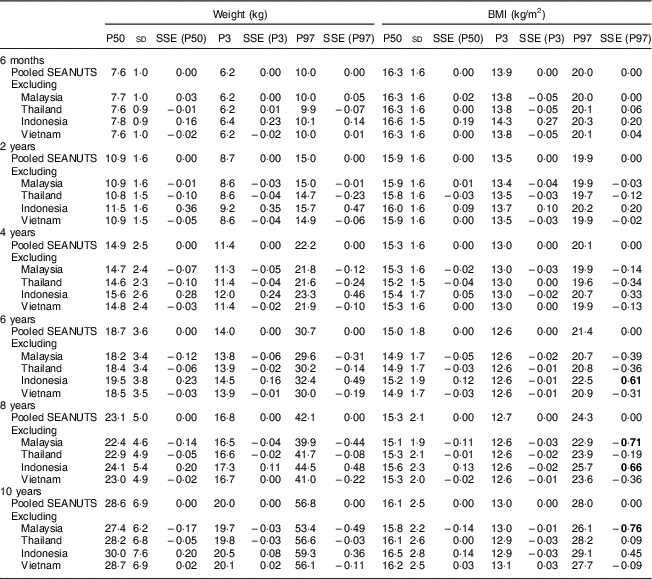
SEANUTS, South-East Asian Nutrition Survey; P, percentile; SSE, standardized site effect (difference between the indicated site mean and the corresponding pooled SEANUTS (all sites) mean divided by the pooled sd).
SSE marked in bold correspond to values greater than 0·5 or less than −0·5.
Table 3 Differences in body-weight- and BMI-for-age percentile values in girls between the pooled SEANUTS and the remaining pooled SEANUTS samples after successively excluding one SEANUTS country
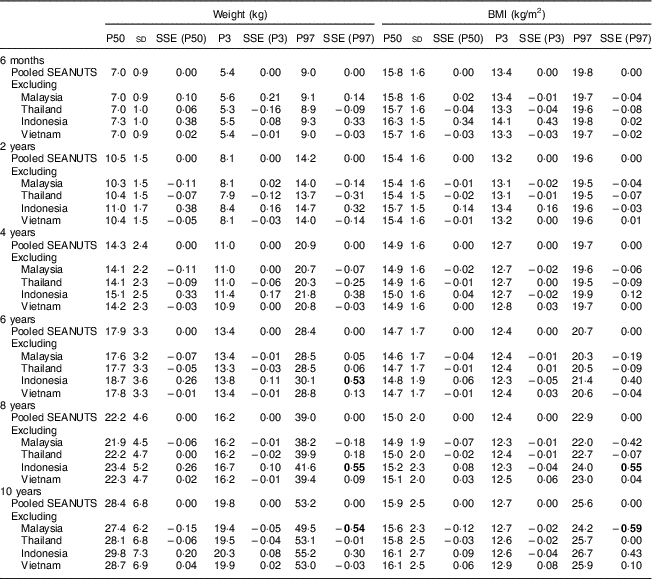
SEANUTS, South-East Asian Nutrition Survey; P, percentile; SSE, standardized site effect (difference between the indicated site mean and the corresponding pooled SEANUTS (all sites) mean divided by the pooled sd).
SSE marked in bold correspond to values greater than 0·5 or less than −0·5.
With regard to the second objective of the present study (i.e. investigate whether the pooled SEANUTS percentile values can be used for all SEANUTS countries instead of developing and using country-specific ones), Tables 2 and 3 as well as the online supplementary material, Supplemental Tables 2 and 3 and Supplemental Tables 4 and 5, display all comparisons and therefore the relevant SSE for body-weight- and BMI-for-age percentile values between the pooled SEANUTS sample and the remaining pooled SEANUTS samples after successively excluding one SEANUTS country. According to these comparisons, the observed SSE values were indicative of only a few large differences. Regarding body weight, the only large differences observed (two for boys and eleven for girls) were in the upper percentiles (i.e. P95, P97) and for the age group of 6–12 years when excluding data from Indonesia or Malaysia (see Tables 2 and 3, as well as Supplemental Tables 2 and 4, respectively). Concerning BMI, the only large differences observed (seventeen for boys and eight for girls) were in the upper percentiles (i.e. P95, P97) and for the age group of 7–12 years when excluding data from Indonesia or Malaysia (see Tables 4 and 5, as well as Supplemental Tables 3 and 5, respectively).
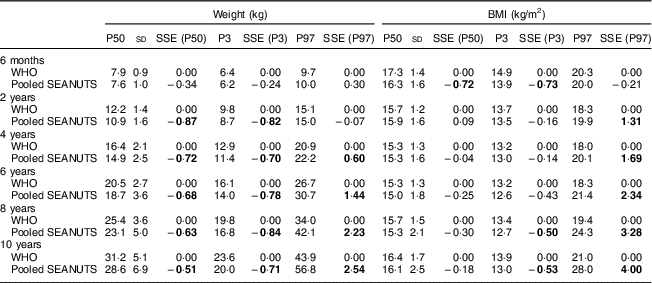
Table 4 Differences in body-weight- and BMI-for-age percentile values in boys between the pooled SEANUTS sample and WHO
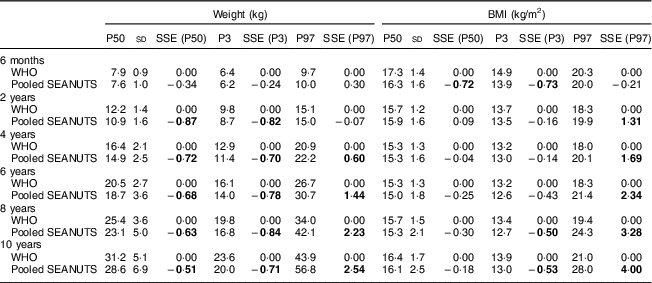
SEANUTS, South-East Asian Nutrition Survey; P, percentile; SSE, standardized site effect (difference between the WHO mean and the corresponding pooled SEANUTS mean divided by the WHO sd).
SSE marked in bold correspond to values greater than 0·5 or less than −0·5.
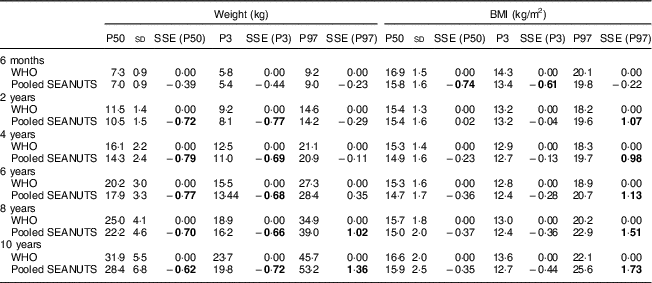
Table 5 Differences in body-weight- and BMI-for-age percentile values in girls between the pooled SEANUTS sample and WHO
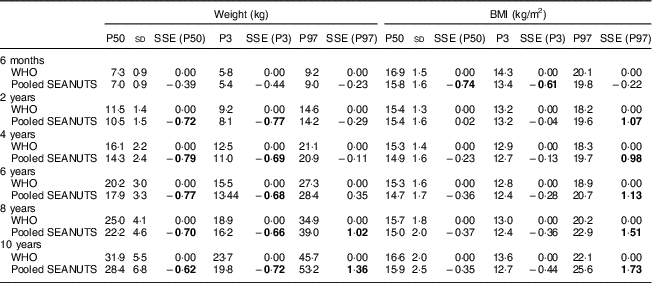
SEANUTS, South-East Asian Nutrition Survey; P, percentile; SSE, standardized site effect (difference between the WHO mean and the corresponding pooled SEANUTS mean divided by the WHO sd).
SSE marked in bold correspond to values greater than 0·5 or less than −0·5.
The data related to the third objective of the present study (i.e. examine whether the pooled SEANUTS percentile values differ from the respective growth reference values provided by WHO) are summarized in Tables 4 and 5 as well as in the online supplementary material, Supplemental Tables 6–9 and Supplemental Figs 1–4. Regarding body weight, out of the total number of sixty comparisons conducted for each sex, the large (not acceptable) differences numbered forty-six in boys and forty-one in girls. From these large differences, thirty-three in both boys and girls were negative and were observed in the lower and median percentiles (i.e. P3, P5 and P50). In the upper percentiles (i.e. P95 and P97), there were thirteen positive differences observed in boys in the age group of 4–10 years and two negative and six positive differences observed in girls in the age groups of 1 years and 7–10 years, respectively (see Tables 4 and 5, as well as Supplemental Tables 6 and 8). Concerning BMI, out of the total number of seventy comparisons performed for each sex, the number of large (not acceptable) differences observed was thirty-nine in boys and thirty in girls. From these large differences, fifteen in boys (in the age groups of 0·5–1·5 years and 7–12 years) and six in girls (in the age groups of 0·5 years and 11–12 years) were negative and were observed in the lower and median percentiles (i.e. P3, P5 and P50). In the upper percentiles (i.e. P95 and P97), there were twenty-four positive differences observed in both boys and girls, for the age groups of 1·5–12 years (see Tables 4 and 5, as well as Supplemental Tables 7 and 9). According to the data presented in Table 6, children classified above the 95th BMI-for-age percentile, using the pooled SEANUTS reference values, were found to have significantly higher mean sum of skinfolds (P=0·012), waist circumference (P=0·009) and fat mass (P=0·014), compared with children classified in the same BMI group using the WHO reference values. On the opposite, children classified below the 5th BMI-for-age percentile, using the pooled SEANUTS reference values, were found to have a significantly lower mean waist circumference (P=0·028), compared with children classified in the same BMI group using the WHO reference values. To an extent, the aforementioned differences in anthropometric and body composition indices, summarized in Table 6, confirm and reflect the significant differences observed in BMI percentile values between pooled SEANUTS and WHO, especially those in the upper percentiles.
Table 6 Differences in anthropometric and body composition indices among children categorized in different weight status groups using WHO and pooled SEANUTS BMI reference values

SEANUTS, South-East Asian Nutrition Survey; P, percentile.
* Sum of three skinfolds, i.e. biceps, triceps and suprailiac.
† P value derived from Student’s t test; significant P values indicated in bold.
Discussion
The first objective of the present study was to calculate body-weight- and BMI-for-age percentile values from the SEANUTS population of infants and children. Before conducting these calculations, the approach followed by WHO in the MGRS( Reference de Onis, Garza and Victora 14 ) to exclude socio-economically disadvantaged and/or unhealthy children was also followed in the present study for the identification of eligible children. The application of this approach led to the inclusion of 14 202 eligible infants and children in the analyses performed for calculating body-weight- and BMI-for-age percentile values in SEANUTS.
In line with its second objective (i.e. investigate whether the pooled percentile values can be used for all SEANUTS countries instead of developing and using country-specific ones), the present study revealed only a small number of not acceptable differences when comparing the percentile values from the pooled SEANUTS sample with the values from each individual country. As most of the not acceptable differences derived from the comparisons between the pooled SEANUTS sample and the remaining SEANUTS sample when Indonesia or Malaysia was excluded, this indicates that the percentile values for Indonesia or Malaysia actually determine the percentile values calculated for the pooled SEANUTS sample. In addition, as 96·6 % of the total number of comparisons showed only small inter-site differences, this also indicates that body-weight- and BMI-for-age percentile values between the pooled SEANUTS sample and individual countries were comparable and therefore that the use of pooled SEANUTS percentile values to assess growth and weight status in each individual country is appropriate (see online supplementary material, Supplemental Tables 2 to 5).
Based on the comparisons, the following differences were observed for body-weight- and BMI-for-age percentile values. With regard to body weight, the small number of large differences were observed mainly in girls, in the 95th and 97th percentiles and in the age group of 6–12 years when Indonesia or Malaysia was excluded from the total sample, respectively. The positive SSE values that were consistently observed when excluding girls from Indonesia in the age group of 6–8 years indicate that body weight of Indonesian girls is lower at these upper percentiles compared with the other three countries. In contrast, the negative SSE values that were consistently observed when excluding data from Malaysia for the age group 10–12 years indicate that body weight of Malaysian girls is higher at these percentiles compared with the other three countries. Regarding BMI, the few large differences observed in both boys and girls when Indonesia or Malaysia was excluded from the total sample were in the 95th and 97th percentiles and in the age group of 7–12 years. The positive SSE values consistently observed when excluding data from Indonesia for both boys and girls, for the age group of 6–9 years in boys and 7–9 years in girls, indicate that the BMI of Indonesian children is lower at the upper percentiles compared with the other three countries. This is probably also reflected to the high prevalence of underweight (i.e. 19·2 % in urban areas and 28·9 % in rural areas) that has previously been reported for the Indonesian children within SEANUTS( Reference Schaafsma, Deurenberg and Calame 13 ). In contrast, the negative SSE values consistently observed when excluding data from Malaysia for boys aged 7–12 years and for girls aged 9–12 years indicate that the BMI of Malaysian children is higher in the 95th and 97th percentiles compared with the BMI in the other three countries. This finding is not surprising given the higher prevalence of overweight/obesity reported for Malaysian children in SEANUTS( Reference Poh, Ng and Siti Haslinda 17 ) compared with the other three SEANUTS countries( Reference Schaafsma, Deurenberg and Calame 13 , Reference Le Nguyen, Le Thi and Nguyen Do 15 , Reference Rojroongwasinkul, Kijboonchoo and Wimonpeerapattana 16 ).
The additional findings stemming from the comparisons between the pooled SEANUTS and the WHO weight and BMI percentile values( 1 ) indicate large differences in certain percentile values. More specifically, body weight percentile values were found to be lower in the pooled SEANUTS sample compared with WHO but only for the lower and the median percentiles (i.e. P3, P5 and P50) in almost all ages and in both sexes. In contrast, in the upper percentiles (i.e. P95 and P97), body weight values were higher in the pooled SEANUTS sample compared with WHO in almost all ages and in both sexes. The aforementioned findings on body weight could probably explain the lower BMI percentile values observed in the lower and median percentiles, and also the higher BMI values observed in the upper percentiles in SEANUTS compared with the WHO sample.
The differences reported by the present study between WHO and SEANUTS percentile values should be taken into consideration when using WHO Child Growth Standards and Growth References for the assessment of growth and weight status in infants, children and adolescents in these South-East Asian countries. This is because the findings of the present study could reflect actual differences at a population level between the pooled SEANUTS and WHO growth reference percentile values. For instance, the lower body weight and BMI values in P3, P5 and P50 and the higher values in P95 and P97 relative to WHO could be a consequence of the economic transition experienced in South-East Asian countries over the last decades, leading to a subsequent widening in the distributions of body weight and BMI, particularly for the upper percentiles. In this context, the higher body weight and BMI values observed in the upper percentiles might also reflect an increased prevalence of obesity in SEANUTS countries. This is also indicated by the higher fat mass and central adiposity levels for children classified in these upper percentiles, using pooled SEANUTS rather than WHO reference values (Table 6). Lastly, the increasing trend of obesity prevalence in these countries is also supported by data derived from Thailand, Malaysia and other Asian countries indicating that the rapid changes in food intake and lifestyle patterns due to the economic transition have also resulted in increases of mean body weight and BMI levels in these populations( Reference Kosulwat 11 , Reference Noor 12 , Reference Shetty 22 , Reference Zong, Li and Zhu 23 ).
The aforementioned differences in anthropometric and body composition indices, summarized in Table 6, confirm and reflect the significant differences observed in BMI percentile values between pooled SEANUTS and WHO, especially those in the 95th and 97th percentiles. The implication of this observation is that the higher BMI values observed for pooled SEANUTS compared with WHO in these percentiles also reflect actual higher fat mass and central adiposity levels between these two study populations.
These differences between the pooled SEANUTS and WHO percentile values should also be interpreted under the light of study limitations. More specifically, despite the procedures followed in the present study to exclude disadvantaged and/or unhealthy children being similar to those used by WHO in the MGRS, it was not feasible to apply all exclusion criteria due to the non-availability of relevant data. More information on the exact exclusion criteria applied in the present study and on the deviations from the exclusion criteria used by WHO in the MGRS has been previously described elsewhere( Reference Rojroongwasinkul, Bao and Sandjaja 18 ). However, these deviations only slightly affected the identification of eligible children without health and/or socio-economic constraints on their growth, since in almost the entire study population, the average body weight and BMI values were lower in the excluded children (i.e. n 2364) compared with the children included in the analyses (i.e. n 14 202; data not shown). Furthermore, as the sampling of children in Malaysia and Vietnam used schools as their entry points for recruiting study participants, this might have precluded eligible children who were not enrolled to schools from participating to the study. Lastly, as blood indices were not available for the total population of children examined in the present study, this could have obscured the identification of non-eligible children with poor nutritional status (e.g. children with anaemia and/or other micronutrient deficiencies) and these children could have potentially been considered eligible to participate in the current analyses. A similar limitation is also reflected in the non-availability of puberty status data among older children and adolescents in SEANUTS, since differences in the biological maturation level between SEANUTS and WHO populations could also provide an interpretation of the observed differences in body weight and BMI percentile values.
Conclusions
The present study has calculated body-weight- and BMI-for-age percentile values for 0·5–12-year-old children from four South-East Asian countries. In addition, the findings of the present study support the use of the percentile values derived from the pooled SEANUTS sample also in each individual SEANUTS country for the assessment of children’s growth and weight status. Regarding the comparison between the pooled SEANUTS and WHO percentile values, some large differences have been observed especially in the lower and upper percentiles. However, these findings need to be treated with caution since the observed differences, especially in the upper percentiles, could also reflect an increased prevalence of obesity observed in SEANUTS countries over the last decades.
As a future implication, the data reported by the present study could be used as an additional tool to the WHO growth references in both clinical practice as well as for research and public health applications for assessing growth and identifying underweight, overweight or obesity among infants and children in South-East Asia.
Acknowledgements
Acknowledgements: The authors are indebted to the SEANUTS Study Group research team members, as well as the parents/caregivers, infants and children for their participation in the study. Financial support: FrieslandCampina supported SEANUTS with a research grant. FrieslandCampina had no involvement in the recruitment of participants and the final set of results. Conflict of interest: None of the authors or the research institutes has any conflicts of interest to declare. Any opinions, findings, conclusions or recommendations expressed in this publication are those of the authors and do not necessarily reflect the views of FrieslandCampina. Authorship: S.S., B.K.P., N.R., K.L.N.B., M.S., J.E.W., A.B. and C.N.H. contributed in designing the study, collecting and managing data. P.D. contributed in the study monitoring, data management and data evaluation. Y.M. led the statistical analyses, with contribution and input from all authors. All authors contributed to the writing of the manuscript, critically reviewed and approved the final version of the manuscript for publication. Ethics of human subject participation: This study was conducted according to the guidelines laid down in the Declaration of Helsinki and all procedures involving human subjects were approved by the medical ethical committees (MEC) of all participating institutes (i.e. the MEC of PERSAGI (Indonesian Nutrition Association); the MEC of Universiti Kebangsaan Malaysia; the MEC of Mahidol University, Thailand; and the MEC of Vien Dinh Duong (National Institute of Nutrition), Vietnam). Written informed consent was obtained from the parents and/or caregivers of all subjects. The present study is registered (6 August 2010) in the Netherlands Trial Registry (http://www.trialregister.nl/trialreg/index.asp) as NTR2462.
The SEANUTS Study Group includes the following. Indonesia: Sandjaja, Basuki Budiman, Moesijanti Soekatri, Heryudarini Harahap, Fitrah Ernawati, Yekti Widodo, Edith Sumedi, Nurmeida S. Syarief, Rustan Effendi, Gustina Sofia, Minarto and Hidayat Syarief. Malaysia: Poh Bee Koon, Norimah A. Karim, Ruzita A. Talib, Siti Balkis Budin, Alvin Ng Lai Oon, Siti Haslinda Mohd Din, Wong Jyh Eiin, Mohd Ismail Noor, Rahman Jamal, Nor Azmi Kamaruddin, Nik Shanita Safii, Chin Yit Siew, Wee Bee Suan and Nor Aini Jamil A. Wahab. Thailand: Nipa Rojroongwasinkul, Atitada Boonpraderm, Pattanee Winichagoon, Petcharat Kunaphan, Uruwan Yamborisut, Wanphen Wimonpeerapattana, Sayamon Senaprom, Kallaya Kijboonchoo, Wiyada Thasanasuwan, Weerachat Srichan, Kusol Soonthorndhada and Sasiumphai Purttiponthanee. Vietnam: Khanh Le Nguyen Bao, Chinh Nguyen Huu, Hop Le Thi, Truong Nguyen Hong, Van Anh Nguyen Đo, Đo Tran Thanh, Nga Tran Thuy, Nhung Bui Thi, Dzung Nguyen Đinh, Tuoc Bui Van, Khang Nguyen Van, Dzung Nguyen Viet, Luan Nguyen Viet, Ha Nguyen Thu, Xuyen Hoang Thi, Long Nguyen Van, Hai Tran Thi, Long Pham Si, Huong Nguyen Thi, Ngan Nguyen Thi, Thao Le Thanh, Kieu Dau Thi, Thang Dinh Tat and Mai Nguyen Thi Tuyet. FrieslandCampina: Ilse Khouw, Panam Parikh, Swee Ai Ng, Anne Schaafsma and Marjolijn Bragt.
Supplementary material
To view supplementary material for this article, please visit https://doi.org/10.1017/S1368980018001349


