


Somatic monitoring in the paediatric population can be used as an indicator of health, nutritional status (underweight, overweight or obesity) and living conditions, in addition to identifying genetic, chronic diseases, infections and dietary factors that can influence rapid or slow growth(Reference Nyankovskyy, Dereń and Wyszyńska1–Reference Natale and Rajagopalan3). The well-being and health of children and adolescents could reflect the both on the state of socio-economic development and quality of the health system in a given country(Reference Llewellyn, Simmonds and Owen4–Reference Cole, Bellizzi and Flegal8). In this perspective, the somatic growth of children and adolescents can be used as a weight status and health indicator(Reference Kuczmarski7,Reference Cole, Bellizzi and Flegal8) .
Growth curves are used as important tools to verify the physical growth of individuals, identifying the weight status and health conditions of the population(Reference Khadilkar and Khadilkar6–Reference Cole, Bellizzi and Flegal8). Growth curves can be defined in two ways: standard or reference(Reference Khadilkar and Khadilkar6). Standard growth curves are derived from children raised in environments that minimised growth restrictions, such as inadequate nutrition and infections, involving a value judgment when describing how children ‘should grow’ in all countries(Reference Zeferino, Barros Filho and Bettiol9), and the reference growth curves, on the other hand, are descriptive and are drawn from a population believed to be growing in the best possible state of nutrition and health in a given community, without necessarily controlling for variables such as nutrition and the presence of infections(Reference Khadilkar and Khadilkar6). Reference curves describe children’s growth at a given time and represent how children are growing, not how they should be growing(Reference Khadilkar and Khadilkar6).
Among growth curves, standard curves of the WHO(10), Centers for Disease Control and Prevention of the USA (CDC)(Reference Kuczmarski7) and the International Obesity Taskforce (IOTF)(Reference Cole, Bellizzi and Flegal8) were elaborated with the aim of classifying the weight status of children and adolescents from the world population(Reference Kuczmarski7,Reference Cole, Bellizzi and Flegal8,10) . However, human growth and development are characterised by their intra-population and inter-population heterogeneity, being the product of continuous and complex interactions between genes and different environmental factors, linked to the living conditions of populations, such as nutrition(Reference Díaz Bonilla, Torres Galvis and Gómez-Campos11), and the physical growth of populations in different parts of the world(Reference Díaz Bonilla, Torres Galvis and Gómez-Campos11) can be evaluated through reference curves, being another alternative to verify the growth, because the standard growth curves take into account the optimal growth, demonstrating how the growth must occur in ideal conditions. Although optimal growth should be strongly encouraged, not all countries have ideal living conditions for the population to provide optimal growth(Reference Khadilkar and Khadilkar6,Reference Zeferino, Barros Filho and Bettiol9) .
Reference growth curves developed from anthropometric measurements have been used in several countries to assess the weight status and problems associated with physical growth in children and adolescents(Reference Díaz Bonilla, Torres Galvis and Gómez-Campos11–Reference Inokuchi, Matsuo and Takayama14). Body mass (BM) for age, height for age, anthropometric indexes, body perimeters and skinfolds are among the most widely evaluated indicators(Reference Díaz Bonilla, Torres Galvis and Gómez-Campos11–Reference Moreno, Mesana and Gonzalez-Gross16). Anthropometric measurements are valuable tools to assess physical growth and weight status because they are methodologically simple and have low cost, especially for large-scale studies(Reference Oyhenart, Torres and Garraza17). In this sense, listing the reference growth curves to identify weight status in the paediatric population and the use of anthropometric measurements for comparison purposes is important to understand changes associated with environmental factors or the secular trend phenomenon(Reference Oyhenart, Torres and Garraza17,Reference Loesch, Stokes and Huggins18) .
Growth patterns are heterogeneous and related to environmental factors such as geographic, meteorological, economic, social and cultural factors, which are different in different parts of the world(Reference Natale and Rajagopalan3,Reference Khadilkar and Khadilkar6) . Thus, the systematisation of reference growth curves to identify weight status (underweight, overweight and obesity) can contribute to the understanding of intra- and inter-population heterogeneity(Reference Oyhenart, Torres and Garraza17,Reference Barbosa Filho, Lopes and Fagundes19,Reference Silva, Maia and Claessens20) . This review can contribute to demonstrate the comprehensiveness of the available reference growth curves, describing the variability between the different reference growth curves. In this context, the aim of this systematic review was to identify studies that proposed reference growth curves for weight status (underweight, overweight or obesity) in children and adolescents. This review presents the following research question: what are the anthropometric indicators, anthropometric indexes and percentiles used in the development of reference growth curves in relation to underweight, overweight or obesity in children and adolescents?
Method
The method used in the systematic review was developed in line with procedures of the Preferred Reporting Items for Systematic reviews and Meta-Analyses 2020 statement, an updated guideline for reporting systematic reviews(Reference Page, McKenzie and Bossuyt21), and Cochrane Collaboration. This review was registered on the PROSPERO International Prospective Register of Systematic Reviews platform with registration number CRD42020215063.
Systematic search strategies
The search was performed in the following databases: (1) Cumulative Index to Nursing and Allied Health Literature (CINAHL) by EBSCOhost; (2) LILACS by the Virtual Health Library; (3) PubMed by National Library of Medicine (MEDLINE); (4) ScienceDirect by Elsevier; (5) Scopus by Elsevier; (6) SPORTDiscus by EBSCOhost; (7) Scientific Electronic Library Online (SciELO) and (8) Web of Science. Manual searches were also carried out in grey literature (Google scholar) in order to find possible studies that were not retrieved by the search strategy.
The search in the databases was performed between the months of June to August 2021. The year of publication of articles was disregarded in order to cover as many studies as possible. The search for probable articles in databases was performed using the advanced search tool (‘keywords’) and performed through the construction of blocks of descriptors in three languages: English, Spanish and Portuguese. Boolean operators AND was used to add at least one word from each group, OR was used to add at least one word from each block, parentheses were used to combine search terms by result categories, quotes were used to search for exact terms or expressions and asterisks were used to search for all words derived from the same prefix. Descriptors came from the Health Sciences Descriptors (DECS), Medical Subject Headings (MESH) and key words found in articles related to the subject.
The search strategy descriptor groups were divided into three blocks: (1) underweight, overweight and obesity; (2) reference growth curves and (3) population of children and adolescents: Block 1- (Overweight OR Obesity OR fats OR fatty OR ‘fat body’ OR ‘fat mass’ OR adiposity OR ‘body composition’ OR ‘Nutritional Status’ OR ‘body fat’ OR Thinness OR Underweight OR ‘Malnutr* OR malnourish* OR Undernutr*) AND Block 2- (‘Growth Curves’ OR ‘Growth Charts’ OR ‘Reference Growth Curve’ OR ‘Centile Curves’ OR ‘Distance Growth Curve’) AND Block 3- (adolesc* OR teen OR teenager OR child* OR Children OR young OR ‘School-age’ OR Childhood OR ‘young people’ OR scholar OR students OR ‘school children’ OR ‘school teenager’ OR teenager OR adolescence OR student). The search was restricted to studies published in English, Portuguese or Spanish.
Manual searches were also carried out based on references of included studies in order to identify possible articles not previously included. The Zotero® bibliographic manager software, version 5.0 (Roy Rosenzweig Center for History and New Media) was used to create specific libraries, which allowed the identification and exclusion of duplicates, division and organisation of results of each database. Results were exported to the reference manager software.
Study selection criteria
In this review, the included studies showed: studies with population of children and adolescents aged 2·0–19·9 years (if the study reports mean age values, this mean should be up to 19 years old); study design (cross-sectional, longitudinal, mixed longitudinal and cohort studies), studies that developed reference growth curves in relation to underweight, overweight or obesity through anthropometric indexes such as upper arm fat area, upper arm muscle area, BMI, conicity index (Iconi), waist-to-height ratio, waist-to-hip ratio, among others; anthropometric indicators such as BM, height, body perimeters and skinfolds in children and adolescents; studies that elaborated curves through modelling methods for sex, age, race/ethnicity, sexual maturation and economic level, with the LMS method, being L (smooth curve), M (median) and S (coefficient and variance), polynomial regression or percentile regression. The use of modelling methods is important to reduce data asymmetry for the development of reference growth curves, being necessary for comparison with existing curves(Reference Cole, Bellizzi and Flegal8,Reference Conde and Monteiro22) .
Articles were excluded according to the following criteria: duplicate articles, review articles, dissertations, abstracts, book chapters, points of view or expert opinions, monographs, theses, chapters, articles in which the population evaluated was composed only of individuals with some morbidity, except malnutrition and obesity, animal studies, study carried out with adults, elderly and athletes, articles that did not elaborate reference growth curves for underweight, overweight or obesity in children and adolescents and those that did not take into account modelling methods for the development of reference growth curves.
Risk of bias assessment
Studies included in the systematic review were analysed for methodological quality by two independent reviewers/authors (CASAJ and PCM). Disagreement between reviewers/authors regarding the evaluation of any study was resolved through a consensus meeting, and if the disagreement persisted, it was decided by a third reviewer (DASS). To assess the risk of bias/methodological quality of studies, the Quality Assessment Tool for Observational Cohort and Cross-Sectional Studies (NHLBI) from the National Institutes of Health(23) was used. This instrument was used to assess the risk of bias, as included studies had cross-sectional, longitudinal and mixed longitudinal design, consistent with the inclusion criteria.
This methodological analysis instrument is indicated to aid the internal validity (potential risk of selection, information, measurement or confounding factors) of cross-sectional and cohort studies, covering fourteen criteria to determine the risk of bias/methodological quality, including whether the population under study was clearly specified and defined. For each criterion evaluated, the following scores were assigned: ‘no’ (N), ‘not reported’ (NR), ‘yes’ (Y) and ‘not applicable’ (NA). The ‘NR’ option was used when no information was reported in studies. The ‘NA’ option was used when it was not possible to evaluate one of the instrument’s criteria due to the type of study. At the end of the study classification, a total score was assigned to each study based on the number of positive and negative responses of the questionnaire. Responses ‘no’ and ‘NR’ had score ‘0’, while responses ‘yes’ and ‘NA’ had score ‘1’(23).
Data extraction
Data were extracted by two independent reviewers, and consensus was verified between them. The information extracted was year/author; risk of bias score; study site; population/sample; age group; study design; method to produce the growth curves; anthropometric indicators; percentiles identified in reference growth curves; stratification variables and modelling of reference growth curves; percentiles to define underweight, overweight and obesity, values identified in percentiles for underweight, overweight and obesity.
Results
Overall, 3794 studies were found and among them, 203 studies were duplicates, resulting in 3591 studies. After reading titles and abstracts, 3400 studies were excluded and then 191 studies were read in full. Of these, seventy-eight were included because they met the eligibility criteria. The references of articles included were read, and eight more studies were included in this review, ending in eighty-six studies (Fig. 1).

Fig. 1. Synthesis of systematic search.
General characteristics of the included studies
Forty studies were carried out in the Asian continent in the following countries: four in Saudi Arabia, five in China, one in Singapore, one in the United Arab Emirates, four in India, five in Iran, three in Japan, two in Kuwait, two in Lebanon, one in Malaysia, one in Pakistan, one in Taiwan and ten in Turkey(Reference Cicek, Ozturk and Unalan13,Reference Inokuchi, Matsuo and Takayama14,Reference Al-Isa and Thalib24–Reference Virani61) (Table 1).
Table 1. Characteristics of reference growth curve studies for thinness, overweight and obesity

♂, male; ♀, female; NR, not reported.
Twenty studies were conducted in the Americas, in the following countries: two in Argentina, seven in Brazil, one in Canada, one in Chile, three in Colombia, three in the USA, one in Greenland, one in Peru and one in Venezuela(Reference Gomez-Campos, Arruda and Andruske2,Reference Díaz Bonilla, Torres Galvis and Gómez-Campos11,Reference Oyhenart, Torres and Garraza17,Reference Barbosa Filho, Lopes and Fagundes19,Reference Silva, Maia and Claessens20,Reference Conde and Monteiro22,Reference Addo and Himes62–Reference Guedes, Martini and Borges68,Reference Guedes, Martini and Borges68–Reference Vargas, Souki and Ruiz75) . Two studies were carried out in Africa, in the countries of South Africa (one study) and Tunisia (one study)(Reference Ghouili, Khalifa and Ouerghi76,Reference Nyati, Pettifor and Norris77) (Table 1).
Thirty-two studies were carried out in Europe in the following countries: five in Germany, one in Bulgaria, one in Cyprus, one in Denmark, two in Spain, one in Great Britain, one in Greece, two in Italy, one in Norway, two in Poland, two in Portugal, one in the UK, one in Switzerland, ten in Turkey and one in Ukraine(Reference Nyankovskyy, Dereń and Wyszyńska1,Reference Brannsether, Roelants and Bjerknes12,Reference Cicek, Ozturk and Unalan13,Reference Moreno, Mesana and González-Gross15,Reference Moreno, Mesana and Gonzalez-Gross16,Reference Altunay, Kondolot and Poyrazoğlu25,Reference Bundak, Furman and Gunoz29,Reference Hatipoglu, Mazicioglu and Poyrazoglu34,Reference Hatipoglu, Ozturk and Mazicioglu35,Reference Kondolot, Horoz and Poyrazoğlu43,Reference Mazicioglu, Kurtoglu and Ozturk48,Reference Özer51,Reference Ozturk, Budak and Cicek52,Reference Pirincci, Cicek and Acik54,Reference Aeberli, Gut-Knabenhans and Kusche-Ammann78–Reference Smpokos, Linardakis and Taliouri94) . Turkey has its territory in two continents, Asia and Europe, and for this reason it was included in the accounting of both continents. Two studies were carried out in Oceania in Australia (one study) and New Zealand (one study)(Reference Eisenmann95,Reference Rush, Obolonkin and Savila96) (Table 1).
As for the year of publication, the oldest study was published in 1997(Reference Luciano, Bressan and Zoppi83). The most recent study was published in 2020(Reference Shah, Radia and McCarthy93). Of the eighty-six studies included, seventy-five had cross-sectional design(Reference Nyankovskyy, Dereń and Wyszyńska1,Reference Gomez-Campos, Arruda and Andruske2,Reference Díaz Bonilla, Torres Galvis and Gómez-Campos11–Reference Oyhenart, Torres and Garraza17,Reference Barbosa Filho, Lopes and Fagundes19,Reference Conde and Monteiro22,Reference Al-Isa and Thalib24–Reference Ayatollahi and Shayan28,Reference Chacar and Salameh30–Reference Kromeyer-Hauschild, Glässer and Zellner44,Reference Kromeyer-Hauschild, Glässer and Zellner44,Reference Kuriyan, Thomas and Lokesh45,Reference Ma, Wang and Song47,Reference Mazicioglu, Kurtoglu and Ozturk48,Reference Mushtaq, Gull and Abdullah50–Reference Sakamoto and Yang57,Reference Sakamoto and Yang57–Reference Sung, So and Choi60,Reference Bustamante, Freitas and Pan63–Reference Katzmarzyk70,Reference Oyhenart, Lomaglio and Dahinten72–Reference Ghouili, Khalifa and Ouerghi76,Reference Aeberli, Gut-Knabenhans and Kusche-Ammann78–Reference Nawarycz, Krzyżaniak and Stawińska-Witoszyńska87,Reference Rosario, Kurth and Stolzenberg89–Reference Shah, Radia and McCarthy93,Reference Eisenmann95,Reference Abdulrazzaq, Nagelkerke and Moussa97) . Only eight studies had longitudinal design(Reference Bundak, Furman and Gunoz29,Reference Li, Lin and Lin46,Reference Mukherjee, Leong and Wong49,Reference Virani61,Reference Kløvgaard, Nielsen and Sørensen71,Reference Nyati, Pettifor and Norris77,Reference Nielsen, Olsen and Juul88,Reference Rush, Obolonkin and Savila96) and three had mixed longitudinal design(Reference Silva, Maia and Claessens20,Reference Addo and Himes62,Reference Smpokos, Linardakis and Taliouri94) (Table 1).
Of the eighty-six studies, thirty-nine (45 %) presented information about the study population(Reference Nyankovskyy, Dereń and Wyszyńska1,Reference Gomez-Campos, Arruda and Andruske2,Reference Brannsether, Roelants and Bjerknes12,Reference Cicek, Ozturk and Unalan13,Reference Moreno, Mesana and González-Gross15,Reference Moreno, Mesana and Gonzalez-Gross16,Reference Barbosa Filho, Lopes and Fagundes19,Reference Altunay, Kondolot and Poyrazoğlu25,Reference Chakar and Salameh31–Reference Al Herbish, El Mouzan and Al Salloum36,Reference Kelishadi, Gouya and Ardalan41–Reference Kondolot, Horoz and Poyrazoğlu43,Reference Mushtaq, Gull and Abdullah50,Reference Pirincci, Cicek and Acik54,Reference Qiu, Guo and Duan56–Reference Shaik, El Mouzan and Al Salloum58,Reference Bustamante, Freitas and Pan63–Reference De Plata, Pradilla and Mosquera65,Reference Guedes, Martini and Borges68,Reference Guedes, De Matos and Lopes69,Reference Kløvgaard, Nielsen and Sørensen71,Reference Rosner, Prineas and Loggie74,Reference Nyati, Pettifor and Norris77,Reference Aeberli, Gut-Knabenhans and Kusche-Ammann78,Reference Mumm, Hermanussen and Scheffler85,Reference Mumm, Scheffler and Hermanussen86,Reference Nielsen, Olsen and Juul88,Reference Savva, Kourides and Tornaritis91–Reference Shah, Radia and McCarthy93,Reference Rush, Obolonkin and Savila96,Reference Abdulrazzaq, Nagelkerke and Moussa97) . The sample size of the studies ranged from 279(Reference Kløvgaard, Nielsen and Sørensen71) to 232 140 participants(Reference Ma, Wang and Song47). Only five studies did not present sample stratified by sex(Reference Li, Lin and Lin46,Reference Mazicioglu, Kurtoglu and Ozturk48,Reference Addo and Himes62,Reference Fernández, Redden and Pietrobelli67,Reference Nyati, Pettifor and Norris77) . One study presented sample stratified by ethnicity (African-American, European-American and Mexican-American)(Reference Fernández, Redden and Pietrobelli67). One study presented sample composed only of males(Reference Mumm, Scheffler and Hermanussen86), and one study presented sample composed only of females(Reference Mumm, Hermanussen and Scheffler85). Studies were quite heterogeneous in terms of age, comprising the age group from 0 to 20 years (Table 1).
Only five studies did not use the LMS method to elaborate curves, four of them used the polynomial regression method(Reference Al-Isa and Thalib24,Reference Hosseini, Navidi and Hesamifard38,Reference Rosner, Prineas and Loggie74,Reference Savva, Kourides and Tornaritis91) and one study used the percentile regression method(Reference Fernández, Redden and Pietrobelli67) (Table 1).
Characteristics of studies in relation to anthropometric indicators used to elaborate reference growth curves in children and adolescents
Of the eighty-six studies, forty-four used BMI for age to elaborate reference growth curves for underweight, overweight and obesity, being the most prevalent anthropometric indicator(Reference Nyankovskyy, Dereń and Wyszyńska1,Reference Gomez-Campos, Arruda and Andruske2,Reference Díaz Bonilla, Torres Galvis and Gómez-Campos11,Reference Moreno, Mesana and González-Gross15,Reference Barbosa Filho, Lopes and Fagundes19,Reference Silva, Maia and Claessens20,Reference Conde and Monteiro22,Reference Al-Isa and Thalib24,Reference Bundak, Furman and Gunoz29–Reference El Mouzan, Al Salloum and Al Omer32,Reference Al Herbish, El Mouzan and Al Salloum36–Reference Hosseini, Navidi and Hesamifard38,Reference Jiang, Cole and Pan40–Reference Khadilkar, Khadilkar and Cole42,Reference Li, Lin and Lin46,Reference Ma, Wang and Song47,Reference Özer51,Reference Pandey, Madhavan and Misra53,Reference Qiu, Guo and Duan56,Reference Shaik, El Mouzan and Al Salloum58,Reference Shang, Xu and Jiang59,Reference Virani61,Reference Bustamante, Freitas and Pan63–Reference De Plata, Pradilla and Mosquera65,Reference Kløvgaard, Nielsen and Sørensen71,Reference Rosner, Prineas and Loggie74,Reference Ghouili, Khalifa and Ouerghi76,Reference Nyati, Pettifor and Norris77,Reference Cacciari, Milani and Balsamo79,Reference Chaves, Baxter-Jones and Souza80,Reference Mumm, Hermanussen and Scheffler85,Reference Mumm, Scheffler and Hermanussen86,Reference Nielsen, Olsen and Juul88,Reference Nielsen, Olsen and Juul88–Reference Savva, Kourides and Tornaritis91,Reference Smpokos, Linardakis and Taliouri94,Reference Rush, Obolonkin and Savila96,Reference Abdulrazzaq, Nagelkerke and Moussa97) (online Supplementary File 1).
Twenty-nine studies took into account BM for age to elaborate reference growth curves for underweight, overweight and obesity in children and adolescents(Reference Nyankovskyy, Dereń and Wyszyńska1,Reference Gomez-Campos, Arruda and Andruske2,Reference Díaz Bonilla, Torres Galvis and Gómez-Campos11,Reference Silva, Maia and Claessens20,Reference Altunay, Kondolot and Poyrazoğlu25,Reference Chacar and Salameh30–Reference El-Mouzan, Al-Herbish and Al-Salloum33,Reference Hosseini, Navidi and Hesamifard38,Reference Khadilkar, Khadilkar and Cole42,Reference Li, Lin and Lin46,Reference Özer51,Reference Shaik, El Mouzan and Al Salloum58,Reference Bustamante, Freitas and Pan63,Reference Campos, de Arruda and Hespanhol64,Reference Guedes, Martini and Borges68,Reference Guedes, De Matos and Lopes69,Reference Kløvgaard, Nielsen and Sørensen71,Reference Oyhenart, Lomaglio and Dahinten72,Reference Nyati, Pettifor and Norris77,Reference Nyati, Pettifor and Norris77,Reference Cacciari, Milani and Balsamo79,Reference Chaves, Baxter-Jones and Souza80,Reference Mumm, Hermanussen and Scheffler85,Reference Mumm, Scheffler and Hermanussen86,Reference Nielsen, Olsen and Juul88,Reference Nielsen, Olsen and Juul88,Reference Savva, Kourides and Tornaritis91,Reference Smpokos, Linardakis and Taliouri94,Reference Rush, Obolonkin and Savila96) . Twenty-five studies took into account height for age to elaborate reference growth curves for underweight, overweight and obesity in children and adolescents(Reference Nyankovskyy, Dereń and Wyszyńska1,Reference Gomez-Campos, Arruda and Andruske2,Reference Gomez-Campos, Arruda and Andruske2,Reference Díaz Bonilla, Torres Galvis and Gómez-Campos11,Reference Silva, Maia and Claessens20,Reference Silva, Maia and Claessens20,Reference Chacar and Salameh30–Reference El-Mouzan, Al-Herbish and Al-Salloum33,Reference Hosseini, Navidi and Hesamifard38,Reference Khadilkar, Khadilkar and Cole42,Reference Özer51,Reference Bustamante, Freitas and Pan63,Reference Campos, de Arruda and Hespanhol64,Reference Guedes, Martini and Borges68,Reference Guedes, De Matos and Lopes69,Reference Oyhenart, Lomaglio and Dahinten72,Reference Nyati, Pettifor and Norris77,Reference Cacciari, Milani and Balsamo79,Reference Chaves, Baxter-Jones and Souza80,Reference Mumm, Hermanussen and Scheffler85,Reference Mumm, Scheffler and Hermanussen86,Reference Nielsen, Olsen and Juul88,Reference Savva, Kourides and Tornaritis91,Reference Smpokos, Linardakis and Taliouri94,Reference Rush, Obolonkin and Savila96) . One study used total length for the development of reference growth curves for underweight, overweight and obesity in children and adolescents(Reference El-Mouzan, Al-Herbish and Al-Salloum33) (online Supplementary File 1).
Regarding anthropometric indexes, nine studies used waist-to-hip ratio to elaborate reference growth curves for underweight, overweight and obesity(Reference Inokuchi, Matsuo and Takayama14,Reference Moreno, Mesana and Gonzalez-Gross16,Reference Barbosa Filho, Lopes and Fagundes19,Reference Kuriyan, Thomas and Lokesh45,Reference Mushtaq, Gull and Abdullah50,Reference Sung, So and Choi60,Reference Ramírez-Vélez, Moreno-Jiménez and Correa-Bautista73,Reference Aeberli, Gut-Knabenhans and Kusche-Ammann78,Reference Santos, Moreira and Ruiz90) . Four studies used waist-to-height ratio to elaborate reference growth curves for underweight, overweight and obesity mainly the central(Reference Moreno, Mesana and Gonzalez-Gross16,Reference Kelishadi, Gouya and Ardalan41,Reference Mushtaq, Gull and Abdullah50,Reference Pandey, Madhavan and Misra53) . Two studies used BM for height (BM/height) to elaborate reference growth curves for underweight, overweight and obesity(Reference Bagheri27,Reference El-Mouzan, Al-Herbish and Al-Salloum33) . One study used BM/total length (BM/length) to elaborate reference growth curves for underweight, overweight and obesity(Reference El-Mouzan, Al-Herbish and Al-Salloum33). Two studies took into account total length/height to elaborate reference growth curves for underweight, overweight and obesity(Reference Shaik, El Mouzan and Al Salloum58,Reference Kløvgaard, Nielsen and Sørensen71) . Two studies used arm fat area and arm muscle area to elaborate reference curves to identify underweight, overweight and obesity(Reference Oyhenart, Torres and Garraza17,Reference Ozturk, Budak and Cicek52) (online Supplementary File 1).
With regard to skinfolds, eight studies used triceps skinfold for the development of reference growth curves for underweight, overweight and obesity in children and adolescents(Reference Brannsether, Roelants and Bjerknes12,Reference Cicek, Ozturk and Unalan13,Reference Moreno, Mesana and Gonzalez-Gross16,Reference Kromeyer-Hauschild, Glässer and Zellner44,Reference Ozturk, Budak and Cicek52,Reference Addo and Himes62,Reference Frainer, Vasconcelos and Costa66,Reference Jaworski, Kułaga and Płudowski82) . Eight studies used subscapular skinfold for the construction of reference growth curves for underweight, overweight and obesity(Reference Brannsether, Roelants and Bjerknes12,Reference Cicek, Ozturk and Unalan13,Reference Moreno, Mesana and Gonzalez-Gross16,Reference Kromeyer-Hauschild, Glässer and Zellner44,Reference Pandey, Madhavan and Misra53,Reference Addo and Himes62,Reference Frainer, Vasconcelos and Costa66,Reference Jaworski, Kułaga and Płudowski82) . Two studies used suprailiac skinfold to elaborate reference growth curves for underweight, overweight and obesity(Reference Cicek, Ozturk and Unalan13,Reference Frainer, Vasconcelos and Costa66) . One study used biceps skinfold to develop reference growth curves for underweight, overweight and obesity(Reference Cicek, Ozturk and Unalan13). One study took into account calf skinfold for the construction of reference growth curves for underweight, overweight and obesity in children and adolescents(Reference Frainer, Vasconcelos and Costa66). One study took into account the abdominal skinfold for the construction of reference growth curves for underweight, overweight and obesity(Reference Jaworski, Kułaga and Płudowski82) (online Supplementary File 1).
Regarding body perimeters, thirty-three studies used waist circumference to elaborate reference growth curves for underweight, overweight and obesity mainly abdominal, in children and adolescents(Reference Gomez-Campos, Arruda and Andruske2,Reference Moreno, Mesana and Gonzalez-Gross16,Reference Barbosa Filho, Lopes and Fagundes19,Reference Anzo, Inokuchi and Matsuo26,Reference Hatipoglu, Mazicioglu and Poyrazoglu34,Reference Hatipoglu, Ozturk and Mazicioglu35,Reference Jackson, Al Hamad and Prakash39,Reference Kelishadi, Gouya and Ardalan41,Reference Kuriyan, Thomas and Lokesh45,Reference Mukherjee, Leong and Wong49,Reference Mushtaq, Gull and Abdullah50,Reference Pandey, Madhavan and Misra53–Reference Poh, Jannah and Chong55,Reference Sung, So and Choi60,Reference Virani61,Reference Bustamante, Freitas and Pan63,Reference De Plata, Pradilla and Mosquera65,Reference Fernández, Redden and Pietrobelli67,Reference Katzmarzyk70,Reference Ramírez-Vélez, Moreno-Jiménez and Correa-Bautista73,Reference Vargas, Souki and Ruiz75,Reference Nyati, Pettifor and Norris77,Reference Aeberli, Gut-Knabenhans and Kusche-Ammann78,Reference Chaves, Baxter-Jones and Souza80,Reference Galcheva, Iotova and Yotov81,Reference McCarthy, Jarrett and Crawley84,Reference Nawarycz, Krzyżaniak and Stawińska-Witoszyńska87,Reference Santos, Moreira and Ruiz90–Reference Shah, Radia and McCarthy93,Reference Eisenmann95) . Three studies used head perimeter(Reference Moreno, Mesana and Gonzalez-Gross16,Reference Kelishadi, Gouya and Ardalan41,Reference Nyati, Pettifor and Norris77) and two studies used arm perimeter(Reference Oyhenart, Torres and Garraza17,Reference Ayatollahi and Shayan28) . Three studies used head perimeter(Reference El-Mouzan, Al-Herbish and Al-Salloum33,Reference Shaik, El Mouzan and Al Salloum58,Reference Smpokos, Linardakis and Taliouri94) , and two studies used neck perimeter(Reference Kondolot, Horoz and Poyrazoğlu43,Reference Mazicioglu, Kurtoglu and Ozturk48) (online Supplementary File 1).
Characteristics of studies in relation to percentiles (P) used to elaborate reference growth curves in children and adolescents and percentiles used to identify underweight, overweight and obesity in children and adolescents
The percentiles identified in studies on reference growth curves for underweight, overweight and obesity varied, and percentiles are presented in online Supplementary File 2. Thirty-six studies presented percentiles used in reference growth curves to identify underweight children and adolescents ranging from P1 to P10(Reference Nyankovskyy, Dereń and Wyszyńska1,Reference Gomez-Campos, Arruda and Andruske2,Reference Díaz Bonilla, Torres Galvis and Gómez-Campos11,Reference Cicek, Ozturk and Unalan13,Reference Moreno, Mesana and González-Gross15,Reference Moreno, Mesana and Gonzalez-Gross16,Reference Conde and Monteiro22,Reference Altunay, Kondolot and Poyrazoğlu25,Reference Bagheri27,Reference Ayatollahi and Shayan28,Reference Hatipoglu, Mazicioglu and Poyrazoglu34,Reference Hatipoglu, Ozturk and Mazicioglu35,Reference Hosseini, Baikpour and Yousefifard37,Reference Jiang, Cole and Pan40,Reference Kromeyer-Hauschild, Glässer and Zellner44,Reference Ozturk, Budak and Cicek52,Reference Qiu, Guo and Duan56,Reference Shaik, El Mouzan and Al Salloum58,Reference Shang, Xu and Jiang59,Reference Bustamante, Freitas and Pan63,Reference Bustamante, Freitas and Pan63–Reference De Plata, Pradilla and Mosquera65,Reference Kløvgaard, Nielsen and Sørensen71,Reference Oyhenart, Lomaglio and Dahinten72,Reference Ghouili, Khalifa and Ouerghi76–Reference Galcheva, Iotova and Yotov81,Reference Luciano, Bressan and Zoppi83,Reference Mumm, Hermanussen and Scheffler85,Reference Mumm, Scheffler and Hermanussen86,Reference Nielsen, Olsen and Juul88,Reference Eisenmann95,Reference Abdulrazzaq, Nagelkerke and Moussa97) . Thirty-nine studies presented percentiles used in reference growth curves to identify overweight in children and adolescents ranging from P75 to P90(Reference Nyankovskyy, Dereń and Wyszyńska1,Reference Gomez-Campos, Arruda and Andruske2,Reference Díaz Bonilla, Torres Galvis and Gómez-Campos11–Reference Inokuchi, Matsuo and Takayama14,Reference Conde and Monteiro22,Reference Al-Isa and Thalib24,Reference Al-Isa and Thalib24,Reference Anzo, Inokuchi and Matsuo26–Reference Bundak, Furman and Gunoz29,Reference El Mouzan, Al Salloum and Al Omer32,Reference Hatipoglu, Mazicioglu and Poyrazoglu34,Reference Hatipoglu, Ozturk and Mazicioglu35,Reference Jiang, Cole and Pan40,Reference Khadilkar, Khadilkar and Cole42,Reference Özer51–Reference Pandey, Madhavan and Misra53,Reference Shaik, El Mouzan and Al Salloum58,Reference Virani61–Reference Campos, de Arruda and Hespanhol64,Reference Frainer, Vasconcelos and Costa66,Reference Kløvgaard, Nielsen and Sørensen71,Reference Ramírez-Vélez, Moreno-Jiménez and Correa-Bautista73,Reference Rosner, Prineas and Loggie74,Reference Ghouili, Khalifa and Ouerghi76,Reference Aeberli, Gut-Knabenhans and Kusche-Ammann78,Reference Chaves, Baxter-Jones and Souza80,Reference Galcheva, Iotova and Yotov81,Reference Nielsen, Olsen and Juul88,Reference Rosario, Kurth and Stolzenberg89,Reference Savva, Kourides and Tornaritis91,Reference Smpokos, Linardakis and Taliouri94,Reference Smpokos, Linardakis and Taliouri94,Reference Eisenmann95,Reference Abdulrazzaq, Nagelkerke and Moussa97) (online Supplementary File 1).
Sixty-seven studies presented percentiles used in reference growth curves to identify obesity in children and adolescents ranging from P75 to P99·6 (online Supplementary File 1).
Nineteen studies did not report percentiles used in reference growth curves to define underweight, overweight and obesity(Reference Oyhenart, Torres and Garraza17,Reference Silva, Maia and Claessens20,Reference Chacar and Salameh30–Reference El-Mouzan, Al-Herbish and Al-Salloum33,Reference Al Herbish, El Mouzan and Al Salloum36,Reference Kelishadi, Gouya and Ardalan41,Reference Li, Lin and Lin46,Reference Ma, Wang and Song47,Reference Qiu, Guo and Duan56,Reference Sakamoto and Yang57,Reference Sung, So and Choi60,Reference Guedes, Martini and Borges68,Reference Guedes, De Matos and Lopes69,Reference Jaworski, Kułaga and Płudowski82,Reference Luciano, Bressan and Zoppi83,Reference Santos, Moreira and Ruiz90,Reference Rush, Obolonkin and Savila96) (online Supplementary File 1).
Characteristics of studies in relation to variables used for stratification and modelling of reference growth curves in children and adolescents
All studies considered sex and age group for stratification and modelling of reference growth curves for children and adolescents (n 86). In addition, one study took into account regions of the country for stratification and modelling of curves(Reference Cacciari, Milani and Balsamo79), two studies considered ethnicity(Reference Fernández, Redden and Pietrobelli67,Reference Rosner, Prineas and Loggie74) and one study considered menarche(Reference Mumm, Scheffler and Hermanussen86). One study took into account the maturational stage for stratification and modelling of reference growth curves for children and adolescents(Reference Mumm, Hermanussen and Scheffler85), one study considered skin colour(Reference Mumm, Hermanussen and Scheffler85) and two studies considered area of residence(Reference Qiu, Guo and Duan56,Reference Shang, Xu and Jiang59) (online Supplementary File 1).
Risk of bias assessment
Regarding the methodological quality, when considering the overall score of included studies (n 86), it was found that the highest score obtained was 13(Reference Silva, Maia and Claessens20,Reference Li, Lin and Lin46,Reference Addo and Himes62,Reference Kløvgaard, Nielsen and Sørensen71,Reference Nyati, Pettifor and Norris77,Reference Rush, Obolonkin and Savila96) , and the lowest score of studies was 10(Reference Díaz Bonilla, Torres Galvis and Gómez-Campos11,Reference Jiang, Cole and Pan40,Reference Mazicioglu, Kurtoglu and Ozturk48,Reference Campos, de Arruda and Hespanhol64,Reference Luciano, Bressan and Zoppi83) (Table 2).
Table 2. Bias risk assessment of studies included in the systematic review
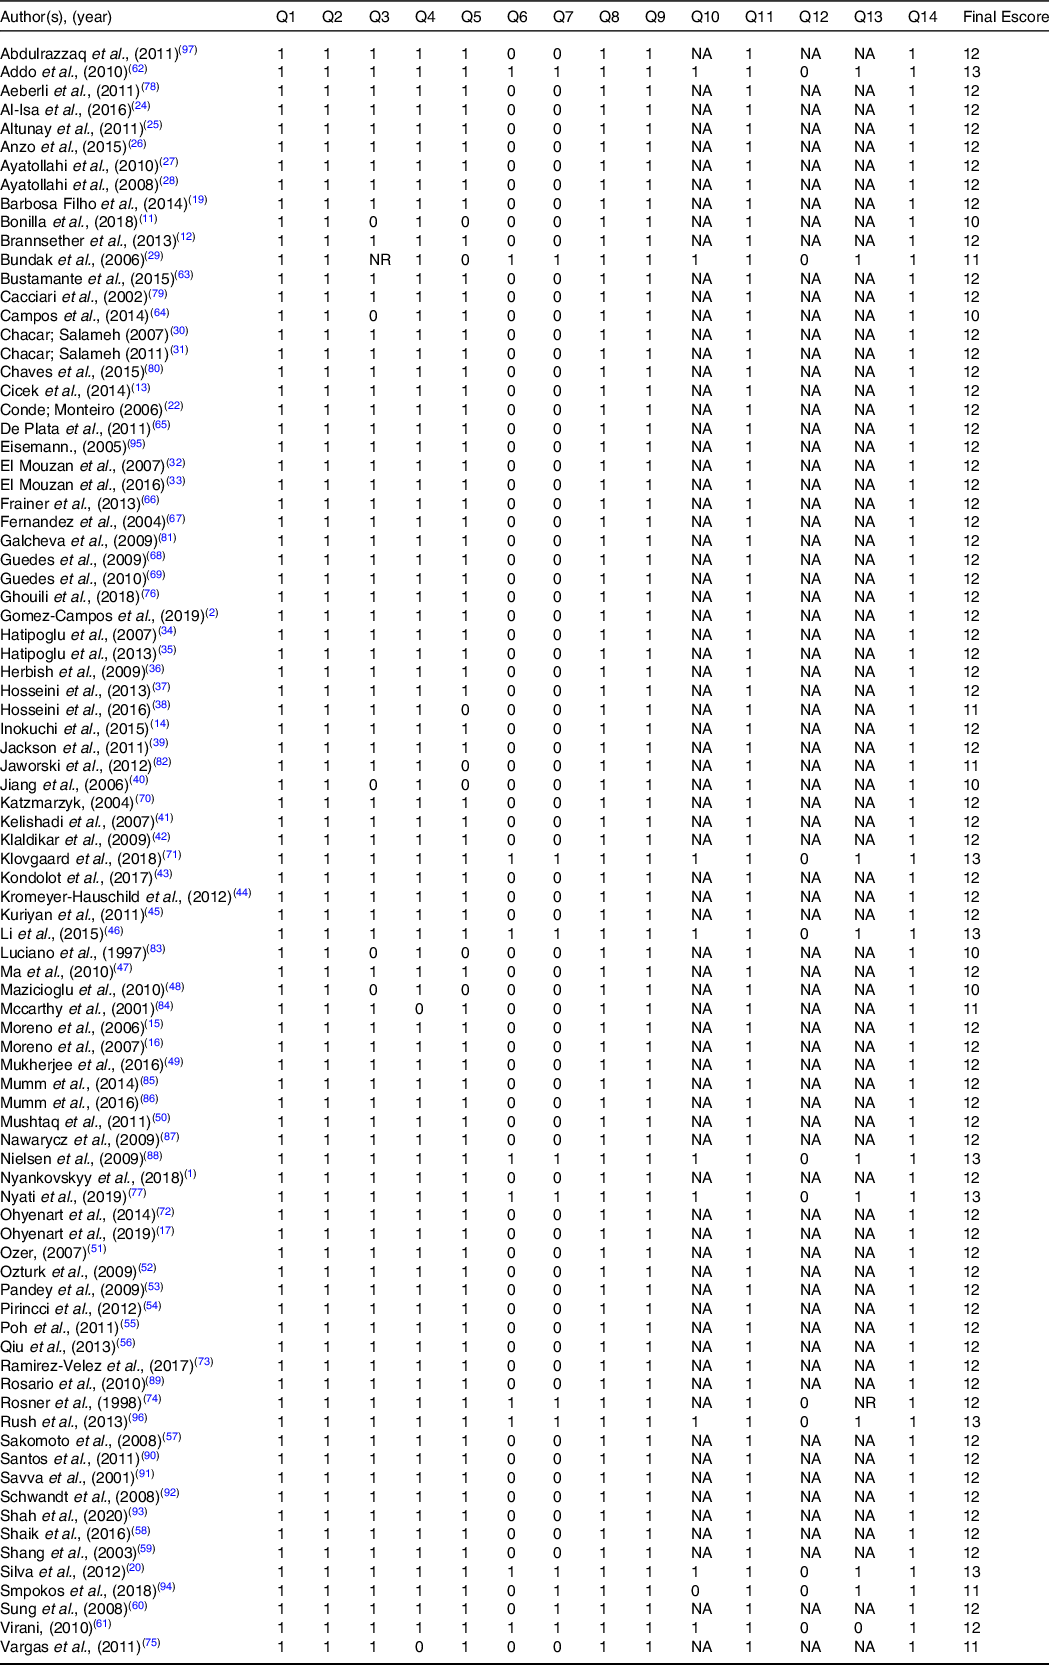
1, yes; 2, no; NA, not applicable; NR, not reported. Q1: Was the research question or objective in this study clearly stated?; Q2: Was the study population clearly specified and defined?; Q3: Was the participation rate of eligible persons at least 50 %?; Q4: Were all the subjects selected or recruited from the same or similar populations (including the same time period)? Were inclusion and exclusion criteria for being in the study pre-specified and applied uniformly to all participants?; Q5: Was a sample size justification, power description or variance and effect estimates provided?; Q6: For the analyses in this study, were the exposures of interest measured prior to the outcome(s) being measured?; Q7: Was the time frame sufficient so that one could reasonably expect to see an association between exposure and outcome if it existed?; Q8: For exposures that can vary in amount or level, did the study examine different levels of the exposure as related to the outcome (e.g. categories of exposure or exposure measured as a continuous variable)?; Q9: Were the exposure measures (independent variables) clearly defined, valid, reliable and implemented consistently across all study participants?; Q10: Were the exposures assessed more than once over time?; Q11: Were the outcome measures (dependent variables) clearly defined, valid, reliable and implemented consistently across all study participants?; Q12: Were the outcome assessors blinded to the exposure status of participants?; Q13: Was loss to follow-up after baseline 20 % or less?; Q14: Were key potential confounding variables measured and adjusted statistically for their impact on the relationship between exposures and outcomes?
Discussion
This systematic review identified eighty-six studies that took into account growth curves for underweight, overweight and obesity, with forty studies carried out in the Asian continent, thirty-two studies carried out in Europe, twenty studies carried out in the Americas, two studies carried out in Africa and two studies carried out in Oceania. Reference growth curves are used all over the world, both to estimate height–BM changes over time and to estimate the growth of these parameters and population weight status(Reference Brannsether, Roelants and Bjerknes12,Reference Barbosa Filho, Lopes and Fagundes19,Reference Conde and Monteiro22,Reference El-Mouzan, Al-Herbish and Al-Salloum33,Reference Aeberli, Gut-Knabenhans and Kusche-Ammann78,Reference Abdulrazzaq, Nagelkerke and Moussa97) . Although there are institutions such as the CDC, WHO and IOTF that have developed standard growth curves to estimate the weight status of the world population, several countries, from all continents, develop their own reference growth curves(Reference Khadilkar and Khadilkar6,Reference Díaz Bonilla, Torres Galvis and Gómez-Campos11,Reference Hatipoglu, Ozturk and Mazicioglu35,Reference Hosseini, Baikpour and Yousefifard37,Reference Hosseini, Navidi and Hesamifard38,Reference Bustamante, Freitas and Pan63,Reference Fernández, Redden and Pietrobelli67) . Since prescriptive growth patterns define how a population of children should grow, following ideal nutrition and ideal health, on the other hand, reference growth curves emerged, which are descriptive and elaborated from a population that believes to be growing up in the best possible state of nutrition and health in a given community, describing the growth of children at a specific time(Reference Natale and Rajagopalan3,Reference Khadilkar and Khadilkar6) . Although the standard curve is the growth objective to be achieved, the elaboration of reference growth curves by countries is necessary to verify the phenomenon of the secular trend of thinness, overweight and obesity. In addition, the growth curves are useful for demonstrating genetic and geographic differences between populations and generations, as well as exploring possible economic and cultural differences between countries(Reference Natale and Rajagopalan3,Reference Khadilkar and Khadilkar6–Reference Cole, Bellizzi and Flegal8,Reference Díaz Bonilla, Torres Galvis and Gómez-Campos11,Reference Hatipoglu, Ozturk and Mazicioglu35,Reference Hosseini, Baikpour and Yousefifard37,Reference Hosseini, Navidi and Hesamifard38,Reference Bustamante, Freitas and Pan63,Reference Fernández, Redden and Pietrobelli67) .
The most prevalent anthropometric indicators for the construction of a reference growth curve for underweight, overweight and obesity were BMI for age (forty-six studies), waist circumference (thirty-three studies), BM for age (twenty-nine studies) and height for age (twenty-five studies). The justification for the greater use of these anthropometric indicators is related to the simplicity of measurement, with less possibility of technical errors and low operational cost(Reference Li, Lin and Lin46,Reference Kløvgaard, Nielsen and Sørensen71,Reference Ramírez-Vélez, Moreno-Jiménez and Correa-Bautista73,Reference Mumm, Hermanussen and Scheffler85,Reference Shah, Radia and McCarthy93) . Thus, BMI is the anthropometric indicator most frequently used to identify the reference physical growth and weight status in clinical and epidemiological practice, as it is a simple and low-cost indicator and strong discriminator of child and adolescent health and for presenting highly significant correlation with BM and height(Reference Barbosa Filho, Lopes and Fagundes19,Reference El Mouzan, Al Salloum and Al Omer32,Reference Chaves, Baxter-Jones and Souza80,Reference Alves Junior, Mocellin and Gonçalves98) . Limitations of BMI must be considered, as BMI assesses not only fat mass but also fat-free mass(Reference Cicek, Ozturk and Unalan13,Reference El Mouzan, Al Salloum and Al Omer32,Reference Al Herbish, El Mouzan and Al Salloum36,Reference Hosseini, Baikpour and Yousefifard37,Reference Chaves, Baxter-Jones and Souza80,Reference Alves Junior, Mocellin and Gonçalves98) . It is a good index to identify those children with ‘adequate’ adiposity, but among those with high BMI, there is an important proportion of children with normal adiposity(Reference Cicek, Ozturk and Unalan13,Reference El Mouzan, Al Salloum and Al Omer32,Reference Al Herbish, El Mouzan and Al Salloum36,Reference Hosseini, Baikpour and Yousefifard37,Reference Qiu, Guo and Duan56,Reference Chaves, Baxter-Jones and Souza80,Reference Alves Junior, Mocellin and Gonçalves98) . BM for age and height for age are also widely used to identify malnutrition, overweight and obesity in children and adolescents, taking into account the simplicity of measurements and its use to calculate BMI(Reference Inokuchi, Matsuo and Takayama14,Reference Hosseini, Navidi and Hesamifard38,Reference Shaik, El Mouzan and Al Salloum58,Reference Ghouili, Khalifa and Ouerghi76,Reference Nyati, Pettifor and Norris77,Reference Smpokos, Linardakis and Taliouri94) . Waist circumference is widely used in population surveys, as it is a highly sensitive and specific measure of central body fat in childhood and adolescence to identify overweight and obesity and discriminate risk for metabolic complications(Reference Anzo, Inokuchi and Matsuo26,Reference Mukherjee, Leong and Wong49,Reference Bustamante, Freitas and Pan63,Reference Ramírez-Vélez, Moreno-Jiménez and Correa-Bautista73,Reference Nyati, Pettifor and Norris77,Reference Chaves, Baxter-Jones and Souza80) . The percentiles used to define underweight in the reference growth curves in children and adolescents ranged from P1 to P10. The most prevalent underweight percentiles found in studies were P3 and P5, which is in line with percentiles suggested by WHO, IOTF and CDC(Reference Kuczmarski7,Reference Cole, Bellizzi and Flegal8,10) . However, the values present in studies included in this review differ from those presented by WHO, IOTF and CDC. Thus, the development of growth curves to identify underweight is necessary, as different locations in the world have different subsistence conditions, which can directly interfere with nutritional conditions(Reference Natale and Rajagopalan3).
The percentiles used to define overweight in reference growth curves for children and adolescents ranged from P75 to P90. The most prevalent percentile found in studies to identify overweight was P85, which is in line with values recommended by WHO, IOTF and CDC. However, values of this percentile in studies were either below or above those recommended by the aforementioned agencies, demonstrating that the variability of physical growth and human development is characterised by intra- and inter-population heterogeneity, resulting from the continuous and complex interaction between genes and mesogenic conditions(Reference Natale and Rajagopalan3,Reference Díaz Bonilla, Torres Galvis and Gómez-Campos11) . Thus, percentile values related to overweight are different in different locations around the world, requiring understanding the characteristics of the population under study.
The percentiles used to identify obesity in the reference growth curves of children and adolescents ranged from P75 to P99·6. The most prevalent percentiles used to identify obesity found in studies were P95 and P97. However, both P75, P85 and P90, which were also used to identify overweight in studies, were also used to identify obesity, demonstrating once again that percentiles vary depending on the country and population under study(Reference Díaz Bonilla, Torres Galvis and Gómez-Campos11). The aetiology of obesity is complex, with a multifactorial character that involves historical, ecological, political, socio-economic, psychosocial, cultural, biological factors, in addition to the possible imbalance between inadequate nutrition and insufficient physical activity practices(Reference Llewellyn, Simmonds and Owen4,Reference Díaz Bonilla, Torres Galvis and Gómez-Campos11,Reference Kolotkin and Andersen99) . Due to this multifactorial character of obesity, studies show greater variability of percentiles to identify it.
All studies considered sex and age group for stratification and modelling of reference growth curves for children and adolescents. Sex and age group are important variables to be considered when modelling reference growth curves, especially in the age groups in which the process of sexual maturation and release of the testosterone hormone in boys begins, which provides an increase in the fat-free mass and the estradiol hormone in girls, which causes an increase in fat mass(Reference Malina, Bouchard and Bar-Or100).
Regarding the methodological quality, when considering the overall score of studies (n 86), it was found that the highest score obtained was 13, and the lowest score was 10. Since most studies have cross-sectional design (seventy-five studies), it was not possible to verify the trend of underweight, overweight and obesity in children and adolescents, as there was no more than one assessment over time. Longitudinal, cohort or cross-sectional studies could more concretely address the secular trend regarding weight status, contributing to greater elucidation of underweight, overweight and obesity in the different locations specified in this systematic review.
The method used in studies for modelling reference growth curves for underweight, overweight and obesity was the LMS method (eighty-one studies). The L parameter represents the Box–Cox coefficient used for the mathematical transformation of values of anthropometric indicators with the aim of obtaining normal distribution in each stratum. The value selected for the L coefficient is the one whose transformation produces the smallest sum of squares of the variable’s deviations. The M parameter expresses the median value of the index observed within each stratum; the S parameter represents the CV of each stratum(Reference Cole, Bellizzi and Flegal8). LMS is the method mostly used in the elaboration of growth curves, because the main assumption of this method is that for independent data with positive values, the Box–Cox transformation, at each age, can be used to normalise data that present asymmetry in their distribution(Reference Cole, Bellizzi and Flegal8).
The main limitations of this systematic review are the heterogeneity of included studies, such as age group, sample size and the variability of percentiles used to identify underweight, overweight and obesity, which does not allow the recommendation of a specific percentile for the definition of underweight, overweight and obesity, but the presentation of the most prevalent percentiles. In addition, some studies did not indicate the specific percentiles for underweight, overweight and obesity, only demonstrating the sample percentiles. It should be added that the study was limited to English, Spanish and Portuguese. The systematic search carried out in nine different databases and manual searches in grey literature (Google scholar) in order to find possible studies that were not retrieved by the search strategy are among the strengths of this study. In addition, studies were rigorously peer-reviewed, being submitted to the methodological quality analysis tool, which allows verifying aspects of internal and external validity of studies and there was the synthesis of data from eighty-six studies carried out in six continents, presenting percentile variability in identifying public health problems such as underweight, overweight and obesity.
Conclusion
We identified that there is great variability among percentiles for the identification of underweight, overweight and obesity in the paediatric population. The most prevalent percentiles for underweight were P3 and P5; for overweight, the most prevalent was P85 and the most prevalent percentiles for obesity were P95 and P97. The most prevalent anthropometric indicators used for growth curves were BMI, waist circumference, BM for age and height for age. Such data can be used to create strategies and public policies to reduce public health problems such as malnutrition and obesity and to identify underweight, overweight and obesity, taking into account the variability of physical growth and human development characterised by intra- and inter-population heterogeneity. Such data can demonstrate that the optimal growth must be reached, through the standard growth curves, but that the reference curves demonstrate a cut of the population growth, raising possible variables that can influence the optimal growth, such as an increase in the practice of physical activities and an awareness of proper nutrition.
Acknowledgements
Dr. Silva was financed in part by the Coordenação de Aperfeiçoamento de Pessoal de Nível Superior – Brazil (CAPES) – Finance Code 001 and Dr. Silva is supported in part by Conselho Nacional de Desenvolvimento Científico e Tecnológico – Brazil (CNPq) (309589/2021-5).
This research did not receive any specific grant from funding agencies in the public, commercial or not-for-profit sectors.
The authors’ responsibilities were as follows: C. A. S. J. and D. A. S. S.: designed the study; C. A. S. A. J., P. C. M., L. A. M. and D. A. S. S.: performed the literature search, implemented the methodology and wrote the first version of the manuscript; C. A. S. A. J., P. C. M., L. A. M. and D. A. S. S.: reviewed and edited the paper; L. A. M. and D. A. S. S. supervised the whole procedure and all authors contributed significantly to this manuscript, agree with its content and read and approved the final manuscript.
The authors have no relevant interests to declare.
Supplementary material
For supplementary materials referred to in this article, please visit https://doi.org/10.1017/S0007114522003786


