


1. Introduction
Solute transport through porous media is prevalent in numerous industrial applications, such as fixed-bed reactors (Jurtz, Kraume & Wehinger Reference Jurtz, Kraume and Wehinger2019), carbon dioxide geological sequestration (Bolster Reference Bolster2014; Amooie, Soltanian & Moortgat Reference Amooie, Soltanian and Moortgat2018), etc., thus making it a classic topic of research (Saffman Reference Saffman1959; Koch & Brady Reference Koch and Brady1985; Sahimi et al. Reference Sahimi, Hughes, Scriven and Davis1986; Bijeljic, Muggeridge & Blunt Reference Bijeljic, Muggeridge and Blunt2004; Borgne et al. Reference Borgne, Dentz, Bolster, Carrera, de Dreuzy and Davy2010; Puyguiraud, Gouze & Dentz Reference Puyguiraud, Gouze and Dentz2021; Bordoloi et al. Reference Bordoloi, Scheidweiler, Dentz, Bouabdellaoui, Abbarchi and de Anna2022; Dentz et al. Reference Dentz, Creppy, Douarche, Clément and Auradou2022). Porous media are regularly subjected to in-situ stresses originating from various sources such as high-pressure injection (Morris et al. Reference Morris, Hao, Foxall and McNab2011; Ranjith & Perera Reference Ranjith and Perera2011; Ringrose et al. Reference Ringrose, Mathieson, Wright, Selama, Hansen, Bissell, Saoula and Midgley2013), thermal stresses within the geothermal system (Chen, Jin & Wang Reference Chen, Jin and Wang2018) and geologic stresses at different depths in the formation (Kang et al. Reference Kang, Lei, Dentz and Juanes2019). These stressors bring about alterations in the pore structure, for instance, ground uplift by carbon dioxide injection in the In Salah formation (Morris et al. Reference Morris, Hao, Foxall and McNab2011; Ringrose et al. Reference Ringrose, Mathieson, Wright, Selama, Hansen, Bissell, Saoula and Midgley2013), thereby potentially exerting a significant impact on the dynamics of flow and mass transfer. The dispersion coefficient is one of the key parameters that governs solute transport through porous media, reflecting the ability to attenuate concentration gradients (Dentz, Hidalgo & Lester Reference Dentz, Hidalgo and Lester2023). The impact of compaction on the dispersion coefficient of the porous medium has attracted extensive research interest. Numerous studies have focused on the areas of subsurface disposal of radioactive waste and compaction of soils. The scenarios covered in these studies are mostly at small Péclet number  $Pe$, indicating that the dispersion coefficient of the porous medium tends to decrease with the degree of compaction (Hamamoto et al. Reference Hamamoto, Perera, Resurreccion, Kawamoto, Hasegawa, Komatsu and Moldrup2009; Kuncoro et al. Reference Kuncoro, Koga, Satta and Muto2014). Nevertheless, contrasting trends are observed in other investigations related to chromatographic separation, occurring at larger $Pe$. These studies demonstrate an entirely opposite trend, whereby an increase in the degree of compaction leads to a noticeable rise in the dispersion coefficient of the porous medium (Charlaix, Hulin & Plona Reference Charlaix, Hulin and Plona1987; Huh, Charlaix & Plona Reference Huh, Charlaix and Plona1988; Östergren & Trägårdh Reference Östergren and Trägårdh2000). In addition, multiple studies focused on the dispersion coefficient of rocks present consistent results: the dispersion coefficient shows a completely opposite dependence on the degree of consolidation across distinct ranges of $Pe$ (Bijeljic, Mostaghimi & Blunt Reference Bijeljic, Mostaghimi and Blunt2011; Goldobin Reference Goldobin2011; Boon, Bijeljic & Krevor Reference Boon, Bijeljic and Krevor2017).
Despite the widespread acknowledgment of the non-trivial dependence between the dispersion coefficient and the degree of compaction, research progress on the understanding and mechanism explanation of this phenomenon is still very limited. Numerical simulation is a powerful tool for elucidating the microscopic mechanisms of macroscopic phenomena, yet there are challenges in trading off the accuracy and efficiency of numerical methods. The majority of numerical investigations concerning the impact of compaction on solute transport through porous media have adopted continuum-based methods (Smith Reference Smith2000; Peters & Smith Reference Peters and Smith2002; Qiu, Chen & Tong Reference Qiu, Chen and Tong2022). While these methods demonstrate efficiency, they fail to resolve the changes in the microstructure, a determinant that profoundly influences flow and transport. On the other hand, a precise representation of pore structure evolution in response to pressure loads, along with accurate modelling of solute transport across a wide range of  $Pe$, encounters computational constraints. The discrete element method (DEM) is a particle-based approach designed to simulate the dynamic behaviour of granular materials subjected to external forces (Potyondy & Cundall Reference Potyondy and Cundall2004; Chen et al. Reference Chen, Jin and Wang2018), proved capable of capturing the evolution of the microstructure. However, DEM encounters challenges in computational efficiency when dealing with irregularly shaped elements or a large number of elements. Pore-scale modelling methods for flow and mass transfer through porous media can be broadly classified into two groups: direct numerical simulation (DNS) and the pore network model (PNM). Compared with DNS, PNM has a significant advantage in efficiency but a reduced accuracy due to simplifications of the actual structure and transport. The early PNMs used simplified regular capillary networks (Fatt Reference Fatt1956), which was simple but of low accuracy. This deficiency was improved significantly by extracting the network from the scanned actual structures (Lindquist et al. Reference Lindquist, Lee, Coker, Jones and Spanne1996; Dong & Blunt Reference Dong and Blunt2009). A recent progress in pore-throat segmentation (Liu et al. Reference Liu, Gong, Zhao, Jin and Wang2022) has dramatically improved the accuracy of PNM, even comparable to that of DNS. Furthermore, PNM exhibits capability in handling more intricate pore structures compared with other upscaling methods such as volume averaging and homogenization theory. The utilization of PNM has gained extensive prominence in investigating flow and transport phenomena within porous media (Bijeljic et al. Reference Bijeljic, Muggeridge and Blunt2004; Mehmani & Balhoff Reference Mehmani and Balhoff2015; Liu & Wang Reference Liu and Wang2022; Liu et al. Reference Liu, Gong, Xiao and Wang2024).
In this work, we investigate the impact of compaction on the longitudinal dispersion coefficient of porous media, utilizing a numerical framework that combines DEM and PNM. The DEM–PNM framework can effectively capture the evolution of the microstructure and efficiently simulate solute transport over a wide range of  $Pe$. We reveal the non-monotonic effect of compaction on the longitudinal dispersion coefficient, which is distinguished by the presence of three distinct regimes in the variation of dispersion coefficients. The underlying mechanisms are elucidated through a comprehensive analysis of statistics of the pore structure and the flow within porous media.
2. Methods
Herein, DEM and PNM are combined to investigate the impact of compaction on the longitudinal dispersion coefficient of sphere packs. This study focuses on the scenario where the time scale of the flow is far smaller than that of the structural deformation, i.e. the flow remains in a steady state. Therefore, the structural deformation and the solute transport are decoupled. Two steps are involved in the simulation: the first step is to track the movement of each constituent particle within the sphere pack through the application of DEM simulations. This step yields the pore structure when the assembly of spheres reaches the steady state under a specific pressure load  $P$. The second step includes the extraction of the pore network from the pore structure, followed by the implementation of PNM simulations of solute transport to obtain the dispersion coefficient $D_L^P$ for various $Pe$. Figure 1 shows a schematic representation of the simulation procedure.

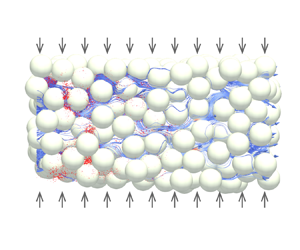
Figure 1. (a) Schematic illustration of the simulation procedure. Pore-throat segmentation is executed utilizing LoREPorTS (Liu et al. Reference Liu, Gong, Zhao, Jin and Wang2022). (b) Enlarged view of the pore structure for  $\sigma =0.1d_0$ and $P=70$ MPa. (c) Demonstration of flow and dispersion boundary conditions and breakthrough curve fitting; $P_f$ represents the fluid pressure and $C$ denotes solute concentration; $P_{in}$ and $P_{out}$ represent the fluid pressure at the inlet and outlet, respectively; PV denotes pore volume and $\boldsymbol {n}$ is the normal vector at the outlet plane.
The execution of DEM simulations is accomplished utilizing the open-source software Yade (Šmilauer et al. Reference Šmilauer, Catalano, Chareyre, Dorofeenko, Duriez, Dyck, Elias, Er, Eulitz and Gladky2015), within which the contact model and the integral model emerge as two crucial parts. The linear-spring-damping model (Cundall & Strack Reference Cundall and Strack1979) has been employed to calculate the contact forces between spheres, while the explicit integration algorithm has been utilized to update the positions of the spheres. The validity of the DEM algorithm has been substantiated through experimental data concerning the permeability–porosity relation (Tian et al. Reference Tian, Zhang, Zhou, Zhang and Wang2023).
The network model for flow and mass transfer has been presented in our previous work (Liu et al. Reference Liu, Gong, Xiao and Wang2024), and will not be repeated within this context. The reliability and accuracy of our PNM algorithm have been proved through rigorous validation against DNS solutions and experimental data, demonstrating relative errors of less than  $5\,\%$ in predicted concentration profiles and breakthrough curves (Liu et al. Reference Liu, Gong, Xiao and Wang2024). In the simulation of flow, the pressure boundaries are implemented at both the inlet and outlet. In the context of mass transfer simulation, a constant concentration is maintained at the inlet, while a fully developed boundary condition is assumed for the outflow. The determination of the dispersion coefficient is accomplished by fitting the breakthrough curve at the outlet, utilizing the analytical solution given by (Kumar, Jaiswal & Kumar Reference Kumar, Jaiswal and Kumar2009)
 \begin{align} C(x,T) &= 0.5 \text{erfc}\left(\frac{x-UT}{2\sqrt{D_L T}}\right) + 0.5\exp\left(\frac{Ux}{D_L}\right)\text{erfc}\left(\frac{x+UT}{2\sqrt{D_L T}}\right) \nonumber\\ &\quad - \sqrt{\frac{U^2 T}{{\rm \pi} D_L}} \exp\left(\frac{UL}{D_L} - \frac{(2L-x+UT)^2}{4D_L T}\right)\nonumber\\ &\quad + 0.5\left(2+\frac{U(2L-x)}{D_L} + \frac{U^2 T}{D_L}\right)\exp\left(\frac{UL}{D_L}\right)\text{erfc} \left(\frac{2L-x+UT}{2\sqrt{D_L T}}\right), \end{align}
where  $D_L$ is the dispersion coefficient, $U$ is the seepage velocity, $T$ is the injection time, $L$ is the longitudinal length of the domain, $x$ is the observation location and $C$ is the concentration.
3. Results and discussion
This study examines four distinct groups of sphere packs, wherein the diameters of the spheres follow a normal distribution. The grain size distributions for these four groups of sphere packs exhibit the same median  $d_0=140\ \mathrm {\mu }$m, but different standard deviations $\sigma =0, 0.025d_0, 0.05d_0$ and $0.1d_0$, respectively. The pore structure of sphere packs under a specific pressure load $P$ is obtained through DEM simulations, where $P$ spans a range from the initial pressure load $P_0=5$ MPa to the maximum pressure load $P_{max}=70$ MPa. In the simulations, the spheres are assigned a Young's modulus $E$ of 2.5 GPa and a Poisson's ratio of 0.33. These parameters are chosen in accordance with the properties typically observed in sedimentary rocks. A total of 40 000 spheres are randomly distributed within a confined box, enclosed by rigid walls on all four sides and at the bottom. Pressure is exerted from the top, compressing the spheres on the top surface and causing them to move downward. The spheres eventually reach a stable configuration for the specific pressure load $P$. Interactions between spheres upon contact result in elastic deformation, altering their original spherical shape. It is important to keep in mind that the dispersion coefficient of the sphere pack may not reach an asymptotic value when the radial size or longitudinal length is small (Han, Bhakta & Carbonell Reference Han, Bhakta and Carbonell1985; Dentz, Icardi & Hidalgo Reference Dentz, Icardi and Hidalgo2018; Souzy et al. Reference Souzy, Lhuissier, Méheust, Le Borgne and Metzger2020). To mitigate the potential impact of domain size on the simulation outcomes, a subdomain with dimensions of $13d_0 \times 13d_0 \times 95d_0$ is cropped from the pore structure, which is utilized for the subsequent simulation of flow and mass transfer. Referring to experimental data and considering underground application scenarios (Boon et al. Reference Boon, Bijeljic and Krevor2017), solute transport across a range of $Pe$ spanning from $10^{-2}$ to $10^{4.8}$ is modelled through the manipulation of the pressure difference between the inlet and the outlet. Under laminar flow conditions, there is no limitation on the PNM simulation for the $Pe$ range. Here $Pe$ is defined as $Ud_0 / D_m$, where $U$ is the seepage velocity and the molecular diffusion coefficient $D_m$ is $4.6 \times 10^{-10}\ {\rm m}^{2}\ {\rm s}^{-1}$.
To present the results intuitively, the dispersion coefficient is normalized by that under the initial pressure load of  $P_0=5$ MPa. Figure 2(a) illustrates the normalized dispersion coefficient ( $D_L^P / D_L^{P_0}$) as it varies with the pressure load for different $Pe$, from which a non-monotonic dependence is observed. Specifically, at small $Pe$, the dispersion coefficient exhibits a negative dependence on the pressure load; however, the dependence shifts to a positive type as $Pe$ increases, which is consistent with experimental observations (Charlaix et al. Reference Charlaix, Hulin and Plona1987; Huh et al. Reference Huh, Charlaix and Plona1988; Östergren & Trägårdh Reference Östergren and Trägårdh2000; Hamamoto et al. Reference Hamamoto, Perera, Resurreccion, Kawamoto, Hasegawa, Komatsu and Moldrup2009; Kuncoro et al. Reference Kuncoro, Koga, Satta and Muto2014). We define the variation in dispersion coefficients as $\kappa =(D_L^{P_{max}} / D_L^{P_0})-1$, where $D_L^{P_0}$ and $D_L^{P_{max}}$ are the dispersion coefficients corresponding to the initial pressure load $P_0=5$ MPa and the maximum pressure load $P_{max}=70$ MPa, respectively. The sign and absolute value of $\kappa$ reveal the trend and sensitivity of the dispersion coefficient with pressure load, respectively. Notably, the variation of $\kappa$ with $Pe$ manifests three distinct regimes (figure 2b). Regime I ( $Pe<0.1$): $\kappa$ demonstrates a negative value while maintaining a consistent $Pe$-independence. Regime II ( $0.1< Pe<1000$): $\kappa$ exhibits a transition from a negative to a positive value, reaching its peak at approximately $Pe=30$, and subsequently declining to a positive plateau. Regime III ( $Pe>1000$): $\kappa$ remains positive and invariant with $Pe$. The four groups of sphere packs exhibit a similar relationship between the dispersion coefficient and the pressure load. For conciseness, we only elaborate on the results and analyses for monodisperse sphere packs (i.e. $\sigma =0$), while those associated with polydisperse sphere packs (i.e. $\sigma =0.025d_0, 0.05d_0$ and $0.1d_0$) will be briefly presented at the end of this section. Throughout the subsequent discussion, it is important to note that the sphere packs refer to the monodisperse sphere packs unless otherwise stated.

Figure 2. (a) Contour of the normalized dispersion coefficient  $D_L^P / D_L^{P_0}$ of monodisperse sphere packs (i.e. $\sigma =0$) as it varies with the normalized pressure load $P / P_0$ for different $Pe$. The dashed line represents the critical $Pe_c$ for the shift in the trend of the dispersion coefficient with pressure load. (b) Curves of $\kappa$ with $Pe$, where $\kappa$ is the variation of dispersion coefficients.
What are the underlying mechanisms responsible for the diverse regimes of  $\kappa$ as it varies with $Pe$? Under laminar flow conditions, the physical mechanisms contributing to dispersion encompass molecular diffusion, shear dispersion, hold-up dispersion and mechanical dispersion (Koch & Brady Reference Koch and Brady1985). Molecular diffusion is the random thermal motion of solute molecules or particles. Shear dispersion, also known as boundary-layer dispersion, is caused by non-uniform velocity profiles within pores or throats. According to classical theories of dispersion (Koch & Brady Reference Koch and Brady1985; Sahimi et al. Reference Sahimi, Hughes, Scriven and Davis1986), hold-up dispersion arises from the retention effect of solute species in zero-velocity regions where species can escape only by molecular diffusion, such as the interior of permeable solid grains or dead-ends. Nevertheless, this study demonstrates that low-velocity regions in porous media flow, where flow does exist but is weak, are equally capable of producing hold-up dispersion. Mechanical dispersion is the result of repeated separation and merging of flow passages at the junctions of the pore space. At small $Pe$, the impact of convection is negligible, and the predominant mechanism is molecular diffusion. As $Pe$ increases, convection exerts an increasingly important influence on dispersion. When $Pe$ reaches a significant magnitude, the dominant mechanism switches to mechanical dispersion, while in the intermediate range of $Pe$, the aforementioned four mechanisms operate collectively.
To assess the impact of heightened compaction on dispersion mechanisms, the first task is to explore the changes in the pore structure, along with the subsequent modifications in the flow within the porous medium. As the pressure load increases from the initial pressure load  $P_0=5$ MPa to the maximum pressure load $P_{max}=70$ MPa, the pore structure of sphere packs becomes significantly tighter. As depicted in figure 3(a), the porosity $\phi$ exhibits a decline from 0.362 to 0.247, along with a decrease in permeability $K$ from 12.6 mD to 3.8 mD. The coefficient of variation of pore radii, defined as $CV_R=std(R) / \langle R \rangle$, where $std(R)$ and $\langle R \rangle$ denote the standard deviation and mean of the pore radii, respectively, exhibits an increasing trend as the pressure load increases (figure 3b). This trend signifies the intensified heterogeneity of the pore structure. The disorder of the porous media flow is characterized by the coefficient of variation of throat flow rates, defined as $CV_{q_{ij}}=std(q_{ij}) / \langle q_{ij} \rangle$, where $std(q_{ij})$ and $\langle q_{ij} \rangle$ denote the standard deviation and mean of throat flow rates, respectively. The number and volume ratio of dead-end pores always remain less than three-thousandths and one-thousandth, respectively, implying the negligible role of dead-ends. This aligns with literature (Koch & Brady Reference Koch and Brady1985), asserting the absence of zero-velocity regions within sphere packs. Despite the rarity of dead-ends within the sphere packs, a substantial presence of low-velocity zones is evident (figure 4a,c), characterized by weak flow and termed as stagnant zones. The stagnant zones are determined based on the transit times within pores and throats, the procedures of which are described in detail in the Appendix. The volume and number fractions of the stagnant zone increase significantly with pressure loads and can be as high as 0.35 (figure 4c). Previous literature has acknowledged the existence of these low-velocity regions in porous media flow, with predictions that these regions may exert an influence on dispersion (Reynolds & Harral Reference Reynolds and Harral2000). We further demonstrate that these stagnant zones resemble dead-ends in inducing a retention effect on solute species, consequently resulting in hold-up dispersion. Notably, flow does occur within the stagnant zone, albeit at a significantly lower rate compared with the average flow through the porous medium. In the intermediate $Pe$ range, advection governs tracer transport outside stagnant zones, while molecular diffusion dominates tracer transport inside stagnant zones. In this scenario, similar to zero-velocity regions (Koch & Brady Reference Koch and Brady1985), the stagnant zone induces hold-up dispersion. As $Pe$ increases, solute transport within the stagnant zone shifts towards dominance by advection, resulting in the disappearance of the hold-up effect. Hence, the stagnant zone exclusively generates hold-up dispersion within the intermediate $Pe$ range. However, it is crucial to acknowledge that stagnant zones and zero-velocity regions do exhibit distinct characteristics. Conversely, regardless of $Pe$, solute transport through zero-velocity regions remains consistently governed by molecular diffusion. Consequently, zero-velocity regions generate hold-up dispersion without an upper limit on $Pe$. For the domain size considered here, if advection weakens or disappears within the stagnant zone, dispersion transitions from Fickian to non-Fickian at large $Pe$, further emphasizing this distinction.

Figure 3. Evolution of pore structure characteristics with the normalized pressure load  $P / P_0$: (a) porosity $\phi$ and permeability $K$; (b) coefficient of variation of pore radii, $CV_R$; (c) values of $1/ (\phi F)$, where $\phi$ and $F$ represent porosity and formation factor, respectively.

Figure 4. Evolution of flow field characteristics with the normalized pressure load  $P / P_0$: (a) probability density distribution of the normalized throat flow rate $q_{ij} / \langle {q_{ij}} \rangle$; (b) coefficient of variation of throat flow rate, $CV_{q_{ij}}$; (c) volume fraction $\eta _V$ and number fraction $\eta _N$ of the low-velocity zone to the whole pore space.
In regime I, molecular diffusion emerges as the dominant mechanism governing dispersion, wherein the dispersion coefficient  $D_L^P$ relies solely on the nature of the pore structure, rendering it independent of $Pe$. The dispersion coefficient $D_L^P$ can be expressed as $D_L^P / D_m=1/ (\phi F)$, where $F$ is the formation factor and $\phi$ is the porosity. The formation factor defines the normalized electrical resistance of the pore structure, analogous to the absolute permeability of porous media. A detailed description of how PNM calculates the formation coefficient has been provided in our previous work (Liu et al. Reference Liu, Gong, Xiao and Wang2024). The magnitude of $1/ (\phi F)$ experiences a reduction with the increase of pressure load (figure 3c), which explains the negative value of $\kappa$.
In regime III, mechanical dispersion dominates, exhibiting a linear relationship between the dispersion coefficient  $D_L^P$ and the Péclet number $Pe$, denoted as $D_L^P=\alpha ^P Pe$ (Sahimi et al. Reference Sahimi, Hughes, Scriven and Davis1986; Bruderer & Bernabé Reference Bruderer and Bernabé2001; Bijeljic et al. Reference Bijeljic, Muggeridge and Blunt2004). Some studies also suggested that $D_L^P$ may exhibit a logarithmic scaling at large $Pe$, such as $D_L^P \sim Pe \log (Pe)$ (Saffman Reference Saffman1959; Koch & Brady Reference Koch and Brady1985; Puyguiraud et al. Reference Puyguiraud, Gouze and Dentz2021), a phenomenon which was not observed in this study. Here $\alpha ^P$ represents the dispersivity of the sphere pack, a quantity that depends on the nature of porous media flow. Specifically, the stronger the disorder of the flow, the larger the value of $\alpha ^P$ is. We have $\kappa =(\alpha ^{P_{max}} / \alpha ^{P_{0}})-1$, where $\alpha ^{P_{0}}$ and $\alpha ^{P_{max}}$ denote the dispersivity of the sphere pack at the initial pressure load $P_0$ and the maximum pressure load $P_{max}$, respectively. The influence of $Pe$ is cancelled out by the ratio of $D_L^{P_{max}}$ and $D_L^{P_{0}}$, implying that $\kappa$ is independent of $Pe$. Furthermore, the heterogeneity of the pore structure $CV_R$ is enhanced with increasing pressure load (figure 3b), which strengthens the disorder $CV_{q_{ij}}$ of the flow (figure 4b), consequently accentuating the strength of mechanical dispersion (Sahimi et al. Reference Sahimi, Hughes, Scriven and Davis1986; Bruderer & Bernabé Reference Bruderer and Bernabé2001). This ultimately leads to an increase in the dispersivity, i.e. $\alpha ^{P_{max}}>\alpha ^{P_{0}}$. Therefore, $\kappa$ maintains a positive plateau in this regime.
In regime II, both advection and diffusion play significant roles. This regime is characterized by the competition of multiple dispersion mechanisms, encompassing molecular diffusion, shear dispersion, hold-up dispersion, and mechanical dispersion. From the analyses on regimes I and III, it is demonstrated that molecular diffusion is weakened while mechanical dispersion is enhanced with increasing pressure load. Still, we need to figure out the impact of heightened compaction on shear dispersion and hold-up dispersion.
We examine the significance of shear dispersion through comparisons of dispersion coefficients that incorporate or exclude the effect of shear dispersion. The effect of shear dispersion is incorporated by utilizing shear dispersion coefficients in the calculation of diffusive mass transfer fluxes in the network model. These shear dispersion coefficients encapsulate the influence of parabolic velocity profiles on longitudinal mass transfer within a single pore or throat. Conversely, replacing the shear dispersion coefficient with the molecular diffusion coefficient implies disregarding the influence of parabolic velocity profiles, thereby deactivating the shear dispersion effect (Liu et al. Reference Liu, Gong, Xiao and Wang2024). This action does not alter stochastic fluctuations or the low-velocity regions within the porous media flow. Consequently, mechanical dispersion and stagnant dispersion remain unaffected. Figure 5(a) illustrates that the influence of shear dispersion on the dispersion coefficient is of minimal consequence, constituting less than 6 %. This observation aligns consistently with our earlier findings that when the pore structure is highly disordered, the contribution of shear dispersion to the overall picture will be small (Liu et al. Reference Liu, Gong, Xiao and Wang2024).

Figure 5. (a) Impact of shear dispersion on the dispersion coefficient;  $D_{L,ISD}$ and $D_{L,ESD}$ are the dispersion coefficients that incorporate and exclude the effect of shear dispersion, respectively. (b) Variation of $\kappa$ with $Pe$ when the effect hold-up dispersion is excluded by setting the volume of the low-velocity region to zero, where $\kappa$ is the variation of dispersion coefficients.
According to classical theories of dispersion (Koch & Brady Reference Koch and Brady1985; Sahimi et al. Reference Sahimi, Hughes, Scriven and Davis1986), the essence of hold-up dispersion lies in the retention effect of solutes in dead-ends and the interior of permeable grains. Negligible dead-ends exist within the sphere packs, and given the consideration of impermeable grains in this study, one might question the presence of hold-up dispersion within the sphere packs. Nevertheless, our analysis confirms the presence of hold-up dispersion. If hold-up dispersion is absent, and considering the negligible role of shear dispersion, the dispersion within regime II transitions from weakened molecular diffusion dominance to enhanced mechanical dispersion dominance with increasing  $Pe$. As the effects of molecular diffusion and mechanical dispersion on $\kappa$ are independent of $Pe, \kappa$ is expected to exhibit a smooth transition from negative to positive values with increasing $Pe$. Nevertheless, this expectation contradicts the peak observed in the $\kappa$– $Pe$ curve. This discrepancy implies the presence of an additional mechanism, in conjunction with mechanical dispersion, which is enhanced with increasing pressure load and acts only near the peak. We speculate that this additional mechanism is hold-up dispersion, generated by the large number of stagnant regions where there is flow but weak. The significant increase in both the number and volume fraction of stagnant regions with rising pressure load implies an enhancement of the hold-up dispersion they generate, aligning with the observed peak in the $\kappa$– $Pe$ curve. We eliminate the hold-up dispersion by assigning zero volumes to pores and throats within stagnant zones while keeping other parameters constant as in the base case where hold-up dispersion is incorporated. Hold-up dispersion is attributed to the hysteresis between the concentration within the stagnant zone and the neighbouring active zone. Therefore, by setting the volume of the pores and throats within stagnant zones to zero, the stagnant zone will consistently maintain the same concentration as the adjacent active zone, i.e. the hold-up effect is turned off. The exclusion of hold-up dispersion leads to the disappearance of the peak in the $\kappa$– $Pe$ curve (figure 5b), providing additional confirmation of our conjecture. To our best knowledge, this discovery is reported for the first time in this study.
To conclude, the mechanisms that essentially play roles in regime II involve molecular diffusion, hold-up dispersion and mechanical dispersion. With increasing pressure load, the weakening of molecular diffusion competes with the enhancement of hold-up dispersion and mechanical dispersion, collectively determining the dispersion coefficient in this regime. On the other hand, as  $Pe$ increases, convection exerts an increasingly important influence on dispersion, leading to an evolution of dispersion from one initially dominated by molecular diffusion to one that is jointly dominated by hold-up dispersion and mechanical dispersion. The shift in the dominance of dispersion mechanisms leads to a change in $\kappa$ from a negative to a positive value, i.e. the dependence between the dispersion coefficient and the pressure load changes from negative to positive. The value of $\kappa$ reaches its peak at approximately $Pe = 30$ and subsequently undergoes a decline. This trend is explained by the conjecture that hold-up dispersion diminishes as $Pe$ exceeds 30, leading to a shift in the increase of the dispersion coefficient from being driven by a combination of hold-up dispersion and mechanical dispersion to being driven by mechanical dispersion only.
Figure 6(a–c) shows the normalized dispersion coefficient  $D_L^P / D_L^{P_0}$ of the three groups of polydisperse sphere packs (i.e. $\sigma =0.025d_0, 0.05d_0$ and $0.1d_0$) as it varies with the pressure load across various $Pe$, which is exactly the same as in the case of monodisperse sphere packs (i.e. $\sigma =0$). Furthermore, with increasing pressure load, the evolution of statistics of the pore structure and the flow field of both monodisperse and polydisperse sphere packs are consistent. Hence, the conclusions drawn from the analysis based on monodisperse sphere packs are equally applicable to the case of polydisperse sphere packs. Moreover, it is noted that these analyses and conclusions also hold true for sphere packs with different Young's modulus (figure 6d–f), further validating the generality of this study. Due to space limitations, a detailed elaboration on the structure and flow analyses of polydisperse sphere packs is omitted here. In this study, the standard deviation $\sigma$ of the sphere diameter is limited to a maximum of $0.1d_0$ due to the constraints of computational cost associated with DEM. We believe that the conclusions of this study are equally applicable to sphere packs with a broader grain size distribution.

Figure 6. The normalized dispersion coefficient  $D_L^P / D_L^{P_0}$ of polydisperse sphere packs as it varies with the normalized pressure load $P / P_0$ for different $Pe$. The Young's modulus $E$ of the spheres in (a–c) is 2.5 GPa, while $E$ in (d–f) is 0.5 GPa, 5.0 GPa, 10 GPa, respectively. The initial pressure load $P_0$ in (a–c) is 5 MPa, while $P_0$ in (d–f) is 1 MPa, 10 MPa, 20 MPa, respectively. Insets illustrate the probability density distribution of sphere diameter $d$ of the corresponding sphere packs, where the horizontal axis represents the normalized diameter $d / d_0$, while the vertical axis represents the probability density. The standard deviations $\sigma$ of the sphere diameters are as follows: (a) $\sigma =0.025d_0$, (b) $\sigma =0.05d_0$, (c) $\sigma =0.1d_0$, (d) $\sigma =0.1d_0$, (e) $\sigma =0.1d_0$, (f) $\sigma =0.1d_0$.
4. Conclusions
We study the impact of compaction on longitudinal dispersion coefficient of porous materials through a DEM-PNM numerical framework. We reveal the non-monotonic effect of compaction on dispersion coefficient, which is distinguished by the presence of three distinct regimes in the variation of dispersion coefficients ( $\kappa$) across various $Pe$. The analysis of the statistics of the pore structure and the flow field elucidates the origin of the phenomenon: compaction exerts disparate impacts on the mechanisms of dispersion. Specifically, the porous medium tightens with increasing pressure load, reducing the effect of molecular diffusion that primarily governs at small $Pe$. On the other hand, the elevated pressure load enhances the heterogeneity of the pore structure, leading to enhanced disorder and an elevated proportion of stagnant regions within the porous media flow. These enhancements further strengthen mechanical dispersion and hold-up dispersion, respectively, both acting at larger $Pe$. It is essential to emphasize that hold-up dispersion arises from stagnant regions characterized by weak flow, which differ fundamentally from zero-velocity regions (dead-ends or the interior of permeable grains) as described in classical theories of dispersion (Koch & Brady Reference Koch and Brady1985; Sahimi et al. Reference Sahimi, Hughes, Scriven and Davis1986). The competition between the weakening of molecular diffusion and the enhancement of hold-up dispersion and mechanical dispersion, together with the shift in the dominance of dispersion mechanisms across various $Pe$, results in the multiple regimes in the $\kappa$– $Pe$ curve. Our study sheds light on the guidance for structural design and modulation of the dispersion coefficient of packed porous materials.
Funding
This work is financially supported by the NSF grant of China (nos 12272207, U1837602) and the National Key Research and Development Program of China (no. 2019YFA0708704).
Declaration of interests
The authors report no conflict of interest.
Author contributions
M.W. conceived and promoted this work. Y.L. performed the simulations and analysis. Y.L. wrote the paper and M.W. revised the text. W.G. and H.X. performed the simulations and revised the text.
Appendix
Identification of stagnant zones involves the following steps: first, transit times  $V / q$ through network elements (pores and throats) are sorted in descending order, with $V$ and $q$ denoting the volume and flow rate of network elements, respectively. The sorted network elements are labelled from $1$ to $N_0$ according to their sorting index, where $N_0$ denotes the total number of network elements. Following this, network elements are removed from the network, giving priority to those with smaller labels. The number of network elements removed is quantified by the removal ratio $N/N_0$, indicating the removal of all network elements with labels less than $N$. Subsequently, the permeability $K$ of the pore network for the removal ratio $N/N_0$ is determined, showing a decrease with $N/N_0$. Next, the derivative $\delta (K/K_0) / \delta (N/N_0)$ of the normalized permeability $K/K_0$ to the removal ratio $N/N_0$ is calculated, where $K_0$ denotes the permeability of the original network. The removal ratio corresponding to when $\delta (K/K_0) / \delta (N/N_0) = -1$ is denoted as $N_c/N_0$. The stagnant zone consists of the sorted network elements with labels $N < N_c$. We emphasize that the exclusion of hold-up dispersion is achieved by assigning zero volumes to the stagnant zones, rather than by removing stagnant zones from the network.


