


Introduction
The western honey bee (Apis mellifera) is a key pollinator of many agricultural crops and wild plants (Hung et al., Reference Hung, Kingston, Albrecht, Holway and Kohn2018). The ongoing trend of honey bee decline throughout the world has brought the attention to the great loss of ecological services provided by this species, its health status, and numerous threats it faces (Paudel et al., Reference Paudel, Mackereth, Hanley and Qin2015; Boncristiani et al., Reference Boncristiani, Ellis, Bustamante, Graham, Jack, Kimmel, Mortensen and Schmehl2020). Bees are associated with a diverse community of microbes (viruses, bacteria, fungi, and protists), commonly known as the microbiome. As a superorganism, the honey bee has complex interactions with its own microorganisms, the microbial communities of food stores, hive surfaces, and surrounding environments; therefore, four major groups of bee-associated microbiomes have been distinguished (Smutin et al., Reference Smutin, Lebedev, Selitskiy, Panyushev and Adonin2022). These include gut and body surface microbiota, microbiota of the in-hive environment (honeycombs, brood combs, propolis, royal jelly, etc.), and microbiota of the surrounding environment. Recent advances in DNA technologies and biomolecular analyses enabled new insights into the understanding of microbiota composition, dynamics, and impact on host biology and health. Except for a few bacterial pathogens that are widespread in apiaries and causing high mortality (Forsgren, Reference Forsgren2010; Genersch, Reference Genersch2010), the functional role of most members of bee-associated microbiota on host and colony health is not completely understood (Engel et al., Reference Engel, Kwong, McFrederick, Anderson, Barribeau, Chandler, Cornman, Dainat, de Miranda, Doublet, Emery, Evans, Farinelli, Flenniken, Granberg, Grasis, Gauthier, Hayer, Koch, Kocher, Martinson, Moran, Munoz-Torres, Newton, Paxton, Powell, Sadd, Schmid-Hempel, Schmid-Hempel, Song, Schwarz, vanEngelsdorp and Dainat2016; Khan et al., Reference Khan, Al-Ghamdi, Ghramh, Ansari, Ali, Alamri, Al-Kahtani, Adgaba, Qasim and Hafeez2020). The gut microbiome is the most extensively studied part of the bee-associated microbiota (Romero et al., Reference Romero, Nastasa, Chapman, Kwong and Foster2019) used as a model for gut microbiota research (Zheng et al., Reference Zheng, Steele, Leonard, Motta and Moran2018). It is relatively simple and specialized, consisting of 8–10 recurring phylotypes or species clusters called Alpha-1 (Bartonella apis), Alpha-2.1 (unclassified species of Acetobacteriaceae family), Alpha-2.2 (Saccharibacter floricola), Beta (Snodgrassella alvi), Bifido (Bifidobacterium asteroides), Gamma-1 (Gilliamella apicola), Gamma-2 (Frischella perrara), Firm-4 (Lactobacillus mellis and L. mellifer), Firm-5 (other Lactobacillus spp. including (Apilactobacillus) kunkeei) (Sabree et al., Reference Sabree, Hansen and Moran2012; Kwong and Moran, Reference Kwong and Moran2016). Despite the conserved bacterial phylotype composition, it was found that each honey bee harbors a distinct community at the functional level (Ellegaard and Engel, Reference Ellegaard and Engel2019).
It is well known that S. alvi, G. apicola, two species of Lactobacillus (L. apis and L. helsingborgensis), and Bifidobacterium spp. are ubiquitous and can be found in every adult honey bee worker worldwide, often considered as part of the core gut microbiome composition (Erban et al., Reference Erban, Ledvinka, Kamler, Hortova, Nesvorna, Tyl, Titera, Markovic and Hubert2017; Nowak et al., Reference Nowak, Szczuka, Górczyńska, Motyl and Kręgiel2021). Other microbial species, e.g., B. apis, Apibacter adventoris, F. perrara, and species of the family Acetobacteraceae, have been sometimes found in the gut of many workers, but exceptions exist (Jones et al., Reference Jones, Fruciano, Hildebrand, Al Toufalilia, Balfour, Bork, Engel, Ratnieks and Hughes2018; Raymann and Moran, Reference Raymann and Moran2018). The gut bacteria showed specific spatial distribution related to different sections of the honey bee digestive system (Martinson et al., Reference Martinson, Moy and Moran2012; Callegari et al., Reference Callegari, Crotti, Fusi, Marasco, Gonella, De Noni, Romano, Borin, Tsiamis, Cherif, Alma and Daffonchio2021). Snodgrassella alvi and G. apicola dominate in the ileum region of the hindgut, F. perrara occupy the pylorus near the beginning of the ileum, while the Lactobacillus strains and Bifidobacterium spp. are most abundant in the rectum region of the hindgut (Raymann and Moran, Reference Raymann and Moran2018).
The functional role of the gut microbiome was mainly related to host nutrition and metabolism, regulation of the immune system, and pathogen resistance (Emery et al., Reference Emery, Schmidt and Engel2017; Kwong et al., Reference Kwong, Mancenido and Moran2017; Bonilla-Rosso and Engel, Reference Bonilla-Rosso and Engel2018; Daisley et al., Reference Daisley, Chmiel, Pitek, Thompson and Reid2020; Castelli et al., Reference Castelli, Balbuena, Branchiccela, Zunino, Liberti, Engel and Antúnez2021), and alterations in gut microbiota (such as dysbiosis) may affect host metabolic homeostasis and immunity (Yuan et al., Reference Yuan, Pan, Jin, Ni, Fu and Jin2019; Zhu et al., Reference Zhu, Qi, Xue, Niu and Wu2020). Multiple factors, such as bee age, caste and social activity, presence of pathogens and parasites, exposure to agrochemicals and anthropogenic toxins, the microbiota of in-hive environment and stored food, as well as the landscape heterogeneity and related local environmental conditions (including vegetation diversity, land-use type, season), are known to affect honey bee gut microbiome composition and dynamics (Anderson et al., Reference Anderson, Sheehan, Mott, Maes, Snyder, Schwan, Walton, Jones and Corby-Harris2013; Graystock et al., Reference Graystock, Goulson and Hughes2015; Engel et al., Reference Engel, Kwong, McFrederick, Anderson, Barribeau, Chandler, Cornman, Dainat, de Miranda, Doublet, Emery, Evans, Farinelli, Flenniken, Granberg, Grasis, Gauthier, Hayer, Koch, Kocher, Martinson, Moran, Munoz-Torres, Newton, Paxton, Powell, Sadd, Schmid-Hempel, Schmid-Hempel, Song, Schwarz, vanEngelsdorp and Dainat2016; Kwong and Moran, Reference Kwong and Moran2016; Jones et al., Reference Jones, Fruciano, Hildebrand, Al Toufalilia, Balfour, Bork, Engel, Ratnieks and Hughes2018; Bosmans et al., Reference Bosmans, Pozo, Verreth, Crauwels, Wilberts, Sobhy, Wäckers, Jacquemyn and Lievens2018; Ribière et al., Reference Ribière, Hegarty, Stephenson, Whelan and O'Toole2019; Kešnerová et al., Reference Kešnerová, Emery, Troilo, Liberti, Erkosar and Engel2020; Muñoz-Colmenero et al., Reference Muñoz-Colmenero, Baroja-Careaga, Kovačić, Filipi, Puškadija, Kezić, Estonba, Büchler and Zarraonaindia2020). The versatility and potential utility of the western honey bee, including its associated microbiota, as biomonitors of environmental pollutants, pesticides use, presence of pathogens, climate change, and ecosystem health, has been recognized and recently reviewed (Cunningham et al., Reference Cunningham, Tran, McKee, Ortega Polo, Newman, Lansing, Griffiths, Bilodeau, Rott and Guarna2022).
Traditionally, the microorganisms associated with honey bees and their food are determined by examination, and subsequent isolation and identification, using appropriate tests and taxonomic keys (see Snowdon and Cliver, Reference Snowdon and Cliver1996; Gilliam, Reference Gilliam1997 for reviews). Very often taxonomic identification is difficult to implement in species with similar morphological features. This requires an application of high-sensitivity methods such as DNA sequencing including DNA barcoding (Porter and Hajibabaei, Reference Porter and Hajibabaei2018; Eberle et al., Reference Eberle, Ahrens, Mayer, Niehuis and Misof2020). Recently, a novel method (environmental DNA metabarcoding) comprising DNA isolation from mixed or bulk environmental samples, amplification, high-throughput sequencing (HTS), and bioinformatics was widely applied for studying and monitoring biological diversity including microbiome diversity (Deiner et al., Reference Deiner, Bik, Mächler, Seymour, Lacoursière-Roussel, Altermatt, Creer, Bista, Lodge, de Vere, Pfrender and Bernatchez2017; Piper et al., Reference Piper, Batovska, Cogan, Weiss, Cunningham, Rodoni and Blacket2019; Kennedy et al., Reference Kennedy, Prost, Overcast, Rominger, Gillespie and Krehenwinkel2020). HTS of 16S and internal transcribed spacer ribosomal RNA (rRNA) markers is now one of the most effective and extensively used approaches in microbiome studies that also provides quantitative estimates of the microbial community composition (Bukin et al., Reference Bukin, Galachyants, Morozov, Bukin, Zakharenko and Zemskaya2019).
In this study, we investigated the bacterial communities associated with honey bees from two regions in Bulgaria (mountain and lowland) by applying DNA metabarcoding approach based on 16S rRNA gene. The objectives were: (i) to detect ‘core’ bee-associated bacteria and differential taxa specific to each locality and (ii) to compare the bacterial community structure and diversity within and between localities.
Materials and methods
Sites description and sampling
Bee specimens were collected during honey production season (June 2018) from two different localities: the ‘Experimental Apiary of the Research Center of Stockbreeding and Agriculture’, located on the outskirts of Smolyan city (41°35′40″N, 24°40′39″E), the Rhodope Mountains (RM), Southern Bulgaria and from a private apiary in a lowland village near to Byala city (43°25′6″N, 25°49′14″E), Danube plain (DP) region, Northeastern Bulgaria. Both sites differed considerably by their topography and landscape characteristics, altitude, dominant land use type, and vegetation. The locality in the Rhodope Mtn is mountainous with an average altitude of about 1160 m, a very heterogeneous environment, steep slopes, more diverse landscape structures, numerous grasslands and pastures, and coniferous tree vegetation. In contrast, the landscape of the lowland locality in the Danube plain region is slightly hilly (altitude ranges 100–300 m a.s.l.), surrounded by agroecosystems with annual and perennial crops, broadleaved vegetation, small forest patches.
To identify bee-associated microbiota, 15 hives from each apiary were randomly selected. From each hive, one bee forager returning to the hive with pollen on their legs was collected with sterile tweezers from each hive near to hive entrance. Each bee specimen was placed in a sterile 50 μl falcon and immediately frozen on dry ice in the field. The samples were brought to the laboratory of the Institute of Biodiversity and Ecosystem Research and stored at −20°C before processing.
DNA extraction, PCR amplification, and sequencing
Prior to DNA extraction, the posterior body segment of bee specimens (known also as metasoma or abdomen) was cut-off with sterile scissors. For pragmatic reasons, we will use the term abdomen in this text. After that, the bees were mechanically homogenized by sterile pestle in a total of 350 μl Lyse T buffer (GeneMATRIX Tissue DNA Purification kit, Cat.no. E3550, EURx Sp. z o.o.; Gdansk, Poland) to complete the destruction of the abdomen. After removal of all tissue fragments, total DNA isolation was performed according to the manufacturer's instructions. DNA concentration and quality were measured using an Analytikjena spectrophotometer (Analytik Jena GmbH, Germany). The extracted DNA was then sent to the AIM laboratory (https://www.aimethods-lab.com/) for DNA metabarcoding using NGS (sequencing and bioinformatics processing).
From each sample, 5 μl of extracted genomic DNA was used, along with Plant MyTAQ (Bioline, Luckenwalde, Germany). The V3–V4 hypervariable regions of the bacterial 16S rRNA gene were amplified with the adapted primers 16s-barcode primers (341f – TACACGACGCTCTTCCGATCTTCATCCTACGGGNGGCWGCAG – and 785r – CAGACGTGTGCTCTTCCGATCCGCTCAGACTACHVGGGTATCTAATCC) (Morinière et al., Reference Morinière, Cancian de Araujo, Lam, Hausmann, Balke, Schmidt, Hendrich, Doczkal, Fartmann, Arvidsson and Haszprunar2016; Thijs et al., Reference Thijs, De Beeck, Beckers, Truyens, Stevens, Van Hamme, Weyens and Vangronsveld2017; Morinière et al., Reference Morinière, Balke, Doczkal, Geiger, Hardulak, Haszprunar, Hausmann, Hendrich, Regalado, Rulik, Schmidt, Wägele and Hebert2019). Amplification success and fragment length were assessed using gel electrophoresis. Amplified DNA was cleaned up and resuspended in 50 μl molecular water for each sample before proceeding. Illumina Nextera XT (Illumina Inc., San Diego, USA) indices were ligated to the samples in a second PCR reaction applying the same annealing temperature as for the first PCR reaction but with only seven cycles, and ligation success was confirmed by gel electrophoresis. DNA concentrations were measured using a Qubit fluorometer (Life Technologies, Carlsbad, USA), and samples were combined into 40 μl pools containing equimolar concentrations of 100 ng each. Pools were purified using MagSi-NGSprep Plus (Steinbrenner Laborsysteme GmbH) beads. A final elution volume of 20 μl was used. HTS was performed on an Illumina MiSeq using v3 (2 × 300 bp, 600 cycles, maximum of 25 mio paired-end reads) chemistry.
Bioinformatic processing
Paired-end merging was done using the -fastq_mergepairs utility of the USEARCH suite v11.0.667_i86linux32 (Edgar et al., Reference Edgar, Haas, Clemente, Quince and Knight2011). Adapter sequences were removed using CUTADAPT (Martin, Reference Martin2011) (default parameters). The remaining pre-processing steps, namely quality filtering, dereplication, chimera filtering, and clustering were carried out using the VSEARCH suite v2.9.1 (Rognes et al., Reference Rognes, Flouri, Nichols, Quince and Mahé2016). Sequences were trimmed to a length of 400 bp and were only included in the analyses that matched perfectly to the barcode. 16S rRNA genes were classified using the SILVA database (Quast et al., Reference Quast, Pruesse, Yilmaz, Gerken, Schweer, Yarza, Peplies and Glöckner2012) and NCBI database (O'Leary et al., Reference O'Leary, Wright, Brister, Ciufo, Haddad, McVeigh, Rajput, Robbertse, Smith-White, Ako-Adjei, Astashyn, Badretdin, Bao, Blinkova, Brover, Chetvernin, Choi, Cox, Ermolaeva, Farrell, Goldfarb, Gupta, Haft, Hatcher, Hlavina, Joardar, Kodali, Li, Maglott, Masterson, McGarvey, Murphy, O'Neill, Pujar, Rangwala, Rausch, Riddick, Schoch, Shkeda, Storz, Sun, Thibaud-Nissen, Tolstoy, Tully, Vatsan, Wallin, Webb, Wu, Landrum, Kimchi, Tatusova, DiCuccio, Kitts, Murphy and Pruitt2016) both with a minimum similarity threshold of 97%. The resulting file could then be used to map the reads to the operational taxonomic units (OTUs) to create the OTU table. To reduce likely false positives, a cleaning step was employed which excluded read counts in the OTU table that constituted less than 0.01% of the total number of reads in the sample. OTUs were blasted against a custom database downloaded from GENBANK using Geneious (v.10.2.5 – Biomatters, Auckland – New Zealand), and following methods described in Morinière et al. (Reference Morinière, Cancian de Araujo, Lam, Hausmann, Balke, Schmidt, Hendrich, Doczkal, Fartmann, Arvidsson and Haszprunar2016). OTUs were additionally removed from the results based on negative control samples, i.e., if the combined number of reads in the negative controls constituted more than 20% of the total number of reads in the OTU. OTUs were also annotated with the taxonomic information from NCBI (downloaded from https://ftp.ncbi.nlm.nih.gov/pub/taxonomy/), followed by a creation of a taxonomic consensus between BOLD, NCBI, and RDP.
A total of 1,667,218 raw reads of the V3–V4 region of the bacterial 16S rRNA were obtained and assembled in 833,609 clean sequences with an average sequence length of 411 bp, and with a maximum of one expected error. These sequences were obtained from the 20 assayed samples (13 from the Rhodope Mountains and 7 from the Danube plain). Before chimera detection, 419 bacterial OTUs were identified at the 97% sequence similarity cut-off. After chimera filtering and removing data with low-quality scores for three bee specimens from Danube plain locality and OTUs identified as organelle DNA (chloroplast and mitochondria), 66 OTUs and 17 samples remained for further analyses (Supplementary table S1).
Data analyses
The microbiome data analyses were performed using the web-based platform MicrobiomeAnalyst (Dhariwal et al., Reference Dhariwal, Chong, Habib, King, Agellon and Xia2017; Chong et al., Reference Chong, Liu, Zhou and Xia2020) based on the OTUs abundance table for 17 samples containing raw counts of 66 OTUs. Taxonomy data in text table format and the metadata file were uploaded and further analyzed in the Marker-gene Data Profiling (MDP) module. Taxa having less than a 10% prevalence with a read number ≤2 were filtered out. The 39 most frequent and abundant OTUs were further involved in the analyses after data filtering. The OTU abundances were rarefied to the minimum library size (Supplementary fig. S1a) (Kandlikar et al., Reference Kandlikar, Gold, Cowen, Meyer, Freise, Kraft, Moberg-Parker, Sprague, Kushner and Curd2018) and normalized. Rarefaction curves per each sample are presented (Supplementary fig. S1b). Core bacterial taxa were distinguished and visualized by setting up a 20% prevalence value and 0.01 for the relative abundance (RA) value. Three alpha-diversity measures (Shannon diversity, Simpson diversity, and Chao1 indices) were calculated at OTUs and generic levels and visualized (McMurdie and Holmes, Reference McMurdie and Holmes2013). Chao1 index estimates taxa richness by accounting for taxa (e.g., OTUs, species, or genera) that are undetected because of low abundance. Shannon and Simpson's indices are based on taxa richness and their abundances (or evenness). Pairwise comparisons and the significant differences between both groups were calculated using the non-parametric Mann–Whitney U test (P ≤ 0.05). To observe the average dissimilarity in the composition of microbial communities in both regions of the country, beta diversity was estimated based on Bray–Curtis similarity distances and visualized with non-metric multidimensional scaling (NMDS) ordination (McMurdie and Holmes, Reference McMurdie and Holmes2013). The statistical significance of the clustering pattern in ordination plots was evaluated using the permutational multivariate analysis of variance (PERMANOVA). Differences in taxonomic classification between both geographical regions were illustrated using heat tree analysis (Foster et al., Reference Foster, Sharpton and Grünwald2017). It leverages the hierarchical structure of taxonomic classifications to quantitatively (using the median abundance) and statistically (using the non-parametric Wilcoxon rank-sum test, P < 0.05) depict taxonomic differences between microbial communities (view mode: comparison) or abundance profiles (view mode: abundance). Linear discriminant analysis of effect size (LEfSe) was applied to identify bacterial taxa specific to each locality using a significance level of P < 0.05 (Segata et al., Reference Segata, Izard, Waldron, Gevers, Miropolsky, Garrett and Huttenhower2011).
Results
Bacterial community structure, composition, and variability
The taxonomic assignment of the 39 most common and abundant OTUs revealed five phyla, six classes, 12 orders, 15 families, and 22 genera (fig. 1, Supplementary fig. S2). Among bacterial phyla, Proteobacteria, Firmicutes, and Actinobacteria dominated the bee-associated communities at both locations (99–100%, fig. 1a). Proteobacteria prevailed significantly in all bee specimens from the lowland locality (DP, 68–87%) and in five bee specimens from the Rhodope Mtn (RM, 52–79%), followed by Firmicutes (RM: 17–63%, DP: 10–27%) and Actinobacteria (0.4–14%). OTUs assigned to Bacteroidetes and Tenericutes were present in a very low RA (0.3–0.9%) and occurrence in both localities. A clear variability within and between localities was also observed in the RAs for bacterial families (Supplementary fig. S2a) and genera (fig. 1b). In the bee specimens from the Rhodope Mtn, on average 43% of reads belonged to the family Lactobacillaceae (mainly Lactobacillus, 43%); Orbaceae make up 14% of Bacteria (Gilliamella, 12% and Frischella, 2%), followed by 10% RA of Rhizobiaceae (Bartonella), 9% – Enterobacteriaceae (mainly Morganella, 8%), 8% – Neisseriaceae (Snodgrassella), and about 7% of Bifidobacteriaceae (Bifidobacterium) and Acetobacteraceae (Commensalibacter). Other families, such as Leuconostocaceae (Fructobacillus), Pseudomonadaceae (Pseudomonas), Spiroplasmataceae (Spiroplasma), and Sphingomonadaceae (Sphingomonas), were found in less than 1% of the total OTU abundance (Supplementary fig. S2a).

Figure 1. Bar charts illustrating the distribution and relative abundances of bacterial phyla (a) and genera (b). Data are represented for each honey bee specimen and locality. RM, Rhodope Mountains; DP, Danube plain.
In bee specimens from the Danube plain locality, on average 30% of OTUs belonged to the family Rhizobiaceae (Bartonella), 21% – Lactobacillaceae (mainly Lactobacillus – 20%), 18% – Enterobacteriaceae (Morganella – 10%, Klebsiella – 6%, Serratia – 1%), 14% – Pseudomonadaceae (Pseudomonas spp.), and 7% to Orbaceae (Gilliamella – 6% and Frischella – 1%). The average RA of bacteria belonging to families Neisseriaceae (Snodgrassella), Bifidobacteriaceae (Bifidobacterium), and Acetobacteraceae (Commensalibacter, Bombella) was lower than 3% (2–4%). Bacteria from five families (Carnobacteriaceae, Flavobacteriaceae, Oxalobacteraceae, Sphingobacteriaceae, and Sphingomonadaceae) were found in low frequency and RAs (>0.3%) (Supplementary fig. S2a). Heatmaps visualizing bacterial taxa composition and their RAs at various taxonomical levels (species, genera, families, and orders) for each locality and individual bee specimens are presented in the Supplementary fig. S3a–d.
Bacterial diversity, core, and differential taxa
The total number of OTUs found in all bees from both localities was 66 (Supplementary table 1) with one-third of them (or 27 OTUs) revealed in a very low number of reads (≤10 per bee specimen) mainly from the Danube plain locality. Lactobacillus and Gilliamella showed the highest OTU richness. Because of the limited number of successfully sequenced specimens from this locality, we could not be sure if these are indeed rare bacterial phylotypes. Despite this bias in bee specimens' quantity, the OTU richness of microbial communities in bees from the Danube plain was higher as compared to those from the Rhodope Mtn (29 vs. 35, in total) and per bee specimen (fig. 2). Twenty-five OTUs and 15 genera were common for microbial communities of both localities, of them ten OTUs and five genera were unique for the Danube plain area (Supplementary fig. S4).

Figure 2. Alpha diversity measure showing the observed variation of OTU numbers (richness) in the bacterial communities. Data are represented as a box plot. RM, Rhodope Mountains; DP, Danube plain; Mann–Whitney U test statistic: 0.05, P value: 0.004.
Alpha diversity assessed by Shannon, Simpson, and Chao1 indices revealed different trends when calculated at OTUs and genus levels (Supplementary fig. S5a–f). The bacterial communities of bees from the Danube plain were significantly more diverse than those of the Rhodope Mtn when genus data were compared (Mann–Whitney U test, Shannon (P = 0.04), Simpson (P = 0.059), and Chao1 (P = 0.01); Supplementary fig. S5d–f). Except for Chao1's diversity index (P = 0.004; Supplementary fig. S5c), no significant differences in OTU diversity between both localities were revealed (P > 0.05; Supplementary fig. S5a, b). Beta diversity analyses clearly distinguished the bacterial communities from both localities (P = 0.002) (NMDS; fig. 3). The microbial communities of bee specimens from the Rhodope Mtn were more similar to each other than those of the Danube plain region.
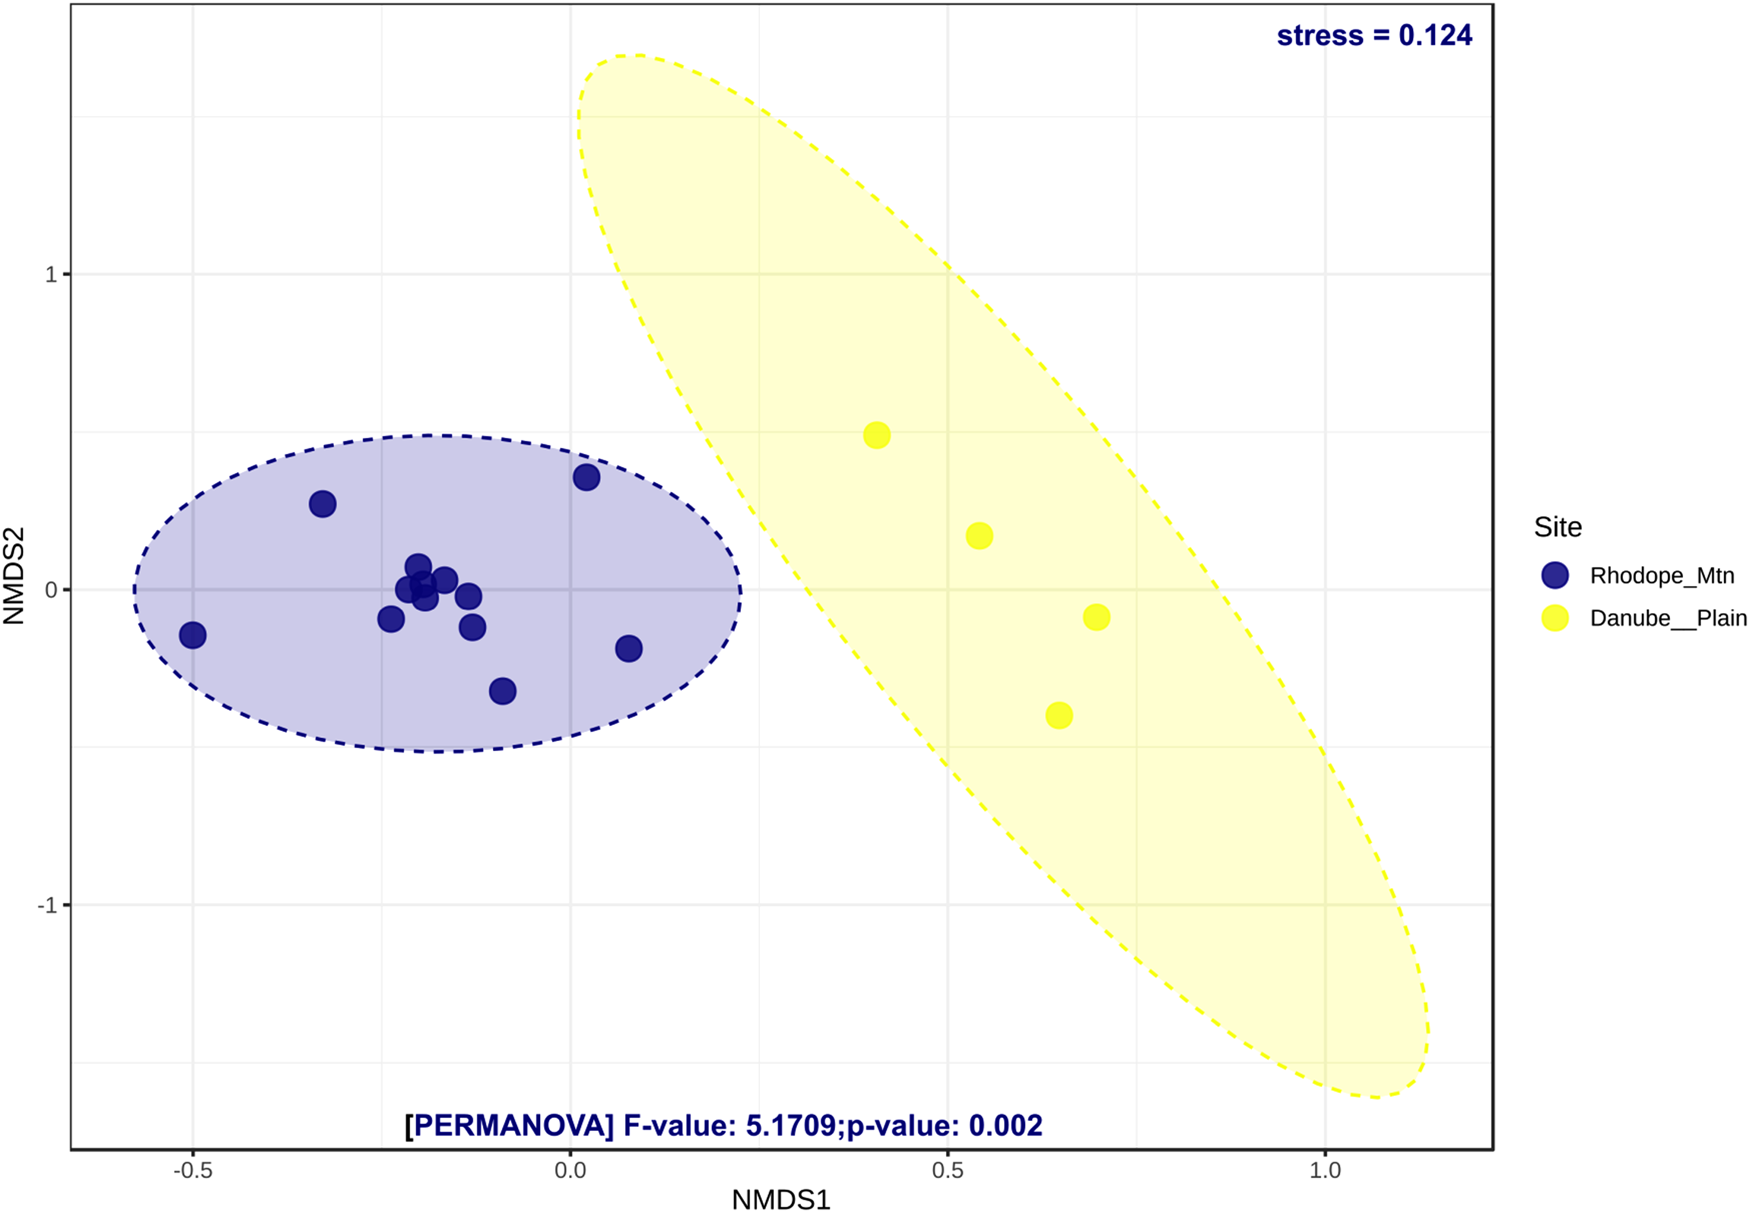
Figure 3. Non-metric multidimensional scaling (NMDS) ordination of honey bee communities at OTU level using Bray–Curtis as a dissimilarity measure. Results from the PERMANOVA test (F, stress, and P values) are represented for each taxonomic level. Individuals from the same colony and explained variances are represented by the same colors.
Several core bacterial taxa occurring with high frequency and abundance specific to each locality were revealed (fig. 4). Bartonella (B. apis), Bifidobacterium sp., Snodgrassella (S. alvi), Frischella (F. perrara), and phylotypes of Gilliamella, Lactobacillus, and Commensalibacter, known as honey bee gut-associated bacteria, dominated in almost all bee individuals (92–100%). However, the percentage of these specific core gut bacterial genera was less abundant (32–73%) in a few bee specimens. OTUs assigned to other four genera (Pseudomonas, Serratia, Morganella, and Klebsiella) were present with higher RA in bee specimens from the Danube plain and occasionally – in bees from the Rhodope Mtn (Supplementary fig. S3a, b).
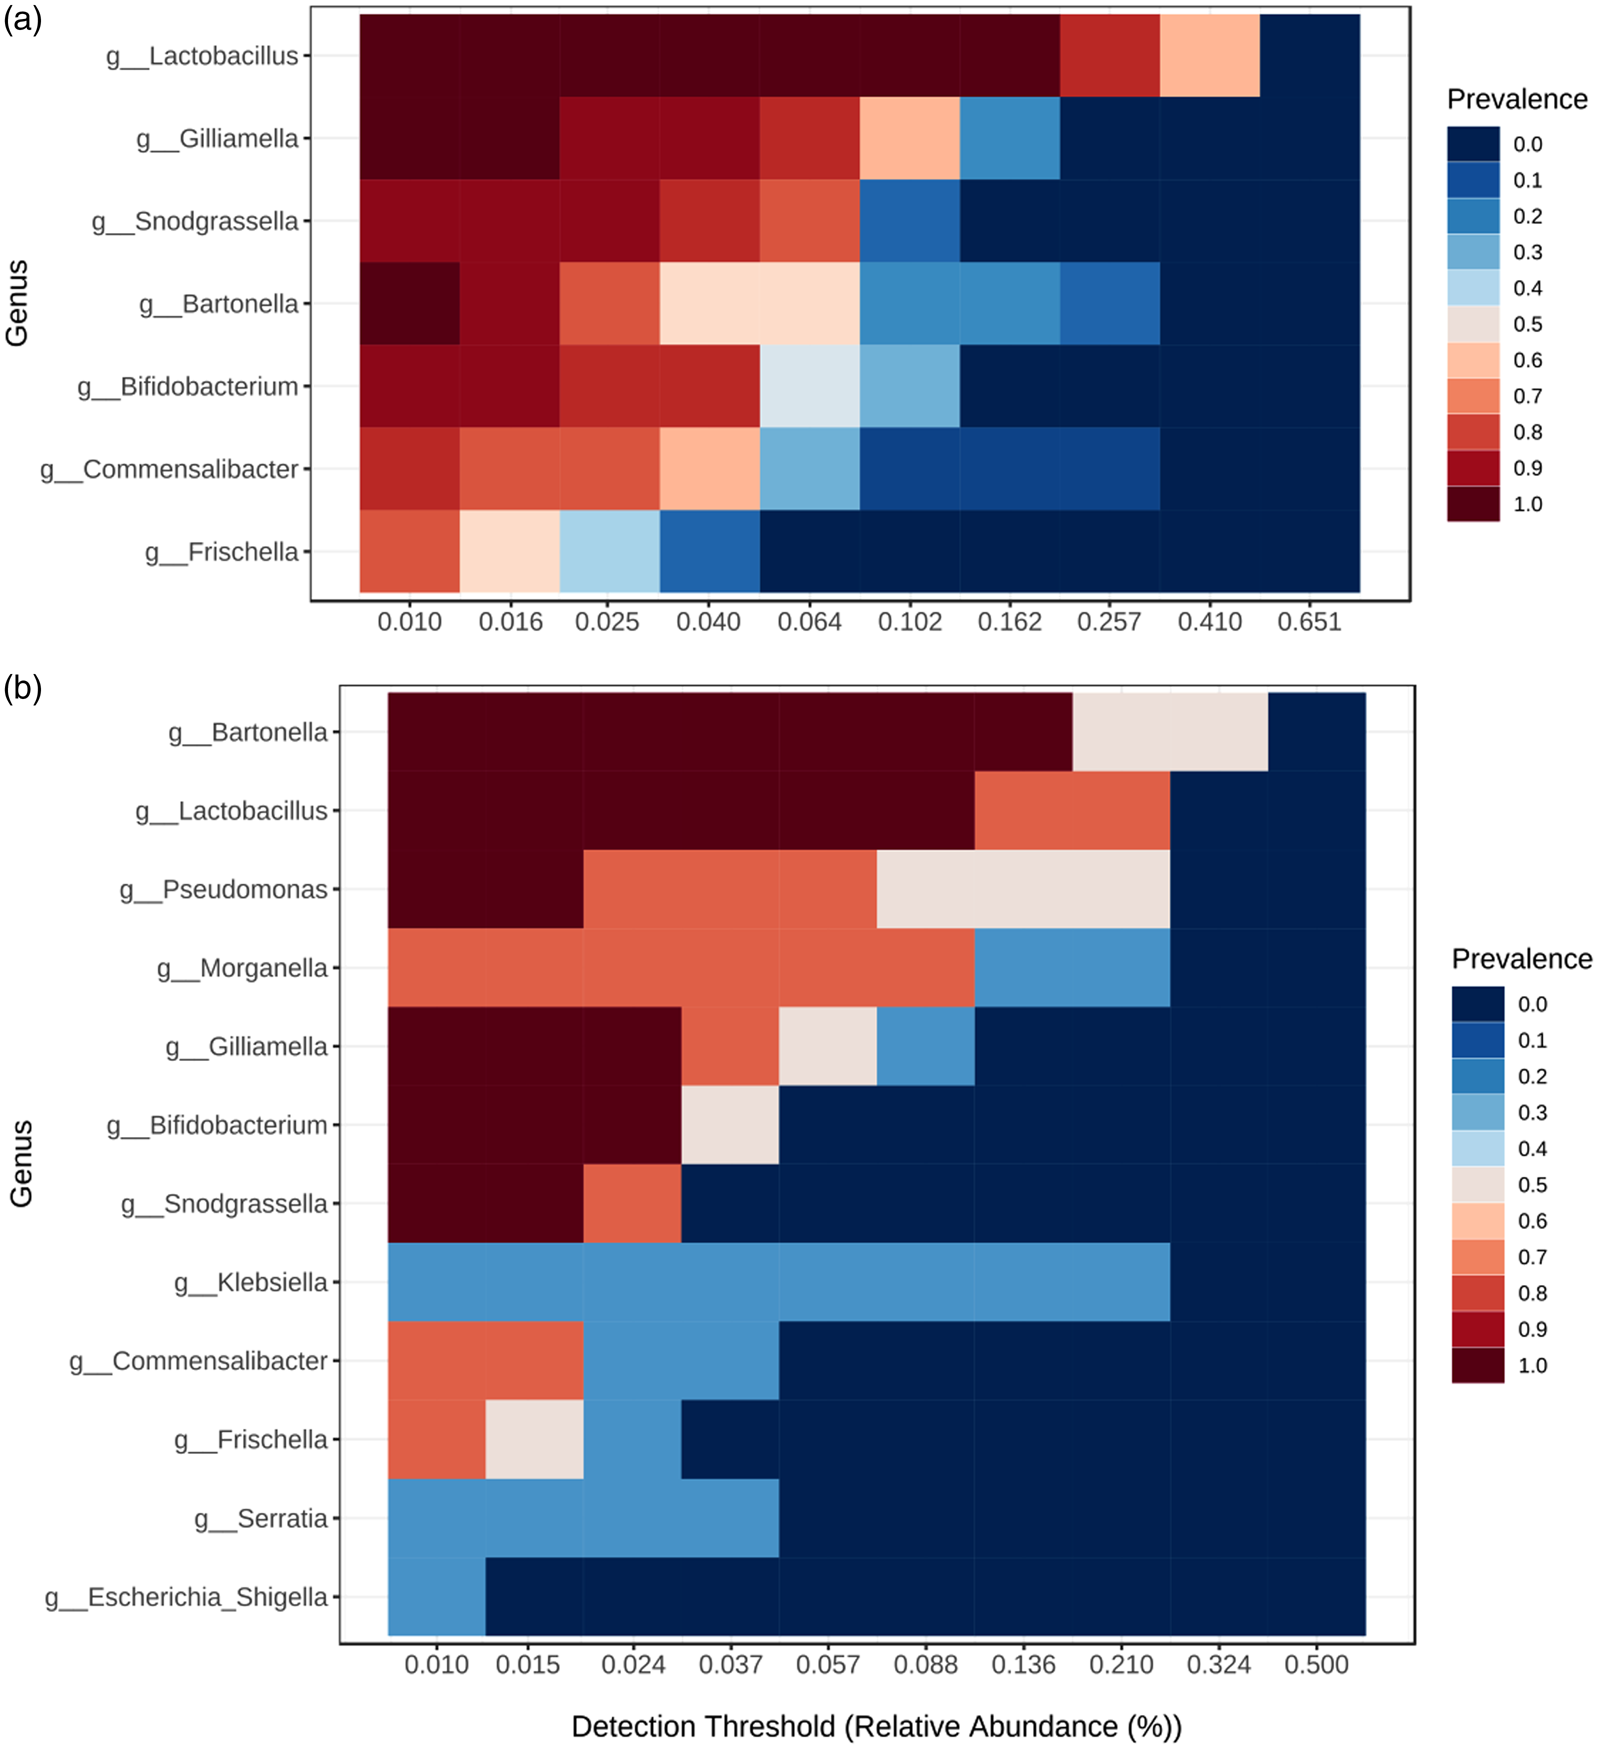
Figure 4. Heatmap representing the core bacterial genera dominating the honey bee communities from the Rhodope Mountains (a) and Danube plain (b). The y-axis represents the prevalence of core genera across the detection threshold range (relative abundance) on the x-axis. The prevalence of each core species is indicated by a color gradient from dark blue (low) to dark red (high).
The geographical differences in the bacterial microbiome composition and structure were also supported by the results of two additional analyses – the heat tree analysis (fig. 5) and the LEfSe (Supplementary fig. S6, table S3). Both analyses showed differences in the distribution of seven bacterial genera, i.e., Lactobacillus (LEfSe, P = 0.02), Gilliamella (LEfSe, P = 0.03), Snodgrassella (LEfSe, P = 0.03), Bartonella (LEfSe, P = 0.02), Pseudomonas (LEfSe, P < 0.00), Serratia (LEfSe, P < 0.00), and Apibacter (LEfSe, P = 0.01) with the first three genera being significantly more abundant in the Rhodope Mtn (Supplementary fig. S7). Bacteroidetes was found in honey bees from the Danube plain only (Wilcoxon's P = 0.001) with Apibacter sp. occurring in three out of four specimens (LEfSe, P = 0.01, Supplementary table S3). The order Pseudomonadales, composed of four Pseudomonas spp., prevailed significantly in bee specimens of the Danube plain region (Wilcoxon's P = 0.001) (fig. S6). Other differential taxa distinguishing bee-associated bacterial communities of both localities are presented in the Supplementary materials (fig. S6 and table S3).
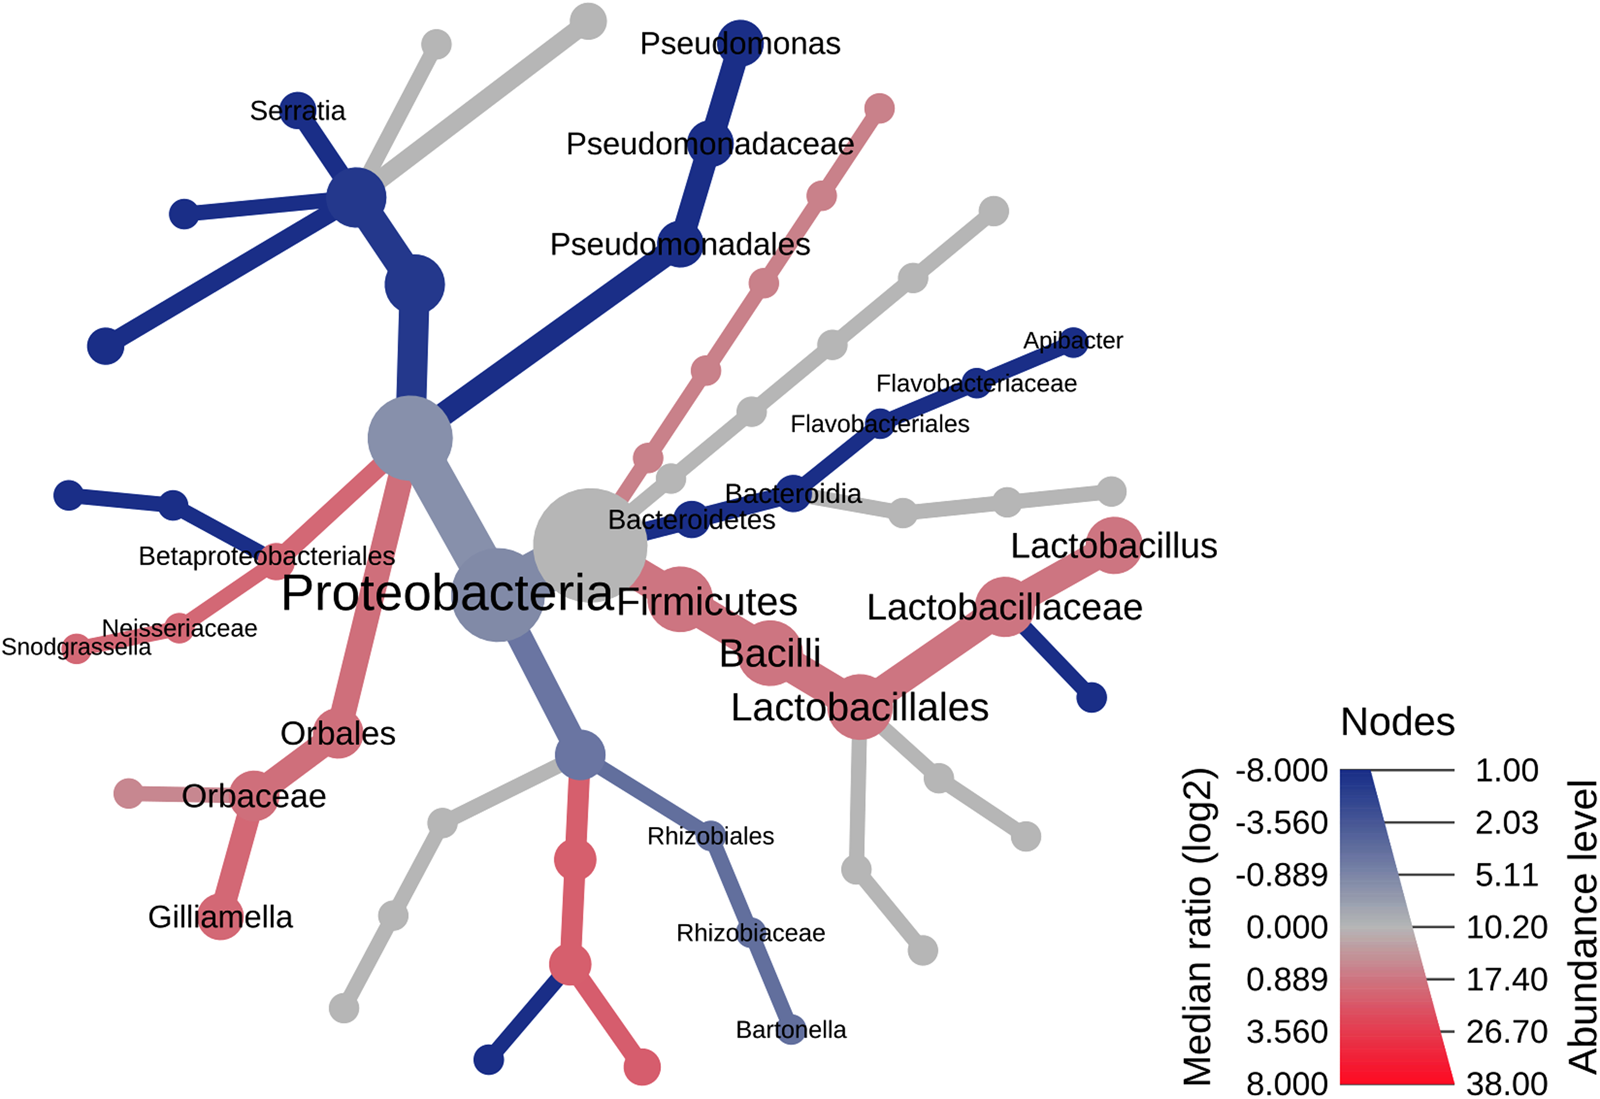
Figure 5. Heat tree graph representing the geographical differences in the bacterial communities associated with honey bees. Significantly different taxonomic ranks are shown on the tree as a light red and dark blue nuance for communities of the Rhodope Mountains and the Danube plain, respectively. Node diameter is proportional to the number of OTUs classified as that taxon.
Discussion
In our study, we focused on the composition and diversity of bacterial communities associated with honey bees from two apiaries located in the Rhodope Mtn and Danube plain regions having different landscape topography – mountain and lowland, respectively. We characterized the bee-associated bacteria at different hierarchical levels (OTUs to phylum) by applying various community-based analyses such as composition and dominance structure, and their variability within and between localities, α and β diversity, analyses for revealing core and differential taxa.
Bacterial OTUs assigned to seven genera (Bartonella (B. apis), Bifidobacterium sp., Snodgrassella (S. alvi), Frischella (F. perrara), and Gilliamella, Lactobacillus, and Commensalibacter), known as specific gut-associated bacteria of A. mellifera, dominated (92–100%) the bee-associated assemblages in most specimens. Phylotypes or species clusters from these seven genera are known as specific gut microbiota that is well-adapted to honey bees worldwide, mainly transmitted through social interactions between individuals (Kwong and Moran, Reference Kwong and Moran2016). They occupy different sections of the bee digestive system and have evolved specific host–microbe interactions and functions (Martinson et al., Reference Martinson, Moy and Moran2012). Two ubiquitous Gram-negative genera Snodgrassella (S. alvi) and Gilliamella (members of the Proteobacteria phylum) and several Gram-positive Lactobacillus bacteria (Firmicutes phylum) prevailed significantly in the Rhodope Mtn locality. One Proteobacteria species (B. apis), usually found with lower abundance and frequency, dominated the bacterial communities of bees from the Danube plain locality. These primary bacterial genera are part of the core gut microbiota of honey bees (Kwong and Moran, Reference Kwong and Moran2016). The F. perrara usually localized in a restricted niche of the bee gut (Kwong and Moran, Reference Kwong and Moran2016), and one unidentified Bifidobacterium species were present in all specimens from both localities with low and relatively high RA, respectively. Except for F. perrara (Engel et al., Reference Engel, Bartlett and Moran2015a, Reference Engel, Vizcaino and Crawford2015b; Maes et al., Reference Maes, Rodrigues, Oliver, Mott and Anderson2016), these bee-specific bacterial taxa are considered beneficial gut symbionts of social bees that have protective and nutritional functions (Kwong and Moran, Reference Kwong and Moran2016). For example, Lactobacillus spp. has essential roles in carbohydrate metabolism and in protecting hosts by producing antimicrobial metabolites (such as organic acids, diacetyl, benzoate, and bacteriocins) and sugars (Zhang et al., Reference Zhang, Mu, Cao, Shi, Hu and Zheng2022). Bifidobacterium spp. are involved in the biosynthesis and assimilation of trehalose that is used for energy storage in insects and its presence and abundance are considered bacterial indicators for assessing the age of bee workers (Dong et al., Reference Dong, Li, Chen, Wang, Deng, Lin, Zhang, Li and Guo2020).
The honey bee biology and colony behavior, as well as the microbiome composition of the in-hive environment, strongly affect the routes of acquisition and the initial composition of bacteria associated with worker bees (Powell et al., Reference Powell, Martinson, Urban-Mead and Moran2014; Smutin et al., Reference Smutin, Lebedev, Selitskiy, Panyushev and Adonin2022). Subsequently, the microbiomes of various in-hive structures (surfaces), stored foods (e.g., honeycombs, bee wax, propolis, pollen, royal jelly, honey, etc.), and out-hive environments (floral nectar and pollen) can contribute to the acquisition of non-core bee-associated microbiota (Snowdon and Cliver, Reference Snowdon and Cliver1996; Kačániová et al., Reference Kacániová, Pavlicová, Hascík, Kociubinski, Kńazovická, Sudzina, Sudzinová and Fikselová2009; Anderson et al., Reference Anderson, Sheehan, Eckholm, Mott and DeGrandi-Hoffmanet2011; Rering et al., Reference Rering, Beck, Hall, McCartney and Vannette2018; Cullen et al., Reference Cullen, Fetters and Ashman2021). Species of the genus Lactobacillus, the most recognized and diverse honey bee symbionts, were commonly found in the in-hive environment including bee bread, royal jelly, bee pollen, and nectar (Anderson et al., Reference Anderson, Sheehan, Mott, Maes, Snyder, Schwan, Walton, Jones and Corby-Harris2013, Reference Anderson, Carroll, Sheehan, Mott, Maes and Corby-Harris2014). For example, the fructophilic lactic acid bacteria L. (Apilactobacillus) kunkeei isolated from all beehive substrates and crop sections of the bee alimentary tract (Corby-Harris et al., Reference Corby-Harris, Maes and Anderson2014) have been found worldwide on different plants, especially associated with floral nectar and pollen (McFrederick et al., Reference McFrederick, Wcislo, Taylor, Ishak, Dowd and Mueller2012; Neveling et al., Reference Neveling, Endo and Dicks2012; Anderson et al., Reference Anderson, Sheehan, Mott, Maes, Snyder, Schwan, Walton, Jones and Corby-Harris2013; Rering et al., Reference Rering, Beck, Hall, McCartney and Vannette2018; Casalone et al., Reference Casalone, Cavalieri, Daly, Vitali and Perito2020; de Oliveira Scoaris et al., Reference de Oliveira Scoaris, Hughes, Silveira, Evans, Pettis, Bastos and Rosa2021; Rering et al., Reference Rering, Rudolph, Li, Munoz, Read and Hunterunpublished).
In some specimens, a substantial deviation from the core gut-associated taxa was revealed. Several genera (Pseudomonas, Morganella, Klebsiella, Serratia, and Providencia), belonging to families Pseudomonadaceae and Enterobacteriaceae, were present with high RAs mainly in bees from the Danube plain area and occasionally in a few individuals from the Rhodope Mtn. We relate the presence of these bacteria to body surface-associated microbiota. These genera have widespread distribution, found in various environments (water, soil, plants, insects, and other animals including humans). However, some species are also known as potential and opportunistic bee pathogens that can disrupt gut microbiota and increase host susceptibility to infection and reduced lifespan (Kwong and Moran, Reference Kwong and Moran2016; Raymann et al., Reference Raymann, Shaffer and Moran2017; Lakhman et al., Reference Lakhman, Galatiuk, Romanishina, Behas and Zastulka2021; Al Naggar et al., Reference Al Naggar, Singavarapu, Paxton and Wubet2022). When foraging on flowers, honey bees can transfer numerous pollen-associated bacteria that differ significantly in plant species and pollination type (Manirajan et al., Reference Manirajan, Maisinger, Ratering, Rusch, Schwiertz, Cardinale and Schnell2018), including some plant pathogenic species (e.g., Pseudomonas), thereby facilitating species-specific crop diseases (McArt et al., Reference McArt, Koch, Irwin and Adler2014; Pattemore et al., Reference Pattemore, Goodwin, McBrydie, Hoyte and Vanneste2014).
Alpha diversity indices and beta diversity analyses confirmed the observed differences in honey bee-associated microbiota from both localities. One of the possible explanations for the observed community shifts in bacterial composition and higher diversity in bees from the Danube plain locality might be related to the higher infectious rate with Nosema microsporidian parasites found in the same apiary (Radoslavov et al., Reference Radoslavov, Hristov, Shumkova, Mitkov, Sirakova and Bouga2017). Alterations in the community composition and diversity of bee gut microbiome were found to be positively correlated with the presence of eukaryotic parasites and pathogens (Cariveau et al., Reference Cariveau, Elijah Powell, Koch, Winfree and Moran2014; Hubert et al., Reference Hubert, Bicianova, Ledvinka, Kamler, Lester, Nesvorna, Kopecky and Erban2017; Felden et al., Reference Felden, Baty and Lester2021). Moreover, a higher microbial diversity was associated with a lower bumblebee resistance against infection by an intestinal parasite (Näpflin and Schmid-Hempel, Reference Näpflin and Schmid-Hempel2018).
The presence and higher diversity of non-specific gut bacteria in bees from the lowland area may have been related to the landscape features of the location and the level of anthropogenic impact. This is a rural area with higher land use intensity. Increased exposure to agricultural chemicals due to the prevalence of agroecosystems may have had long-term consequences on bee health and its microbiome structure and function. As a main pollinator of various crops, often located in areas with high land use intensity, A. mellifera has diverse interactions with the local environment that can significantly affect bee health and colony performance. In general, each location is a complex of interacting local, global, and regional environmental factors, some of which acting as bee stressors. Land use intensity, agrochemicals, and nutrition quality have been found to contribute to alterations in the honey bee-associated microbiome (Kakumanu et al., Reference Kakumanu, Reeves, Anderson, Rodrigues and Williams2016; Jones et al., Reference Jones, Fruciano, Hildebrand, Al Toufalilia, Balfour, Bork, Engel, Ratnieks and Hughes2018; Motta et al., Reference Motta, Raymann and Moran2018; Muñoz Colmenero et al., Reference Muñoz-Colmenero, Baroja-Careaga, Kovačić, Filipi, Puškadija, Kezić, Estonba, Büchler and Zarraonaindia2020; Cullen et al., Reference Cullen, Bliss, Stanley and Carolan2023). In contrast to the lowland area, the topography of the Rhodope Mtn creates a heterogeneous environment with more diverse landscape structures and ecosystems owing to the variations in temperature, vegetation, lack of homogeneous monocultures, and lower pollution levels. This leads to a larger diversity of non-managed habitats, such as natural grasslands, low-intensity pastures, forests, patches of shrubs, and single trees that provide higher plant diversity and nutritional resources for honey bees. Both sites differed in many aspects, including elevation, landscape heterogeneity, land use type and vegetation, access to floral resources, application of agrochemicals that may affect alone or in combination. However, the lower number of sampling locations, smaller sampling sizes, and the combined effect of multiple abiotic and biotic factors hinder the clear interpretation of our findings. Therefore, further studies with higher sampling rate, involving pathogen and fungal community analyses, would be required to disentangle the influence of local and regional factors.
Supplementary material
The supplementary material for this article can be found at https://doi.org/10.1017/S0007485323000378.
Acknowledgements
We thank Dr Ivelina Urban (Consultant at Urban Quality Consulting) for her helpful comments, and manuscript editing and proofreading.
Financial support
This research was funded by the Bulgarian National Science Fund of the Ministry of Education and Science, grant number KП-06-H56/11 17.11.2021.
Competing interest
None.


