


1. Introduction
The fluid flow between two independently rotating co-axial cylinders (Couette Reference Couette1888; Taylor Reference Taylor1923), known as the Taylor–Couette flow (TCF), has served as a canonical set-up to study instabilities and pattern transitions, leading to chaos and turbulence, over the past century (Rayleigh Reference Rayleigh1917; Synge Reference Synge1938; Coles Reference Coles1965; Gollub & Swinney Reference Gollub and Swinney1975; Mullin & Benjamin Reference Mullin and Benjamin1980; Andereck, Liu & Swinney Reference Andereck, Liu and Swinney1986; Dutcher & Muller Reference Dutcher and Muller2009; Grossmann, Lohse & Sun Reference Grossmann, Lohse and Sun2016; Lueptow, Hollerbach & Serre Reference Lueptow, Hollerbach and Serre2023). Adding neutrally buoyant, non-colloidal rigid particles to Newtonian fluids can significantly alter the flow transitions in the TCF as revealed in recent experiments (Majji, Banerjee & Morris Reference Majji, Banerjee and Morris2018; Ramesh, Bharadwaj & Alam Reference Ramesh, Bharadwaj and Alam2019; Baroudi, Majji & Morris Reference Baroudi, Majji and Morris2020; Dash, Anantharaman & Poelma Reference Dash, Anantharaman and Poelma2020; Ramesh & Alam Reference Ramesh and Alam2020; Moazzen et al. Reference Moazzen, Lacassagne, Thomy and Bahrani2022). The first comprehensive experimental investigation of suspension TCF was conducted by Majji et al. (Reference Majji, Banerjee and Morris2018) for the case of pure inner cylinder rotation ( $\varOmega =\omega _0/\omega _i= 0$), which showed that the critical Reynolds number for the primary bifurcation
  $ Re^{c1}(\phi,\varOmega =0)$ decreases with increasing particle volume fraction
  $\phi$, implying the destabilizing role of particles. They discovered ‘particle-induced’ non-axisymmetric patterns, namely, the spiral vortex flow (SVF) and/or ribbon (RIB), that appear as the primary bifurcating state when the particle loading exceeds a critical value
  $\phi ^{cr} \sim 0.05$. Ramesh et al. (Reference Ramesh, Bharadwaj and Alam2019) conducted flow visualization and particle image velocimetry measurements, and identified two co-existing/mixed states: (i) Taylor vortex flow (TVF)
 $+$wavy Taylor vortex (WTV) and (ii) TVF
 $+$SVF, during the up-sweep run for
  $\phi \geq 0.05$; however, a transition sequence of CCF
  $\leftarrow$ SVF
  $\leftarrow$ TVF
  $\leftarrow$ WTV was found during the down-sweep run. The later work of Ramesh & Alam (Reference Ramesh and Alam2020) uncovered another state of interpenetrating spiral vortices (ISVs), i.e. the coexistence of up- and down-propagating spiral vortices, which appears as a secondary bifurcation from the mixed ‘TVF
 $+$SVF’ state for
  $\phi \geq 0.1$. Baroudi et al. (Reference Baroudi, Majji and Morris2020) explored the effect of inertial migration (due to finite values of the particle Reynolds number) on observed patterns in TCF. Dash et al. (Reference Dash, Anantharaman and Poelma2020) carried out experiments over a large range of Reynolds number (
 $ Re \sim O(10^3)$) and explored higher order transitions for
  $\phi \leq 0.4$; they identified a power-law scaling for the normalized torque that holds beyond the secondary bifurcation. Moazzen et al. (Reference Moazzen, Lacassagne, Thomy and Bahrani2022) carried out torque measurement and flow visualization in an identical experimental set-up as used by Ramesh et al. (Reference Ramesh, Bharadwaj and Alam2019) and determined the scaling exponents of the normalized torque in terms of Taylor number in the TVF and WTV regimes. The earliest theoretical work on suspension TCF is due to Ali et al. (Reference Ali, Mitra, Schwille and Lueptow2002), who analysed the linear stability problem for a ‘dilute’ suspension (
 $\phi <0.05$) based on a two-fluid model, and predicted the destabilizing role of particles at the onset of primary instability. Most recently, Kang & Mirbod (Kang & Mirbod Reference Kang and Mirbod2021; Kang, Schatz & Mirbod Reference Kang, Schatz and Mirbod2024) performed numerical simulations to study pattern transitions in suspension TCF using the suspension balance model and found a qualitative agreement (Baroudi et al. Reference Baroudi, Majji, Peluso and Morris2023) with recent experimental findings.
Considering two independently rotating cylinders ( $\omega _i,\omega _o\neq 0$), Singh, Ghosh & Alam (Reference Singh, Ghosh and Alam2022) explored the pattern transition scenario in the counter-rotation regime (
 $\varOmega <0$) of suspension TCF. They found that while the overall transition sequence remains the same for
  $\varOmega \geq -0.25$ as in the case of the purely inner cylinder rotation (
 $\varOmega =0$), a novel transition occurs at
  $\varOmega = -0.5$ in which the stationary TVF bifurcates directly into a quasi-periodic state (characterized by two incommensurate frequencies), called the modulated wavy vortex (MWV), even for a pure fluid (
 $\phi = 0$). They also carried out a detailed analysis of the transition scenario for the exact counter-rotation case (
 $\varOmega = -1$) where the CCF bifurcates into a non-axisymmetric state (SVF) that further transitions to a quasi-periodic state (nonlinear ISV), followed by a chaotic state, called the non-propagating interpenetrating spirals (NISs). The follow-up article of Alam & Ghosh (Reference Alam and Ghosh2023) came out with a master scaling relation for the dimensionless torque that holds over large ranges of the Taylor number and the counter-rotation ratio, encompassing primary, secondary and tertiary states. An overview of all works on suspension TCF can be found in the review article of Baroudi et al. (Reference Baroudi, Majji, Peluso and Morris2023). The present experiments aim to uncover the pattern transition route in the ‘co-rotation’ regime (
 $\varOmega >0$) of suspension TCF, with the goal to understand the effects of particle loading and co-rotation on the emerging pattern dynamics.
2. Experimental details
All experiments are carried out in a Taylor–Couette (TC) cell mounted on a Twin-Drive MCR-702 rheometer (Anton Paar GmbH, Austria) that has been used in our previous studies (Singh et al. Reference Singh, Ghosh and Alam2022; Alam & Ghosh Reference Alam and Ghosh2023). Two independently rotating motors are used to drive the inner and outer cylinders by specifying the rotation ratio  ${\varOmega = \omega _o/\omega _i = f_o/f_i}$ in the ‘co-rotation’ regime (
 $\varOmega > 0$). Thanks to the beta-version of the ‘RheoCompass’ software (2022, private communication with Anton-Paar R&D team, Graz, Austria), we could explore the co-rotation regime of the TCF, while the original software was written for
  $\varOmega < 0$; this also allowed us to sweep up to a maximum frequency of 50 Hz, increasing the range of Reynolds numbers by a factor of
  $2.5$ in comparison to our recent work in the counter-rotation regime (Singh et al. Reference Singh, Ghosh and Alam2022; Alam & Ghosh Reference Alam and Ghosh2023). The aspect ratio of the TC cell is
  $\varGamma = h/\delta =h/(r_o-r_i)\approx 8.46$ and the radius ratio is
  $\eta = r_i/r_o\approx 0.891$, with
  $(h, r_i, r_o)=(16.5, 16.0, 17.95)$ mm. The suspension is made of rigid PMMA microspheres of mean diameter
  $d\approx 50\,\mathrm {\mu }$m and material density of
  $\rho \approx 1190$ kg m
 $^{-3}$ and a density-matched solvent which is a ternary mixture of water, glycerine and ammonium thiocyanate, and we refer readers to the above two papers for other details on experiments.
For given ( $\varOmega$,
  $\phi$), the experiments are started from
  $f = f_{min} \sim 0$ and stopped at
  $f = f_{max} = \max \{{\kern1pt}f_i, f_o\} = 50$ Hz by increasing the rotation frequency at a slow ramping rate – such ramp-up protocols are referred to as ‘up-sweep’ runs. However, for experiments which consist of both up- and down-sweep runs, after completing the up-sweep run, the rotation frequency remains constant at
  $f=f_{max}$ for a sufficiently long time (600 s) beyond which a ramp-down protocol is followed by decreasing the rotation frequency from
  ${f = f_{max}}$ to
  $f_{min}$. We set the dimensionless ramping rate to
  $|d Re(\phi )/d\tau | = 0.05/\mu _r(\phi )$, where
  $ Re(\phi ) = \max \{ Re_i(\phi ), Re_o(\phi )\}$ with
  $ Re_i(\phi )=\rho \omega _ir_i\delta /\mu (\phi )$ and
  $ Re_o(\phi )=\rho \omega _o r_o\delta /\mu (\phi )$ being the inner and outer Reynolds numbers, respectively, and
  $\tau =t/\tau _{vis}$, with
  $\tau _{vis}=\rho \delta ^2/\mu (\phi )$ being the viscous diffusion time;
  $\mu (\phi )=\mu (0)(1-\phi /\phi _m)^{-2}$ is the suspension viscosity,
  $\mu (0) \approx 7.90$ mPa s is the shear viscosity of the solvent, both measured at
  $\mathrm {T} = 22\,^{\circ }$C,
  $\phi _m=0.585$ is the maximum packing fraction (at random loose packing), and
  $\mu _r(\phi ) = \mu (\phi )/\mu (0) \geq 1$ is the relative viscosity of suspension (Guazzelli & Pouliquen Reference Guazzelli and Pouliquen2018). During up-sweep and down-sweep runs, the rotation frequency is increased and decreased in steps by staying for 10 s (
 ${\sim }70\tau _{vis}$ at
  $\phi =0.3$) at each step. Note that the maximum particle Reynolds number is estimated as
  $ Re_p(\varOmega )=\rho \dot {\gamma }_{app} d_p^2/\mu (0)= Re_i^{\max }|1-\varOmega /\eta |(d/\delta )^2= (0.90, 0.26)$ at
  $\varOmega =(0.05,0.65)$, with
  $\dot \gamma _{app}=|\omega _i r_i - \omega _o r_o|/\delta$ being the apparent shear rate across the annular gap (Alam & Ghosh Reference Alam and Ghosh2023). The corresponding particle Stokes number and Péclet number are estimated as
  $St_p=m_p \dot {\gamma }_{app}/3 {\rm \pi}\mu (0) d_p=(0.05,0.014)$ and
  $Pe=3 {\rm \pi}\mu (0) d_p^3 \dot {\gamma }_{app}/4 k_B T=O(10^9, 10^8)$, respectively, at
  $\varOmega =(0.05,0.65)$. Therefore, the particles can be treated as non-Brownian particles for which the inertial effects,
  $ Re_p=O(1)$, are non-negligible. All experiments are performed in an air-conditioned room at
  $\mathrm {T} = 22 \pm 0.5\,^{\circ }$C.
For flow visualizations, a small amount ( ${<}0.1\,\%$, Ramesh et al. Reference Ramesh, Bharadwaj and Alam2019; Singh et al. Reference Singh, Ghosh and Alam2022) of anisotropic mica flakes is added to the suspension, and three 41 W LED panels are used to illuminate the TC cell. The video images of surface flow patterns are continuously captured using a Nikon (D750 DSLR) camera at a frame rate of 60 s
 $^{-1}$. In addition, a high-speed camera, Phantom v9 (DANTEC DYNAMICS), is used to capture images at regular intervals at a frame rate of 200 s
 $^{-1}$ so as to capture high-frequency modes. The captured images are then analysed to extract information on the flow states by constructing space–time diagrams and frequency maps.
3. Results and discussion
Experiments have been conducted by choosing a value of  $\varOmega = (0.05, 0.1, 0.2, 0.3, 0.5, 0.65)$ in the co-rotation regime for different particle volume fractions
  $\phi = (0, 0.05, 0.1, 0.15, 0.2, 0.3)$; the case of pure inner cylinder rotation is approximated by conducting experiments at
  $\varOmega =-10^{-3}\approx 0$ (Singh et al. Reference Singh, Ghosh and Alam2022). The maximum explored value of
  $\varOmega =0.65$ is close to the Rayleigh stability line (Rayleigh Reference Rayleigh1917) of
  $\varOmega =\eta ^2\approx 0.794$ beyond which the TCF is known to be stable. We have carried out a set of experiments at a rotation ratio of
  $\varOmega =\omega _o/\omega _i=0.82>\eta ^2$ for
  $\phi =(0,0.15)$ and found that the flow remains stable over a range of shear Reynolds number
  $ Re_s\leq Re_s^{\max }(\phi )$, see (3.1). Note that the present value of
  $ Re_s^{\max }(\phi )$ for a specified
  $\phi$ is set by the maximum frequency
  $f_{max}=50$ Hz of the two motors, and
  $ Re_s^{\max }(\phi )$ decreases with increasing
  $\varOmega$ and approaches zero in the limit of the solid-body rotation (
 $\varOmega \to 1$, i.e.
  $\omega _i =\omega _o$), see the lower boundary of the hatched region in figure 1. We first discuss how the co-rotation ratio (
 $\varOmega >0$) affects the transition scenario at fixed values of
  $\phi$ in § 3.1, followed by results in § 3.2 for the effect of particle loading on patterns at fixed
  $\varOmega$ and discussions and theoretical perspectives in § 3.3.

Figure 1. Phase diagrams of patterns in the ( $\varOmega$,
  $ Re_s(\phi,\varOmega )$)-plane at (a)
  $\phi = 0$, (b)
  $\phi = 0.15$ and (c)
  $\phi = 0.3$. The empty and filled symbols (with and without lines), respectively, represent the onset values of
  $ Re_s(\phi )$ at bifurcations during up- and down-sweep runs; the grey patches in each panel denote the hysteresis regions. The zoomed view of the selected region in each figure is shown in the corresponding inset. The dashed line in panel (a) represents the marginal stability curve (3.2) of Esser & Grossmann (Reference Esser and Grossmann1996). The yellow hatched regions in panel (c) mark the parameter space where the SVF is observed during up-sweep (vertical lines) and down-sweep (horizontal lines) runs.
3.1. Effect of co-rotation on pattern transitions
Figure 1(a–c) displays the phase diagrams of patterns in the  $(\varOmega, Re_s(\phi ))$-plane for
  $\phi = 0$,
  $0.15$ and
  $0.3$, respectively, where
 \begin{equation} Re_s(\varOmega,\phi) = \frac{2}{1+\eta}|\eta Re_o(\phi) - Re_i(\phi)| = \frac{2Re_i(\phi)}{1+\eta}|1-\varOmega| \end{equation}
is the shear Reynolds number (Dubrulle et al. Reference Dubrulle, Dauchot, Daviaud, Longaretti, Richard and Zahn2005; Eckhardt, Grossmann & Lohse Reference Eckhardt, Grossmann and Lohse2007; Singh et al. Reference Singh, Ghosh and Alam2022). In each panel, the empty and filled symbols mark the critical values of  $Re_s(\varOmega,\phi )$ during up- and down-sweep runs, respectively, at which the bifurcations/transitions between two states occur. The lower boundary of the black hatched region in each panel denotes the maximum range of
  $Re_s(\phi )$ explored (with
  $f_{max} = 50$ Hz) at given (
 $\varOmega$,
  $\phi$), while the grey patches (such as in the inset of figure 1b) represent the hysteresis regions.
3.1.1. TCF of particle-free ( $\phi =0$) Newtonian fluid under co-rotation

For the particle-free Newtonian fluid ( $\phi = 0$), it is seen from figure 1(a) that the primary bifurcating state from the laminar circular Couette flow (CCF) is a stationary axisymmetric state, called the TVF, for all
  $\varOmega$. The image analyses helped to correctly identify the critical shear Reynolds number
  $Re_s^{c1}(\phi )$ at the CCF
  $\leftrightarrow$ TVF transition. Figure 1(a) reveals that
  $Re_s^{c1}(\phi )$ gradually decreases with increasing
  $\varOmega$, implying the destabilization role of co-rotation at the onset of the primary instability (Taylor Reference Taylor1923; Coles Reference Coles1965; Andereck et al. Reference Andereck, Liu and Swinney1986). For a quantitative comparison, the present experimental data on
  $Re_s^{c1}(\varOmega,\phi =0)$ are compared with the marginal stability curve of Esser & Grossmann (Reference Esser and Grossmann1996),
 \begin{equation} \frac{r_n^2 - r_p^2}{r_p^2}\left(\frac{r_i \alpha \sqrt{Re_s}}{r_n \sqrt{\eta}}\right)^4 = \varPsi \left(a\frac{\delta_n}{\delta}\right)^{{-}4}, \end{equation}
where  $\delta =r_o-r_i$ is the gap width,
  $r_n = r_i\sqrt {(\varOmega -1)/(\varOmega - \eta ^2)}$ is the neutral radius,
  $\delta _n = r_n - r_i$,
  $r_p = r_i + ({\delta }/{2})\varPsi (a{\delta _n}/{\delta })$,
  $a = (1-\eta )[\sqrt {{(1+\eta )^3}/{2(1+3\eta )}} - \eta ]^{-1}$,
  $\alpha = 0.1566$, and
  $\varPsi (x)=x$ and
  $1$, respectively, for
  $x<1$ and
  $x\geq 1$. Equation (3.2) is denoted by the black dashed curve in figure 1(a) which agrees well with our up-sweep data (open triangles) on
  $Re_s^{c1}(\varOmega )$. From a comparison between the up- and down-sweep data at
  $\varOmega = 0.5$ and
  $0.65$ in the inset of figure 1(a), we find that the primary bifurcation is hysteretic at large enough
  $\varOmega$ and the degree of hysteresis (i.e. the height of the grey patches in the inset,
  $\Delta Re_s$) is larger at
  $\varOmega = 0.65$ compared with at
  $\varOmega = 0.5$. Although the CCF
  $\leftrightarrow$ TVF transition is known to be non-hysteretic at
  $\varOmega \geq 0$ in the case of large-
 $\varGamma$ TC cells (Taylor Reference Taylor1923; Coles Reference Coles1965; Hegseth, Baxter & Andereck Reference Hegseth, Baxter and Andereck1996), the presence of axial constraints in a small-
 $\varGamma$ cell can make the primary transition hysteretic as reported by Heise et al. (Reference Heise, Hoffmann, Will, Altmeyer, Abshagen and Pfister2013) and confirmed in the present study (
 $\varGamma \approx 8.46$).
Beyond the primary bifurcation at  $ Re_s> Re_s^{c1}$, the TVF undergoes a secondary bifurcation at
  $ Re_s= Re_s^{c2}$ that gives birth to an oscillatory state, called the WTV, marked by empty blue circles in figure 1(a). It is evident from figure 1(a) that
  $ Re_s^{c2}(\varOmega )$ increases rapidly with increasing co-rotation, and the stabilizing role of the co-rotation at the secondary onset agrees qualitatively with previous experiments (Coles Reference Coles1965; Andereck et al. Reference Andereck, Liu and Swinney1986). Note in figure 1(a) that the WTV state disappears for
  $\varOmega \geq 0.2$ over the range of
  $ Re_s$ explored in the present study. Referring to the case where only the inner cylinder is rotating (
 $\varOmega = -10^{-3}\approx 0$), we find that with further increase in
  $ Re_s> Re_s^{c2}$, the WTV undergoes a tertiary bifurcation, leading to the modulated wavy vortex (MWV; the cyan region near the left top corner in figure 1a) at
  $ Re_s(\varOmega,\phi =0) \geq Re_s^{c3}$; the latter is a quasi-periodic state, characterized by two incommensurate frequencies in the power spectrum of the scattered light intensity (Andereck et al. Reference Andereck, Liu and Swinney1986; Singh et al. Reference Singh, Ghosh and Alam2022). Note that the MWV is found over a small range of
  $ Re_s(\phi )$ at
  $\varOmega = -10^{-3}$ and ceases to exist at
  $\varOmega \geq 0.05$ over the maximum range of
  $ Re_s(\varOmega,\phi )$ explored.
One notable difference of the present results with Andereck et al. (Reference Andereck, Liu and Swinney1986) is that the secondary and tertiary transitions to WTV and MWV occur at higher values of  $ Re_s^{c2}$ and
  $ Re_s^{c3}$, respectively. This may be attributed to the smaller aspect ratio of our TC cell for which the Ekman vortices are likely to be stronger, thus delaying the onset of oscillatory motion (Cole Reference Cole1976; Mullin & Benjamin Reference Mullin and Benjamin1980).
3.1.2. Suspension TCF under co-rotation
Moving on to suspensions, figure 1(b) displays the phase diagram of patterns at  $\phi = 0.15$. The inset of figure 1(b) confirms (as by Majji et al.'s (Reference Majji, Banerjee and Morris2018) original work for the case of
  $\varOmega =0$) that the RIB, a ‘non-axisymmetric’ state, is the primary bifurcating state over
  $\varOmega \in (0,0.65)$ during the up-sweep run (marked by the green up-triangles), while during the down-sweep run, the TVF (marked by the filled red down-triangles) and the spiral vortex flow (SVF, marked by filled cyan down-triangles) are found as the primary bifurcating states over
  $\varOmega =(0,0.3)$ and
  $\varOmega >0.3$, respectively. Note that RIB exists over a small range of
  $ Re_s(\phi )$ during the up-sweep run; it transitions to TVF with increasing
  $ Re_s$ at
  $\varOmega \leq 0.3$, and to SVF at
  $\varOmega \geq 0.5$, with the latter finally transitioning to TVF with further increase in
  $ Re_s$. Looking at the hysteretic/bistable (i.e. the coexistence of TVF and RIB/SVF) region, marked by the grey patch in the inset of figure 1(b), we find that the degree of hysteresis
  $\Delta Re_s^{c1}(\phi ) = | Re_s^{c1}(\phi )_{\uparrow } - Re_s^{c1}(\phi )_{\downarrow }|$ decreases with increasing co-rotation.
The characteristic features of the RIB and SVF states can be ascertained from figures 2(a,c) and 2(b,d), respectively. While the SVF represents a helical wave that propagates along both axial and azimuthal directions, the RIB is a superposition of left- and right-handed spirals (Chossat & Iooss Reference Chossat and Iooss1994), resulting in an axially standing wave that rotates along the azimuthal direction (Majji et al. Reference Majji, Banerjee and Morris2018; Singh et al. Reference Singh, Ghosh and Alam2022); the latter may also be called the rotating standing wave, RSW $\leftrightarrow$RIB. The space–time diagram of the RIB state in figure 2(a) resembles a checkerboard-like pattern, with a dominant frequency of
  $\omega _{RIB}/\omega _i\approx 0.1$, as marked by the green circle in figure 2(c). However, the dominant frequency of the SVF mode in figure 2(d) is located at
  $\omega _{SVF}/\omega _i\approx 0.72$, which is much larger than that of the RIB mode. This order-of-magnitude difference between the dominant frequencies at the onset of the SVF and RIB modes persists at all
  $\varOmega$, see figure 3(a). The latter figure also confirms a key difference between SVF and RIB: the frequency (normalized by the effective rotation rate
  $\omega _{sh}=\omega _i|1-\varOmega /\eta |$) of RIB is small and increases weakly with increasing co-rotation
  $\varOmega$ (see the inset of figure 3a); however, the normalized frequency of the spiral vortices (at the onset) increases sharply with increasing
  $\varOmega$ (marked by the diamond symbols in figure 3a).

Figure 2. (a,b) Space–time diagrams over 8 s of the (a) ribbon (RIB) and (b) spiral vortex flow (SVF) states, and (c,d) the power spectra of the scattered light intensity as computed from images captured at a frame rate of  $60$ s
 $^{-1}$. While the green circle in panel (c) refers to the frequency of RIB (
 ${\kern1.4pt}f_{RIB}$), the magenta circle and crosses in panel (d) represent frequency of the SVF mode (
 ${\kern1.4pt}f_{SVF}$) and its harmonics. The red down- and up-triangles mark the frequencies of the inner (
 ${\kern1.4pt}f_{\nabla }$) and outer (
 ${\kern1.4pt}f_{\varDelta }$) cylinders, respectively, and their harmonics. Parameter values are (a,c) RIB at
  $( Re_s, \varOmega, \phi ) = (113.70,0.05,0.15)$ and (b,d) SVF at
  $( Re_s,\varOmega,\phi ) = (78.53,0.5,0.15)$ during up-sweep runs.

Figure 3. Dominant frequencies at the onset of RIB (circles) and SVF (diamonds), normalized by the effective rotation rate  $\omega _{sh}=|\omega _i-\omega _o/\eta |=\omega _i|1-\varOmega /\eta |$, at (a)
  $\phi = 0.15$ and (b)
  $\phi = 0.3$. The empty and filled markers, respectively, denote the SVF data (i.e. the FFT analyses of the images from the high-speed camera at
  $200$ fps) for up- and down-sweep runs.
With increasing  $ Re_s(\phi )$ in figure 1(b), the TVF bifurcates into WTV (marked by the blue circles) which is a tertiary state during the up-sweep run at
  $\varOmega \leq 0.05$, with an overall bifurcation sequence of CCF
 $\to$RIB
 $\to$TVF
 $\to$WTV. However, the WTV is found to be the secondary state due to the non-existence of RIB, i.e. WTV
 $\to$TVF
 $\to$CCF, during the down-sweep run, with the TVF
 $\leftrightarrow$WTV transition being hysteretic as marked by the vertical grey patch at
  $\varOmega =0.05$ in figure 1(b). Comparing figure 1(b) with its particle-free counterpart in figure 1(a), we find that the region of WTV in the (
 $ Re_s, \varOmega )$-plane shrinks with increasing
  $\phi$, indicating the stabilizing role of particles on the onset of oscillatory wavy vortices at
  $\varOmega \geq 0$.
The pattern transitions differ significantly at higher particle loadings, see figure 1(c) which depicts the phase diagram of patterns in the ( $\varOmega, Re_s$)-plane at
  $\phi = 0.3$, with a major finding that the SVF is the primary bifurcating state at all
  $\varOmega \in (0,0.65)$ during both up- and down-sweep runs; the corresponding variation of the dominant frequency of the SVF mode at its onset with
  $\varOmega$ can be ascertained from figure 3(b). It is seen in figure 1(c) that the effect of co-rotation on spiral vortices is to decrease the onset value of
  $ Re_s^{c1}(\phi,\varOmega )$ with increasing
  $\varOmega$; the rate of decrease of
  $ Re_s^{c1}$ with
  $\varOmega$ (i.e.
  $d Re_s^{c1}/d\varOmega$) is larger at
  $\phi =0.3$ than that at
  $\phi =0.15$, indicating that the co-rotation has more destabilizing effect on primary bifurcation at higher particle loading. The grey patch in the inset of figure 1(c) clarifies that there is a small hysteresis for the CCF
 $\leftrightarrow$SVF transition at
  $\varOmega \leq 0.3$, but the degree of hysteresis (
 $\Delta Re_s(\phi )$) decreases with increasing
  $\varOmega$, eventually becoming non-hysteretic at
  $\varOmega \geq 0.5$. The phase diagram in figure 1(c) can be sub-divided into two parts: (i)
  $\varOmega \geq 0.1$ over which only the SVF is found in the explored range of
  $ Re_s(\phi )$; and (ii)
  $\varOmega \leq 0.05$ over which the SVF undergoes successive transitions to produce secondary and higher-order states. The sequence of latter transitions can be appreciated from figure 4 that depicts (a,b) the space-
 $Re_s(\phi )$ diagrams and (c,d) the normalized frequency maps
  $\omega /\omega _i$ at
  ${\varOmega = -10^{-3}\approx 0}$.

Figure 4. (a,b) Space– $ Re_s(\phi )$ diagrams (from the DSLR camera at 60 fps) and (c,d) the normalized frequency
  $\omega /\omega _i$ versus
  $ Re_s(\phi )$ (data from the high-speed camera at 200 fps), during (a,c) up-sweep and (b,d) down-sweep runs for
  $\phi = 0.3$ at
  $\varOmega = -10^{-3}$.
For the ‘up-sweep’ run in figure 4(a,c) at  $\phi =0.3$, the SVF state (denoted by the filled magenta circles in panel
  $c$) exists at
 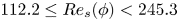 $112.2 \leq Re_s(\phi ) < 245.3$; the magenta crosses represent the harmonics of the SVF mode. A high-frequency wavy mode, marked by the filled blue circles in figure 4(c), appears in the frequency map at
  $ Re_s(\phi ) \geq 245.3$. Interestingly, both the spiral mode and the wavy mode are found to coexist at
  $245.3 \leq Re_s(\phi ) < 300.5$ over which the pattern resembles wavy spiral vortices (WSV). A snapshot of the WSV state is shown in figure 5(a) that clarifies the waviness of the spiral vortices, while figure 5(c) reveals the presence of two distinct frequencies (
 ${\kern1.4pt}f_{SVF}$ and
  $f_w$) marked by magenta and blue circles, respectively. The WSV mode ceases to exist at
  $ Re_s(\phi ) \geq 300.5$, and the WTV state takes over at
  $300.5 \leq Re_s(\phi ) < 367.7$, see figure 4(c). The structural characteristics of the single-frequency WTV mode can be ascertained from figure 5(b) and the corresponding power spectrum in figure 5(d) at
  $ Re_s(\phi ) = 326.3$. At
  $ Re_s(\phi ) \geq 367.7$, we find the appearance of an additional low-frequency mode (incommensurate) in figure 4(c), a distinct characteristic of a quasi-periodic mode, called the MWV.

Figure 5. Patterns of (a,c) WSV (wavy spiral vortex) at  $Re_s(\phi ) = 290.90$ and (b,d) WTV (wavy Taylor vortex) at
  $Re_s(\phi ) = 326.30$ during up-sweep run at
  $\varOmega = -10^{-3}$ for
  $\phi = 0.3$, consisting of (a,b) snapshots and space–time plots and (c,d) power spectra.
The above MWV state bifurcates into WTV at  $ Re_s(\phi ) \approx 318.5$, during the ‘down-sweep’ run (figure 4b,d) with decreasing
  $ Re_s(\phi )$, which continues to exist until
  $ Re_s(\phi ) \approx 218.3$; the WTV bifurcates into TVF at
  $ Re_s(\phi ) \approx 218.3$ that further transitions to SVF and finally the laminar CCF state appears at
  $ Re_s(\phi ) \leq 121.2$. Increasing the co-rotation ratio slightly to
  $\varOmega = 0.05$ (see figure 1c), the WSV and MWV states disappear and a transition sequence of CCF
  $\leftrightarrow$ SVF
  $\leftrightarrow$ TVF
  $\leftrightarrow$ WTV is found during both up- and down-sweep runs, with the primary bifurcation representing a non-axisymmetric (SVF) mode.
3.2. Effect of particle loading at fixed $\varOmega$ and the scaling of SVF frequencies

Figures 6(a) and 6(b) display the phase diagrams of patterns in the ( $\phi, Re_s(\phi,\varOmega )$) plane at
  $\varOmega = 0.05$ and
  $0.65$, respectively, that refer to of (a) a nearly stationary outer cylinder (
 $\varOmega = 0.05\sim 0$) and (b) close to the Rayleigh line
  $\varOmega = \eta ^2 \approx 0.8$ (Rayleigh Reference Rayleigh1917). The inset of figure 6(a) indicates that the TVF, RIB and SVF appear as the primary bifurcating state at
  $\phi \leq 0.05$,
  $0.1 \leq \phi \leq 0.2$ and
  $\phi > 0.2$, respectively. Note also in figure 6(a) that while a transition sequence of CCF
  $\leftrightarrow$ SVF
  $\leftrightarrow$ TVF
  $\leftrightarrow$ WTV holds at
  $\phi = 0.3$ during both up- and down-sweep runs, the SVF emerges as an intermediate state between RIB and TVF during the up-sweep run at
  $\phi =0.2$. An overall transition sequence of CCF
 $\to$RIB
 $\to$TVF
 $\to$WTV is found during the up-sweep run at
  $\phi = (0.1, 0.15)$, but the RIB state disappears during the down-sweep run at
  $\phi =0.15$, see the inset of figure 6(a). For the higher co-rotation case of
  $\varOmega = 0.65$ in figure 6(b), the (
 $\phi$,
  $Re_s(\phi )$)-plane can be divided into two regions where the primary bifurcating states are axisymmetric (TVF at
  $\phi < 0.15$) and non-axisymmetric (SVF/RIB at
  $\phi \geq 0.15$) modes, depending on the particle loading. The higher-order mode transitions are absent in figure 6(b), due to the smaller range of explored
  $ Re_s$ (with
  $f_{max}=50$ Hz) at
  $\varOmega =0.65$.

Figure 6. (a,b) Phase diagram of patterns at (a)  $\varOmega = 0.05$ and (b)
  $\varOmega = 0.65$; the line style and colour coding are the same as in figure 1. Enlarged views of selected regions in panels (a,b) are shown in corresponding insets. (c) Variations of the normalized frequency of the spiral vortices,
  $\omega _{SVF}/\omega _{sh}$, with (i)
  $ Re_s(0)$ at
  $\varOmega =0.65$ for different
  $\phi$ (main panel) and (ii)
  $\omega _{SVF}/\omega _i$ versus
  $\varOmega$ at
  $\phi =0.3$ (inset); the dashed line in the inset of panel (c) is given by (3.3). (d) ‘
 $ Re_s(0)$-independent’ frequency of spirals at
  $\phi =0.3$ for different
  $\varOmega$; the open and filled symbols for each
  $\varOmega$ denote the data for up- and down-sweep runs, respectively.
Collectively, figure 6(a,b) indicates that the effect of particle loading at  $\varOmega = 0.05$ and
  $0.65$ is to decrease the critical values of
  $ Re_s^{c1}(\phi )$ for primary bifurcations, confirming the destabilizing role of particles on the onset of primary states (TVF/SVF/RIB). However, the critical Reynolds number
  $ Re_{TVF}^{WTV}(\phi )$ for the TVF
 $\leftrightarrow$WTV transition at
  $\varOmega =0.05$ (figure 6a) has a non-monotonic dependence on the particle loading, indicating the dual role of stabilization (at
  $\phi < 0.10$) and destabilization (at
  $\phi \geq 0.10$) on the WTV mode.
The SVF such as in figures 1(c) and 6(a,b) truly represent particle-induced patterns since they are absent in the particle-free TCF. Two distinctive features of these spirals are as follows: its wave speed (i) is nearly independent of the ‘fluid’ shear Reynolds number  $ Re_s(0)$; and (ii) increases weakly with increasing particle volume fraction (
 $\phi$), as confirmed in the main panel of figure 6(c) at
  $\varOmega =0.65$. This finding is in stark contrast to the scaling for the wave speed of the ‘fluid-induced’ spirals,
  $\omega _{SVF}\propto Re_s(0)^{-0.78}\mu _r(\phi )^{0.42}$ (Singh et al. Reference Singh, Ghosh and Alam2022), that are found in the counter-rotation regime of the suspension TCF. The third distinctive feature of the ‘particle-induced’ spirals is that its wave speed increases with increasing
  $\varOmega$,
 \begin{equation} \frac{\omega_{SVF}(\varOmega)}{\omega_i} = \alpha_1 \varOmega + \alpha_2\quad \Rightarrow \quad \frac{\omega_{SVF}(\varOmega)}{\omega_{sh}} = (\alpha_1 \varOmega + \alpha_2)\left(1-\frac{\varOmega}{\eta}\right)^{{-}1}, \end{equation}
see the black dashed line in the inset of figure 6(c), indicating the linear variation of  $\omega _{SVF}/\omega _i$ with the rotation ratio
  $\varOmega$; here,
  $(\alpha _1, \alpha _2)\approx (0.522, 0.46)$ and
  $\omega _{sh}=\omega _i(1-\varOmega /\eta )$ is the effective rotation rate across the annular gap. The limiting value of
  $\omega _{SVF}(\varOmega =0)\approx 0.46\omega _i$ from (3.3) agrees closely with that reported by Ramesh et al. (Reference Ramesh, Bharadwaj and Alam2019),
  $\omega _{SVF}/\omega _i\approx 0.45$, see their figure 16(c), for the case of the pure inner cylinder rotation (
 $\varOmega =0$). While the data in the inset of figure 6(c) represent the onset SVF frequency, its independence with
  $ Re_s(0)$ at any
  $\varOmega$ is confirmed in figure 6(d). We conclude that the spiral vortices become progressively faster as we move closer to the Rayleigh line (
 $\varOmega =\eta ^2$ or
  $ Re_o=\eta Re_i$) beyond which the TCF is stable and the fluid inertia
  $ Re_s(0)$ has a negligible effect on its wave speed.
3.3. Discussion and theoretical perspectives
Returning to figure 4, the observed differences in the transition sequence for  $\phi =0.3$ between up- (figure 4a,c) and down-sweep (figure 4b,d) runs indicate the multi-stability among different patterns at
  $\varOmega = -10^{-3}\approx 0$ for which the transitions occur with pronounced hysteresis. Such hysteretic patterns/states mirror previous findings at
  $\varOmega =0$ (Majji et al. Reference Majji, Banerjee and Morris2018; Ramesh et al. Reference Ramesh, Bharadwaj and Alam2019; Dash et al. Reference Dash, Anantharaman and Poelma2020; Moazzen et al. Reference Moazzen, Lacassagne, Thomy and Bahrani2022) and are known to persist in the counter-rotation regime
  $\varOmega <0$ (Singh et al. Reference Singh, Ghosh and Alam2022) too. Concerning the effect of co-rotation on hysteresis, the insets of figure 1(b,c) confirmed that the degree of primary hysteresis decreases in the co-rotation regime for finite
  $\phi >0$.
One interesting finding in figure 4(c,d) is that the fundamental (passage) frequency of the wavy vortices  $\omega _{WTV}/\omega _i$ decreases with increasing shear Reynolds number
  $ Re_s(\phi )$ at
  $\varOmega \approx 0$; we verified that this observation holds for all
  $\varOmega >0$ and
  $\phi$. This result echoes the previous findings of: (i) Singh et al. (Reference Singh, Ghosh and Alam2022) in the counter-rotating (
 $\varOmega <0$) suspension TCF and (ii) King et al. (Reference King, Li, Lee, Swinney and Marcus1984) in the particle-free TCF at
  $\varOmega =0$. Possible reasons for the initial decay of
  $\omega _{WTV}( Re_s)$ with increasing
  $ Re_s$ could be: (i) the increase in the wave-length of the wavy vortices; (ii) the generation of the harmonics of the fundamental mode; and (iii) the appearance of incommensurate modes (MWV) in the same limit – this remains an open issue for the future.
The future work on theoretical fronts should focus on predicting the onset of primary and higher-order transitions from linear (Taylor Reference Taylor1923; Majji et al. Reference Majji, Banerjee and Morris2018; Gillissen & Wilson Reference Gillissen and Wilson2019) and nonlinear (Shukla & Alam Reference Shukla and Alam2009) stability analyses or direct numerical simulations (Kang & Mirbod Reference Kang and Mirbod2021; Kang et al. Reference Kang, Schatz and Mirbod2024) of the pertinent continuum equations (Nott & Brady Reference Nott and Brady1994; Morris & Boulay Reference Morris and Boulay1999). The underlying constitutive model for the particle stress must account for inertial migration phenomena (Majji & Morris Reference Majji and Morris2018; Ramesh et al. Reference Ramesh, Bharadwaj and Alam2019; Baroudi et al. Reference Baroudi, Majji and Morris2020) since the particle Reynolds number  $ Re_p\sim O(1)$ remains an order-one quantity in all these experiments. The discrepancies between model predictions (Gillissen & Wilson Reference Gillissen and Wilson2019; Kang & Mirbod Reference Kang and Mirbod2021) and experimental results (Majji et al. Reference Majji, Banerjee and Morris2018; Ramesh et al. Reference Ramesh, Bharadwaj and Alam2019) have been critically analysed in a recent review article by Baroudi et al. (Reference Baroudi, Majji, Peluso and Morris2023) who concluded that the existing continuum models are not adequate to describe the behaviour of inertial suspensions. A stringent test of the applicability of such theoretical models would be to verify if they can predict the distinction between particle-induced and fluid-induced spirals in terms of their wave speeds (3.3), a key finding of the present work.
4. Conclusions
Based on the first set of experiments in the co-rotation regime ( $\varOmega \geq 0$) of the suspension Taylor–Couette flow (TCF), we showed that while the bifurcation sequence of CCF
  $\leftrightarrow$ TVF
  $\leftrightarrow$ WTV holds in a dilute suspension (
 $\phi \leq 0.05$), the non-axisymmetric states, such as the SVF and RIB, are born as primary bifurcations with increasing particle loading (
 $\phi \geq 0.1$), as summarized in figures 1(b,c) and 6(a,b). The latter states are analogues of the ‘particle-induced’ patterns reported in the recent studies at
  $\varOmega = 0$ (Majji et al. Reference Majji, Banerjee and Morris2018; Ramesh et al. Reference Ramesh, Bharadwaj and Alam2019). Both the co-rotation (
 $\varOmega$) and the particle loading (
 $\phi$) are found to promote an early onset of the primary instability (TVF/SVF/RIB) and hence destabilizing. Increasing
  $\varOmega$ delayed/suppressed the onset of WTV, indicating its stabilizing role on the secondary/tertiary WTV state, but the particle loading can stabilize (
 $\phi <0.1$) or destabilize (
 $\phi \geq 0.1$) WTV at small
  $\varOmega \sim 0$. The distinguishing feature of the ‘particle-induced’ spiral vortices is quantified in terms of its wave speed which is found to increase with increasing
  $\varOmega$ but remain nearly independent of the fluid inertia (
 $ Re_s(0)$) – the latter finding is in contrast to the strong dependence on (
 $ Re_s(0), \phi$) of the wave speed of the ‘fluid-induced’ spirals (Singh et al. Reference Singh, Ghosh and Alam2022) that operate in the counter-rotating TCF (Coles Reference Coles1965; Andereck et al. Reference Andereck, Liu and Swinney1986). Theoretical explanations of the particle-induced signatures on our experimental results are awaited.
Acknowledgements
We sincerely thank Mr D. Das and Dr S. Raha of Anton-Paar India Pvt. Ltd. for arranging discussions with the R&D Team of Anton-Paar GmBH (Graz, Austria) – this led to the updated version (2022) of the RheoCompass software for the co-rotation regime of two motors. M.G. acknowledges the Science and Engineering Research Board (India) for the Postdoctoral Fellowship (PDF/2020/000916) during 2021–2022; he also acknowledges JNCASR for continued support (2023–) via the Centre's Postdoctoral Fellowship.
Declaration of interests
The authors report no conflict of interest.


