


Introduction
Conference committees are temporary committees comprised of members of both upper and lower legislative chambers, deployed to resolve bicameral differences. These ad hoc committees have been a critical component of the legislative process in the states and the US Congress for decades (McCown 1927; National Conference of State Legislatures 1996). Their value stems from their ability to resolve bicameral disagreements: For a bill to be sent to the executive, both chambers of a legislature must pass identical versions of a bill. Historically, conference committees have reconciled bicameral differences on controversial and salient legislation (Oleszek et al. Reference Park, Smith and Vander Wielen2015; Ryan Reference Shepsle and Weingast2018; Sinclair Reference Smith2016). Moreover, conferees typically possess a good degree of autonomy over the shape of agreements they negotiate: They can add provisions to bills that were not adopted by either chamber, remove provisions passed by both chambers (known as the “ex post veto”), and even substitute new provisions orthogonal to the underlying bills sent to conference. These powers have prompted scholars to refer to conference committees as the “third House of Congress” (e.g., Dewhirst Reference Dewhirst1985; Vogler Reference Weingast and Marshall1971). As Manley (Reference Manley1970, 239) observed long ago, “all roads lead to the conference committee.”Footnote 1
Despite research asserting the pervasive influence of conference committees in congressional politics, the utilization of conference committees in Congress has declined over time as institutional changes and partisan polarization have altered the conciliation process (Binder Reference Binder2011; Park, Smith, and Vander Wielen Reference Riker and Niemi2017). Currently, amendment trading and informal talks between chambers reign as Congress’ preferred post-passage bargaining tools (Oleszek Reference Oleszek, Oleszek, Rybicki and Heniff2010; Ryan Reference Ryan2011; Sinclair Reference Smith2016). Although congressional conference committees seem to be used less frequently, Congress is only one of America’s 50 bicameral legislatures. Conference committees regularly form across most state legislatures, although little is known about these committees and their effects on legislative outcomes (Gross Reference Hicks1980).
Until now, state politics scholars have only focused on how varying institutional rules affect majority party control over conference committees and their outcomes (Emrich Reference Emrich2020; Ryan Reference Ryan2014).Footnote 2 This paper advances our understanding of state-level conference committees by exploring the conditions under which legislatures go to conference. I use an original dataset of all passed, noncommemorative bills and conference committees created between 2005 and 2018 to examine how frequently state legislatures use conference committees to resolve bicameral differences. I then leverage variation across the states to identify how institutional rules and partisan dynamics influence the likelihood that legislatives chambers agree to go to conference.
Unlike the US House and Senate, which seldom agree in recent years to go to conference (Ryan Reference Ryan2011), state legislatures have remained stable in their use of conference committees: Thousands of conference committees are appointed annually. My findings suggest several forces shape the probability that state legislatures will go to conference. First, similar to the US Congress, state legislatures are more likely to form conference committees on “must-pass” legislation. Second, chamber rules matter (Clark and Linzer Reference Clark and Linzer2015). Majority parties authorize conference committees when chamber rules permit conferees to change the bill at will, but refrain from conferencing when the minority party retains the right to select its own conferees. Moving to the state level enhances our understanding of bicameral politics and establishes the limits of generalizing from Congress to the state legislative context.
Conference Committees in State Legislatures
Like Congress, bicameral state legislatures have three options if chambers pass different versions of a bill. First, either chamber can accept the other’s version of the bill. Second, chambers could engage in amendment trading, “ping ponging” bills between chambers until a consensus is reached (Oleszek Reference Oleszek, Oleszek, Rybicki and Heniff2010). Third, both chambers of the legislature could agree to go to conference, drawing members from both chambers to resolve differences in the two chambers’ bills. Although the majority of legislation is reconciled using one of the first two methods, major legislation is often reconciled in conference (Oleszek et al. Reference Park, Smith and Vander Wielen2015; Ryan Reference Shepsle and Weingast2018; Shepsle and Weingast Reference Shor and McCarty1987; Sinclair Reference Smith2016).
Conference committees handle complex and salient bills due to their placement in the sequence of legislative policy making. Conferees are often the last actors to alter the legislation they are charged with reconciling. Subject to attaining majority support from the chambers, this last-mover advantage bestows conferees a broad bandwidth to modify legislation (Nagler 1989; Vander Wielen Reference Vander Wielen2010). Moreover, the conference reports produced are unamendable. Unlike other types of bills which legislators can shape through floor amendments, adoption of the conference report is subject to a single yea-or-nay vote.Footnote 3 Thus, conference reports force legislators to consider various policies as an indivisible whole. This all-or-nothing characteristic is so powerful that some scholars note that many laws are written solely in conference (Clapp Reference Clapp1963; Van Beek Reference Vander Wielen1995). Therefore, the choice by majority parties to go to conference is an important strategic consideration.
Frequently, conference committees form when majority coalitions from both chambers (typically at least a majority of the majority party; Cox and McCubbins Reference Cox and McCubbins2005) recognize that the status quo is insufficient, but disagree on how differing provisions adopted by the chambers should be resolved. Conference committees resolve this disagreement through informational advantages, as conferees overcome the uncertainty chambers have regarding the preferences of the opposite chamber, elucidating why the parent chambers delegate authority to conferees at all (Vander Wielen Reference Vander Wielen and Smith2013).Footnote 4
Given the costs associated with bringing a bill up to the conference stage, legislatures ultimately prefer a resolution to bill failure (Tsebelis and Money Reference Van Beek1997). Because of this, majority parties seek to maximize the likelihood of bill success in conference. Standard vote-buying models in legislatures suggest that majority parties find it beneficial to maintain supermajorities when advancing legislation (Groseclose and Snyder Reference Gross1996). Although only a simple majority is required to adopt a conference report, multiple vote buyers can entangle the bargaining process (Jenkins and Monroe Reference Kiewiet and McCubbins2012). This is due to majority party defections having an increasingly damaging effect on a bill’s prospects. Of course, the loss of coalition members increases the uncertainty surrounding a conference report’s outlook (Riker and Niemi Reference Rogers1962). As the size of the majority party’s coalition shrinks, minority party leaders can make decreasing offers to persuade pivotal majority party moderates out of the coalition (Groseclose and Snyder Reference Gross1996). Not only can minority leaders purchase individual votes more efficiently with each defection, but each remaining majority member also becomes increasingly valuable to the majority coalition.
Broadly speaking, unstable majority parties may not prefer the conference committee process as a post-passage bargaining method due to the potential complications it introduces. Minimal-size majorities may imperil a bill while in conference, as post-passage changes may alienate cross-pressured majority members who reluctantly voted for initial passage. Even if the majority party can “grease the wheels” (Evans Reference Fiorina2004) by sending particularized benefits to pivotal members’ constituencies as needed to obtain votes, this method can be costly. As a result, I hypothesize that large majority party coalitions will be more likely to go conference than small majority party coalitions:
Hypothesis 1a: The greater the proportion of seats held by a majority party across a legislature, the more likely a majority party is to go to conference.
However, Hypothesis 1a ignores the political reality of bicameral negotiations. Legislative chambers within a state do not act independently of one another. Since a single chamber’s approval is a necessary but not sufficient condition for conference proceedings, majority party leaders within the originating chamber likely consider the actions of the majority leadership of the opposing chamber when initially deciding to conference. In this context, conferencing is most likely when bill differences are unreconcilable by other methods of resolution (Ryan Reference Ryan2011). Specifically, I expect conference committees to be most likely in those legislatures operating under divided chamber control.
Previous literature demonstrates that large intercameral differences and split chamber control stagnate state legislative processes (Hicks Reference Jenkins and Monroe2015; Rogers Reference Rohde2005). Moreover, rising ideological polarization in state legislatures corresponds to increased acrimonious debate during initial bill processes (Shor and McCarty Reference Sinclair2011). Amendment trading has little value as a post-passage bargaining tool within these distant chambers because it is unlikely that opposed rank-and-file legislators would agree to pass floor amendments to coalesce versions of an unfavorable bill. In contrast, conference committees provide party leaders with an opportunity to allow policy experts from relevant standing committees to negotiate multiple issues at once while also freeing the chamber floor for other matters (Krehbiel Reference Krehbiel1991; Reference Lazarus and Monroe1993). Therefore, for those bills passed in disparate chambers where each majority party is powerful within a single chamber, conference committees serve as a mutually agreeable compromise for party leaders to maximize their respective benefits (Rubinstein Reference Ryan1982; Ryan Reference Shepsle and Weingast2018):
Hypothesis 1b: The greater the proportion of seats held by majority parties in a split legislature, the more likely majority parties are to go to conference.
Beyond chamber characteristics, conventional wisdom suggests that “must-pass” legislation is more likely to be bargained on, as the ramifications of legislative failure on these bills are relatively extreme (Adler and Wilkerson Reference Adler and Wilkerson2013; Sinclair Reference Smith2016).Footnote 5 In state legislatures, few bills are as significant as budget bills. This is because state constitutional law mandates all 50 states to adopt a new budget prior to the start of each new fiscal year or biennium, with failure to enact a budget being universally scorned (Cummins and Holyoke Reference Cummins and Holyoke2018; Klarner, Phillips, and Muckler Reference Koger and Lebo2012). Moreover, spending decisions are rife with partisan conflict, and their salience lends themselves to post-passage bargaining where lawmakers can shift legislation toward their preferences for electoral gain (Vander Wielen Reference Vander Wielen2010; Weingast and Marshall Reference Weingast and Marshall1988). This leads to my second hypothesis.
Hypothesis 2: Majority parties will be more likely to go to conference on budget bills than non-budget bills.
Institutional Variation in State Legislatures
The rules of both the US House and Senate require that legislators serving on a conference committee are “not to add new matter, reopen provisions that both chambers agreed to, or exceed the range of matters in disagreement committed to them” (Oleszek et al. Reference Park, Smith and Vander Wielen2015, 272). Therefore, Congress’ conference committees are restricted to the content within the bill by a limited scope requirement, and orthodox lawmaking procedures suggest that conference committees exclusively reconcile House and Senate versions of legislation.Footnote 6 Forty-four state legislative chambers follow the US Congress and always use limited scope conference committees. For example, the California assembly’s legislative rules explicitly prohibit “any conference committee approve substantial policy changes that have not been heard by the policy committee of each house” (California State Legislature 2015, 161).
In contrast, 30 state legislative chambers permit their conferees to resolve bill differences with open scope requirements, whereby the entire bill is subject to change.Footnote 7 These changes often occur by incorporating new amendments or substituting language from other bills. Consider Georgia’s House and Senate, whose open scope rules stipulate that their committee of conferences “may consider the whole subject matter embraced in a bill, resolution, or other matter before it and may recommend rescission by either house, new amendments, new bills and resolutions, or other germane changes” (Georgia State Senate Reference Gilmour2013, 33; Georgia State House of Representatives 2015, 40).Footnote 8 Similarly, South Dakota’s Joint Rule 8.2 notes that conference committee reports must be germane to bill titles as submitted to conference committees, but provides no guidelines concerning bill contents.Footnote 9
Previous work demonstrates that congressional conferees are constrained by the limited scope requirement and largely execute majority party priorities (Vander Wielen and Smith Reference Vogler2011). Absent the limited scope requirement (and given the unamendable nature of conference reports), state-level conferees may be more likely to exercise discretion to craft legislation to their liking, regardless of the preferences expressed by majorities. Thus, rational party leaders may be apprehensive about forming a conference committee when conferees operate under open scope conference proceedings:
Hypothesis 3: If state legislative rules permit open scope conference committees for both chambers, majority parties will be less likely to go to conference.
Twenty state chambers use a varied conference committee approach whereby committees can individually differ between open and limited scope.Footnote 10 For example, Wyoming’s Rule 30-30-3 notes that either chamber can request a “free” conference committee which “may discuss and propose amendments to a bill in its entirety and is not confined to a particular amendment” (Montana State Legislature Reference Nagler2015, 7). Other legislatures (e.g., Alaska and South Carolina) have conference committees which are limited in scope unless changed by the parent chamber.Footnote 11 Overall, nearly every state legislature either envelops conference committee rules in their joint rules or have similar rules across both chambers. The two outliers are Florida and New York. Florida’s House operates with an open conference committee system while its Senate is limited; New York’s Assembly varies with each conference, and its Senate is always open.Footnote 12 Figure 1a,b illustrates conference committee scope rules by state legislative chamber across the United States.Footnote 13

Figure 1. (a) State lower chamber conference committee scope. (b) State upper chamber conference committee scope.
Hypothesis 3 underscores how majority parties may be constrained when institutional designs limit their control over parliamentary procedures (Ryan Reference Ryan2014). That said, state legislative conference committee procedures also vary with respect to who appoints conferees. In Congress, Speaker of the House and Senate Majority Leader control conference appointments, and due to this, conferees largely follow majority party preferences (Lazarus and Monroe Reference Lee2007).Footnote 14 Moreover, rising polarization has led majority parties in periods of unified party control to largely exclude the minority party from participating in conference activities (Binder Reference Binder2011; Ryan Reference Ryan2011; Smith Reference Smithson and Merkle2014).Footnote 15
Like Congress, most state legislatures endow their majority parties with universal conferee appointing rights. However, several state chambers’ legislative rules also permit the lieutenant governor or minority party leadership with rights to appoint a single or multiple legislators to a conference delegation. Consider Massachusetts’ Joint Rule 11 which notes that “Committees of conference shall consist of three members on the part of each branch, one member of each branch being a member of the minority party representing its vote” (General Court of the Commonwealth of Massachusetts 2019). In total, 14 state chambers possess minority appointing rights.Footnote 16 Figure 2a,b provides visualizations of conference appointing rules by state legislative chamber.

Figure 2. State lower chamber conference committee scope appointers. (b) State upper chamber conference committee scope appointers.
With political parties in state legislatures becoming increasingly ideologically bifurcated (Shor and McCarty Reference Sinclair2011), distant parties manipulate parliamentary procedures within a chamber to further their priorities. In chambers where the minority party can appoint conferees, partisan collective gain encourages minority legislators to obstruct majority goals in conference, since compromise on average is a losing strategy for the minority party (Gilmour Reference Groseclose and Snyder1995; Koger and Lebo Reference Krehbiel2017; Lee Reference McCown2009, Reference Lee2016). This unruly behavior diverges from the formal and hierarchical authority paradigm that structures most state legislatures (Squire and Moncrief 2019). Consequently, majority party coalitions may seek to reduce minority input and may be less likely to go to conference when forced to collaborate with minority conferees.
Hypothesis 4: If state legislative rules permit a chamber’s minority party to appoint its own members to conference committees, majority parties will be less likely to go to conference.
Data and Methods
To analyze the conditions under which state legislatures go to conference, I collected all noncommemorative bills passed by both chambers in each of the US’s 49 bicameral state assemblies between 2005 and 2018.Footnote 17 The data encompass all bills passed by both chambers that were signed into law by a governor, never acted upon by a governor (including pocket vetoes), became law without a governor’s signature, explicitly vetoed by a governor, or where a veto was overridden by the legislature. Bill histories were scraped from state legislature web archives, as every state provides detailed histories of a bill’s progress through the legislature.Footnote 18 Likewise, state legislatures report their conference proceedings. Conference committee information comes from Emrich (Reference Emrich2020), which contains all conference delegations from 2005 to 2018.Footnote 19
Several states either do not use or seldom employ conference committees. For example, New Jersey and Rhode Island do not use conference committees to resolve bicameral differences. Delaware only uses a joint appropriation committee for budget bills, whereas Arkansas, Connecticut, and New York have rarely used conference committees in the past century, with none forming between 2005 and 2018.Footnote 20 Moreover, despite the data collection beginning in 2005, a few states do not report bill histories or conference committee information throughout the scope of my analysis. Kentucky provides bill history and conference committee information beginning in 2006, whereas Louisiana and Oregon only provide conference information starting in 2007. Likewise, no information was obtainable regarding Maine’s conference committees for its 122nd and 124th sessions (2005–06 and 2009–10). Florida, Massachusetts, Tennessee, and West Virginia only provide bill history and conference delegation from 2011 to present.Footnote 21 Appendix A.3 provides a detailed listing of the data collected for each state and their respective time frame. Cumulatively, there are 202,261 bills and 20,328 conference committees over 590 state-years across 43 state legislatures, as shown in Table 1.Footnote 22
Table 1. Status of bills post initial passage vote in state legislatures, 2005–18

Figure 3 illustrates the within-state changes in conferencing trends for noncommemorative bills for all states which used conference committees between 2005 and 2018.Footnote 23 Few patterns emerge from Figure 3, as states have employed conference committees at consistent rates over time.Footnote 24 Notably, most states seldom use conference committees. Thirty-eight states use conference committees for less than 10% of passed legislation, and only four states (Hawaii, Indiana, Kansas, and Mississippi) exceed 30%.

Figure 3. Percentage of conference committee bills in state legislatures by state, 2005–18.
To examine how varying institutional features affect the likelihood of state legislatures going to conference, I estimate logistic regression models with two-way random effects of the following form (Smithson and Merkle Reference Squire2013):
 $$ {\displaystyle \begin{array}{l}\mathit{\ln}\left(\frac{ConferenceCommittee}{1- ConferenceCommittee}\right)\hskip-0.2em =\hskip-0.2em {\displaystyle \begin{array}{l}{\beta}_1 MajoritySiz{e}_{it}+{\beta}_2 SplitLegislatur{e}_{it}\\ {}\hskip-0.5em +{\beta}_3 MajoritySize\times SplitLegislatur{e}_{it}\\ {}\hskip-0.5em +{\beta}_4 BudgetBil{l}_{it}+{\beta}_5 ConferenceScop{e}_{it}\\ {}\hskip-0.5em +{\beta}_6 ConferenceAppointe{r}_{it}+{\delta}_t+{\rho}_i+{\gamma}_{it}+{\epsilon}_{it},\end{array}}\end{array}} $$
where $ \mathit{\ln}\left(\frac{ConferenceCommitte{e}_{it}}{1- ConferenceCommitte{e}_{it}}\right) $
is a dichotomous indicator equal to 1 if a passed bill goes to conference, and 0 otherwise.
$ \mathit{\ln}\left(\frac{ConferenceCommitte{e}_{it}}{1- ConferenceCommitte{e}_{it}}\right) $
is a dichotomous indicator equal to 1 if a passed bill goes to conference, and 0 otherwise. $ {\delta}_t $
represents year random effects to account for year-to-year differences in conferencing common across all states and
$ {\delta}_t $
represents year random effects to account for year-to-year differences in conferencing common across all states and $ {\rho}_i $
represents session random effects.Footnote
25 These random effects treat conference committees as being nested within states and legislative sessions.
$ {\rho}_i $
represents session random effects.Footnote
25 These random effects treat conference committees as being nested within states and legislative sessions.
Since legislature membership sizes vary across states, I measure size relative to the two-party percentage of seats in a legislature.Footnote
26 Thus, $ {\beta}_1 MajoritySiz{e}_{it} $
is an interval variable equal to the two-party percentage of legislative seats held by majority parties. Succinctly, the larger the majority parties, the easier it is for them to adopt the conference report. This variable comes from combining Klarner’s (Reference Klarner, Phillips and Muckler2013) and the National Council of State Legislatures’ (Reference Oleszek2020) data on state partisan composition.
$ {\beta}_1 MajoritySiz{e}_{it} $
is an interval variable equal to the two-party percentage of legislative seats held by majority parties. Succinctly, the larger the majority parties, the easier it is for them to adopt the conference report. This variable comes from combining Klarner’s (Reference Klarner, Phillips and Muckler2013) and the National Council of State Legislatures’ (Reference Oleszek2020) data on state partisan composition. $ {\beta}_2 SplitLegislatur{e}_{it} $
measures branch-level divided government, and is a binary variable equal to 1 if the chambers are controlled by differing parties (Binder Reference Binder2003). Party leaders likely acknowledge the preferences of the governor and opposing chamber when deciding on whether to go to conference since a majority of both chambers must agree on the conference report before it is sent to the governor. To analyze Hypothesis 1b, I interact the majority party size and split legislature variables which is represented by
$ {\beta}_2 SplitLegislatur{e}_{it} $
measures branch-level divided government, and is a binary variable equal to 1 if the chambers are controlled by differing parties (Binder Reference Binder2003). Party leaders likely acknowledge the preferences of the governor and opposing chamber when deciding on whether to go to conference since a majority of both chambers must agree on the conference report before it is sent to the governor. To analyze Hypothesis 1b, I interact the majority party size and split legislature variables which is represented by $ {\beta}_3 MajoritySize\times SplitLegislatur{e}_{it} $
.
$ {\beta}_3 MajoritySize\times SplitLegislatur{e}_{it} $
.
I capture bill significance with $ {\beta}_4 BudgetBil{l}_{it} $
, which is a dummy variable equal to 1 if a passed bill is a budget bill, and 0 otherwise. Some states (e.g., Arizona, Minnesota, Mississippi, and Utah) have several appropriations bills that functionally sum to a single budget bill. For example, North Dakota in 2017 had 55 appropriation bills which cumulatively funded governmental processes. In these situations, each appropriations bill is coded as a budget bill.Footnote
27 In total, 2,942 of the 202,261 passed bills are budget-related bills.Footnote
28
$ {\beta}_4 BudgetBil{l}_{it} $
, which is a dummy variable equal to 1 if a passed bill is a budget bill, and 0 otherwise. Some states (e.g., Arizona, Minnesota, Mississippi, and Utah) have several appropriations bills that functionally sum to a single budget bill. For example, North Dakota in 2017 had 55 appropriation bills which cumulatively funded governmental processes. In these situations, each appropriations bill is coded as a budget bill.Footnote
27 In total, 2,942 of the 202,261 passed bills are budget-related bills.Footnote
28 $ {\beta}_5 ConferenceScop{e}_{it} $
and
$ {\beta}_5 ConferenceScop{e}_{it} $
and $ {\beta}_6 ConferenceAppointe{r}_{it} $
correspond to the type of conference committee rules that a state legislative chamber has.
$ {\beta}_6 ConferenceAppointe{r}_{it} $
correspond to the type of conference committee rules that a state legislative chamber has. $ {\beta}_5 ConferenceScop{e}_{it} $
is a dummy variable equal to 1 if both state chambers utilize an open scope conference committee system in a given year, and 0 if either or both chambers utilize limited scope conferencing rules.Footnote
29
$ {\beta}_5 ConferenceScop{e}_{it} $
is a dummy variable equal to 1 if both state chambers utilize an open scope conference committee system in a given year, and 0 if either or both chambers utilize limited scope conferencing rules.Footnote
29 $ {\beta}_6 ConferenceAppointe{r}_{it} $
is an ordered categorical predictor equal to 2 if both chambers permit minority influence over the conference appointing process in a given year, 1 if a single minority party in a state legislative chamber can appoint conferees, and 0 if the state’s majority party unilaterally selects conferees. Both chambers having the ability to dilute conference delegations with minority conferees likely increase uncertainty about conference outcomes for the majority party more than a single chamber, and a single chamber having minority powers introduces more uncertainty than unilateral majority appointments. Importantly, both sets of rules do not vary within-state across my dataset. That is, there are no state legislative chambers from 2005 to 2018 that change their conference scopes or appointing rights.Footnote
30
$ {\beta}_6 ConferenceAppointe{r}_{it} $
is an ordered categorical predictor equal to 2 if both chambers permit minority influence over the conference appointing process in a given year, 1 if a single minority party in a state legislative chamber can appoint conferees, and 0 if the state’s majority party unilaterally selects conferees. Both chambers having the ability to dilute conference delegations with minority conferees likely increase uncertainty about conference outcomes for the majority party more than a single chamber, and a single chamber having minority powers introduces more uncertainty than unilateral majority appointments. Importantly, both sets of rules do not vary within-state across my dataset. That is, there are no state legislative chambers from 2005 to 2018 that change their conference scopes or appointing rights.Footnote
30 $ {\gamma}_{it} $
controls for chamber-level ideological factors that might influence the likelihood of legislatures going to conference. First, I control for the heterogeneity of preferences in state legislatures across and within political parties. I measure ideological distance between parties by using the Shor and McCarty’s (Reference Sinclair2011) common-space scores for state legislatures. These ideal points are generated from the fusion of state-level roll call voting data and surveys of state legislative candidates. They vary by chamber by legislature by year, allowing scholars to make ideological comparisons across states and time. I use the Shor–McCarty interparty heterogeneity indicator which takes the absolute value of the difference between the chambers’ ideological median for a given legislative session. An increase in this variable ought to amplify the likelihood of conferencing because the chambers will be less able to reconcile their differences during the initial passage process (Ryan Reference Ryan2011). Second, I gauge ideological diversity within a state legislature by using Shor and McCarty’s (Reference Sinclair2011) intraparty heterogeneity measure, which is the averaged standard deviation of majority party legislator’s ideal points across both chambers. Given that greater levels of intraparty heterogeneity weaken the majority party leadership (Rohde Reference Rubinstein1991), an increase in this variable ought to decrease the likelihood of conferencing since party leaders will be less able to coalesce diverse preferences into a winning coalition.
$ {\gamma}_{it} $
controls for chamber-level ideological factors that might influence the likelihood of legislatures going to conference. First, I control for the heterogeneity of preferences in state legislatures across and within political parties. I measure ideological distance between parties by using the Shor and McCarty’s (Reference Sinclair2011) common-space scores for state legislatures. These ideal points are generated from the fusion of state-level roll call voting data and surveys of state legislative candidates. They vary by chamber by legislature by year, allowing scholars to make ideological comparisons across states and time. I use the Shor–McCarty interparty heterogeneity indicator which takes the absolute value of the difference between the chambers’ ideological median for a given legislative session. An increase in this variable ought to amplify the likelihood of conferencing because the chambers will be less able to reconcile their differences during the initial passage process (Ryan Reference Ryan2011). Second, I gauge ideological diversity within a state legislature by using Shor and McCarty’s (Reference Sinclair2011) intraparty heterogeneity measure, which is the averaged standard deviation of majority party legislator’s ideal points across both chambers. Given that greater levels of intraparty heterogeneity weaken the majority party leadership (Rohde Reference Rubinstein1991), an increase in this variable ought to decrease the likelihood of conferencing since party leaders will be less able to coalesce diverse preferences into a winning coalition.
Lastly, I account for the relative professionalism of a state legislature. Professionalized legislatures spend more time in session, making these chambers more amenable to conference proceedings. I capture each state’s professionalism with the Squire Index (Squire Reference Squire and Moncrief2017), which is a weighted combination of salary, days in session, and staff per legislator relative to members of Congress.Footnote 31
Results
Table 1 shows the frequency of conference committees for all passed, noncommemorative bills from 2005 to 2018. As shown, most bills do not go to conference, as just over 10% of bills undergo conference proceedings after being passed by the upper or lower chamber. However, there is a measurable difference in the likelihood of a bill becoming law conditional on it being sent to conference. About two-thirds of bills that go to conference become law; over 90% of nonconferenced bills are enacted into law. A simple proportions test demonstrates a statistically significant difference between these two forms of legislation (Pearson chi square = 15,983, p < .001), although this finding is expected given that conference committees handle the most politically controversial legislation. Within the legislature, only about 70% of conferenced bills have their conference reports adopted by the legislature, with the rest either dying in conference or rejected by the legislature. Of those conference reports adopted, about 92% become law, although nonconferenced bills are still more likely to become law (Pearson chi square = 42.87, p < .001).Footnote 32
The results of the logistic random effects models are provided in Table 2. For ease of interpretation, all continuous independent variables are standardized (i.e., have a mean equal to 0 and standard deviation equal to 1) to facilitate direct comparisons in effect sizes across all variables (Gelman 2008). A one-unit change in the continuous variables covers two standard deviations of the variable. Since these are linear transformations of the continuous variables, they do not affect statistical inference; the change is purely for interpretative purposes. Unstandardized results are provided in Appendix B.3.
Table 2. Predictors of conference committee usage in state legislatures

Note. Standard errors are given in parentheses.
* p < .1.
** p < .05.
*** p < .01.
Model 1 provides the constitutive model specification, whereas model 2 incorporates the interaction term to analyze Hypothesis 1b. Model 1 shows little evidence that majority party size increases the likelihood of conferencing, thus offering no support for Hypothesis 1a. However, model 2 illustrates a statistically significant interactive relationship between majority party size and split chamber control, whereby large intrachamber majorities are more likely to conference in a divided legislature. This finding is depicted in Figure 4, which presents the predicted probabilities of conferencing across levels of majority party size and chamber control. Substantively, slim majorities are more likely to go to conference in a unified legislature, diverging from previous literature which suggests conferencing is more likely when majority parties are sufficiently united (Ryan Reference Ryan2011). However, the positive slope for split legislatures indicates that as intraparty majority size increases, so too does the probability of conferencing.
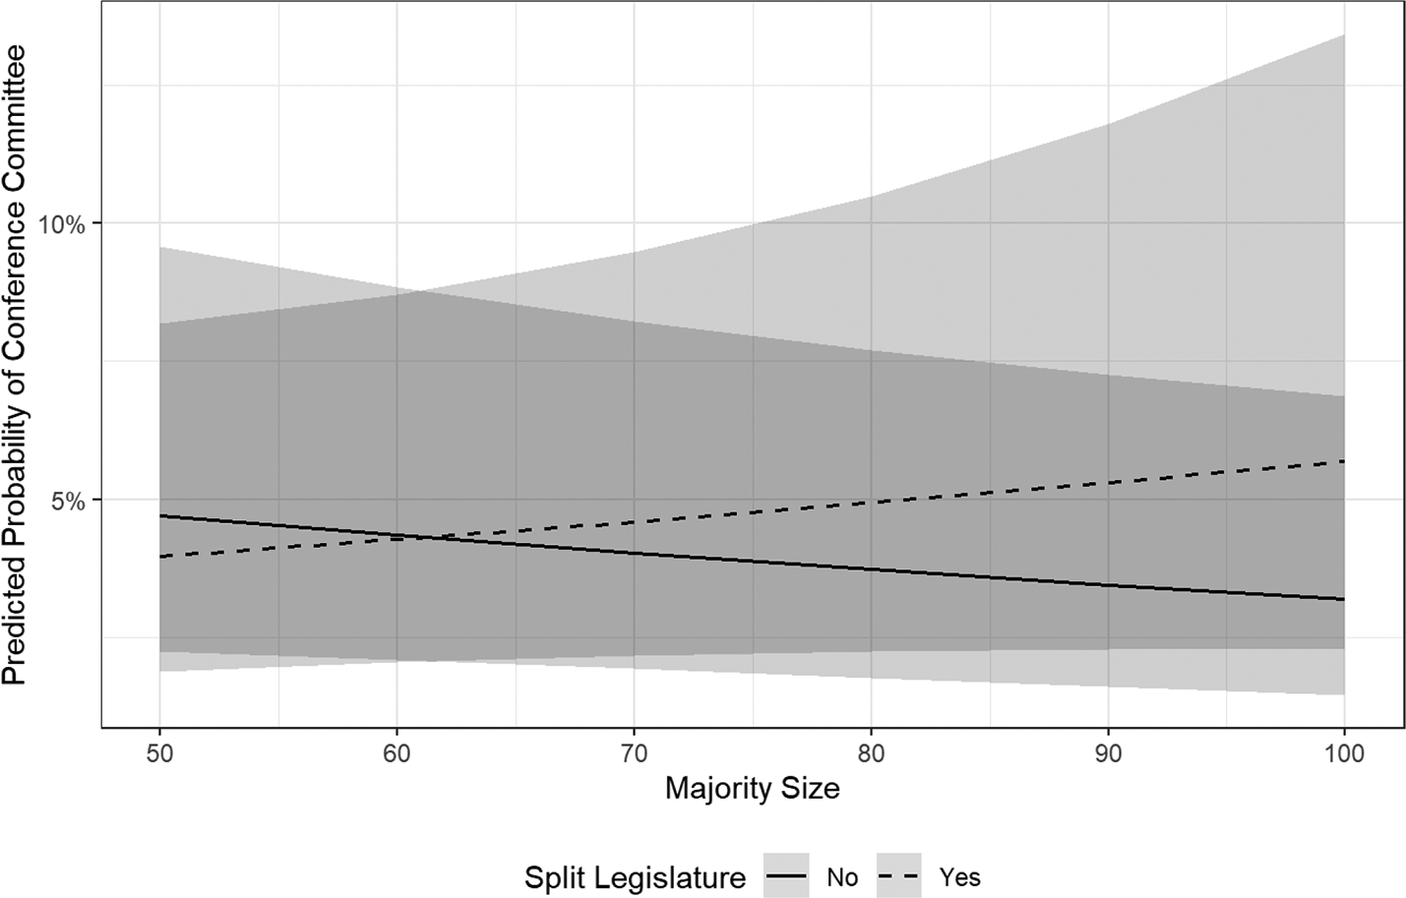
Figure 4. Predicted probability of conference committee across values of majority party size.
Both models support the supposition that salient and substantively important legislation is more likely to go to conference, as budget bills are over five times as likely to go to conference than nonbudget bills (increasing the likelihood of conferencing from 4% to 23%; Oleszek et al. Reference Park, Smith and Vander Wielen2015; Sinclair Reference Smith2016). This finding supports Hypothesis 2 and is illustrated in Figure 5, which presents model 2’s estimates of the average marginal effect of budget bill status on the likelihood of a state legislative chamber conferencing. This is an expected finding because budget bills are often the most important legislative priority for a state legislature, with several states (e.g., California) having devoted conference committees for the budget.

Figure 5. Predicted probability of conference committee conditional on bill type.
There is no support for Hypothesis 3. Both models demonstrate that state legislatures that permit open conference committee scopes are much more likely to go to conference. This effect is strongly significant and substantively robust even after controlling for other predictors of conferencing. To flesh out the substantive importance of open scope rules, Figure 6 plots model 2’s estimates to illustrate the average marginal effect of conference rules on the probability of a chamber conferencing. The predicted probability of a state legislature going to conference is more than 10 times greater with open scope conference rules than chambers which use limited scope rules (boosting the likelihood of conferencing from just under 2% to 20%). This finding is opposite of expectations, and suggests that legislatures are more willing to go to conference when conferees are unconstrained by bill contents. That said, both models also show that chambers that permit minority leaders appointing rights over conference delegations are less likely to form conference committees, providing evidence for Hypothesis 4.

Figure 6. Predicted probability of conference committee under varying conference scopes.
Concerning the additional covariates, a greater diversity of preferences inside majority parties and a legislature’s professionalism are meaningful predictors of when a chamber goes to conference. More heterogeneous preferences within majority parties corresponds to a decrease in the likelihood of going to conference. When parties diverge ideologically, larger coalitions within the chamber are often required to approve the conference report (Ryan Reference Ryan2014). These increased costs of coalition building likely dishearten the conference process for majority parties (Groseclose and Snyder Reference Gross1996; Ryan Reference Ryan2011). Moreover, majority parties seek to enact their agenda by pursuing partisan advantage while in conference, which is less likely when handling diverse preferences amongst rank-and-file members (Lazarus and Monroe Reference Lee2007).
In contrast, more professionalized chambers are more likely to go to conference. The least professionalized legislatures have a roughly 1.5% probability of going to conference; the most professionalized legislatures form conferences for roughly 25% of passed measures. Beyond additional time spent in session, there is a relationship between the professionalism of a legislature and the partisan makeup of legislators, whereby highly professionalized legislatures have legislators with stable partisan preferences that are more willing to reap benefits from post-passage bargaining (Fiorina 1999; Ryan Reference Ryan2014).
Discussion and Conclusions
My analysis reveals that a broad array of substantive, institutional, and partisan forces shape the chances that state legislative chambers go to conference to negotiate bicameral agreements. Most markedly, ideologically cohesive majority parties favor conferencing, frequently employing conferences to reconcile chamber differences on substantively salient legislation. Moreover, the rules of the game matter: Majority parties recognize that rules allowing the minority party to select its own appointees dilute majority party influence over the final shape of conference agreements. Thus, majority parties are less likely to go to conference in chambers that allocate such authority to the minority party, lest their party be forced to collaborate with the other party in resolving bicameral disagreements (Clark and Linzer Reference Clark and Linzer2015).
Yet, it remains puzzling as to why state chambers with open scope conference rules are more likely to form conference committees. Why would majority parties be more willing to cede authority to potentially rogue conferees who could hand the chamber policy losses? One possible explanation for the increased utilization of conference committees under open scope conditions is that majority leaders in these chambers use conferences as a tricameral process to create legislation, as opposed to reconciling differences between chambers. Partisan theories of distributive politics (e.g., Cox and McCubbins Reference Cox and McCubbins1993; Kiewiet and McCubbins Reference Klarner1991) suggest that the majority party controls chamber organization as well as setting the agenda. Since conference committee chairs are almost always members of the majority party, party leaders operating under open scope conditions ought to appoint party loyalist chairs to rewrite legislation to be in line with a majority of the majority’s preferences (Lazarus and Monroe Reference Lee2007).Footnote 33 If conference chairs can fully control conference proceedings, then the majority’s preferences should be enacted regardless of polarization levels.Footnote 34 This may be why states have remained steady in their usage of conference committees despite rising partisanship across state legislatures (Shor and McCarty Reference Sinclair2011).Footnote 35
Finally, my findings diverge from the congressional literature that focuses on conference committees as a monolithic vehicle for majority party influence (Cox and McCubbins Reference Cox and McCubbins2005; Lazarus and Monroe Reference Lee2007), yet they are concordant with the long literature in political science emphasizing the role of institutions in shaping legislative outcomes. Additionally, these are expected results given the importance of the conference committee process. Conferees make numerous substantive changes to bills, and the resulting compromise may be dissimilar from the original bill sent to conference. Therefore, majority parties likely turn to conference committees as a post-passage bargaining tool when relatively advantaged in the chamber. Ultimately, this article demonstrates that varying legislative configurations at the state level can substantially affect lawmaking, and is particularly relevant for explaining variation in policy making across state legislatures.
Data Availability Statement
Replication materials are available on SPPQ Dataverse at https://doi.org/10.15139/S3/4EHNZA (Emrich Reference Emrich2022).
Ackowledgments
I thank Sarah Binder, Eric Lawrence, and Christopher Warshaw for helpful comments and conversations. Any errors are my own.
Funding Statement
The author received no financial support for their research, authorship, and/or publication of this article.
Conflict of Interest
The author declared no potential conflicts of interest with respect to the research, authorship, and/or publication of this article.
Appendix
A.1. State Legislative Chamber Committee Rules
Table A.1. State conference committee rules

A.2. Open States Data Appendix
A considerable amount of data for this paper come from Open States, a nonprofit organization that leverages crowdsourcing and web scraping to compile data on legislators’ and legislatures’ activities for all 50 states, Washington, DC, and Puerto Rico. The code responsible for scraping bills and votes from Open States can be found on the Open States GitHub.
Broadly speaking, the Open States repository tracks bills, reviews upcoming legislation, and provides bill-level information on how state-level representatives are voting. For the purposes of this paper, I leverage Open States’ public domain bulk data. Specifically, I utilize Open States’ Legacy Comma-separated values (CSV) data which draw from the Open States API v1 which was last updated on November 3, 2018. The Legacy CSV files are a CSV transformation of the data available on Open States’ Legacy JSON archives. The Legacy CSV files can be found here.
Within the Legacy CSV files are several .csv folders for each of the 50 states: legislators.csv, legislator_roles.csv, committees.csv, bills.csv, bill_actions.csv, bill_sponsors.csv, bill_votes.csv, and bill_legislator_votes.csv. I leverage the bill_actions.csv to provide information on bill status in the legislative process. Each row within a bill_actions.csv provides an additional step in the legislative process for a bill. As such, bills and conference committees were uniquely identified by legislative session using the “bill_id” and “action” columns.
As a validation check for the accuracy of the number of bills passed in the Open States data, I compare bills passed between the Open States data and data from The Book of the States as provided by The Council of State Governments (The Council of State Governments Reference Tsebelis and Moneyn.d.). The Book of the States data can be found here. Aggregate data from The Book of the States were gathered from the “Bill and Resolution Introduction and Enactments” files (Tables 3.19 and 3.20, respectively.) Specifically, I tabulated the “Enactments/Adoptions” column of each respective The Book of the States entry. These data can be found here.
Due to the Open States API being updated prior to every state ending their 2018 legislative session, I compare the Open States and The Book of the States data between 2005 and 2017. Like with the Open States data, I use the availability of conference committee information to categorize The Book of the States data. Accordingly, the data collection for Kentucky began with its 2006 regular session. Data collection started for Louisiana, Maine, and Oregon in 2007, and for Florida, Massachusetts, Tennessee, and West Virginia in 2011.
Table A.2 demonstrates the annual count of passed, noncommemorative bills for Open States and The Book of the States, respectively. Both datasets capture roughly the same number of bills: 189,604 total for Open States, and 202,427 for The Book of the States, demonstrating the validity of the Open States data source. However, The Book of the States data have some discrepancies which are worthy of note to explain the differences between the two data sources. First, there are some instances where The Book of the States data drastically overcount the number of bills passed by a state in a given legislative session. Examples include New Mexico’s legislature during the 2014 regular session which reportedly passed 8,081 bills and Illinois’s legislature which passed 7,680 bills during its 2016 regular session. With respect to Illinois’s 2016 regular session, this large number may be attributable to The Book of the States not specifying when the session concluded. In contrast, the Open States data illustrate that New Mexico’s legislature passed 90 bills in its 2014 regular session and Illinois’s legislature passed 444 bills in its 2016 regular session. Second, there are a few state-years where The Book of the States does not have data. These include Tennessee’s 2014 regular session and Iowa’s 2016 regular session.
Table A.2. Passed, noncommemorative bills by year (2005–17)

A.3. Breakdown of Conference Committees by State
Table A.3. Conference committees by state (2005–18)

A.4. Breakdown of Conference Committee Bills by Year
Table A.4. Conference committees by year (2005–18)


Figure A.1. Predicted of conference committee bills for states (2005–18).
B.1. Table 2 Replication with Year Random Effects
Table B.1. Predictors of conference committee usage in state legislatures with year random effects

Note. Standard errors are given in parentheses.
B.2. Table 2 Replication with Broadened Budget Bill Classification
Appendix B.2 replicates Table 2’s findings with a broader classification of budget bills. Whereas Table 2 focuses on appropriations bills, Table B.2 uses a dummy variable equal to 1 if a passed bill was considered by a budget-related committee, and 0 otherwise. These data were collected from the Open States repository within their Legacy CSV files. Specifically, the “subjects” column within a state’s respective bills.csv file provides information on where a bill was considered. If a bill was heard by a fiscal or budget committee, it was coded as a within the new budget bill variable.
With this wider categorization, 18,807 of 202,261 passed bills are budget-related bills. The results of Table B.2’s models reflect the findings of Table 2 and further bolster Hypothesis 2: Budget bills are significantly more likely to go to conference than nonbudget bills.
Table B.2. Predictors of conference committee usage in state legislatures

Note. Standard errors are given in parentheses.
B.3. Unstandardized Results for Table 2
Table B.3. Unstandardized predictors of conference committee usage in state legislatures

Note. Standard errors are given in parentheses.
B.4. Predicting Likelihood of Conference Report Adoption
Table B.4. Predictors of conference report adoption in state legislatures

Note. Standard errors are given in parentheses.
Author Biography
Colin Emrich is a Lynde and Harry Bradley Foundation Post-Graduate Fellow in residence at George Washington University in Washington, DC. His research focuses on the forces that shape politics and policymaking in American legislatures.


 Open access