


Nomenclature
- CN
-
cetane number
- CL
-
chemiluminescence
- DCN
-
derived cetane number
- DP
-
dynamic pressure sensor
- DSLR
-
digital single-lens reflex
- FOV
-
field of view
- HOC
-
heat of combustion
- HRJ
-
hydrotreated renewable jet
- IQT
-
ignition quality test
- LBO
-
lean blowoff
- MFC
-
mass flow controller
- MW
-
molecular weight
- NJFCP
-
national jet fuels combustion program
-
probability density function
- PM
-
particulate matter
- PMT
-
photomultiplier tube
- RMS
-
root-mean-square
- SAF
-
sustainable aviation fuels
- SCR
-
sooty flame concentration ratio
- TC
-
thermocouples
Symbols
- Da
-
Damköhler number
- $I$
$I$
-
relative reactivity in the shear layer compared to the average total flame
- P
-
pressure
-
$p'$
-
pressure perturbation
-
$q'$
-
heat release rate fluctuation
- T
-
temperature
- t
-
time
- t p
-
period of oscillation
-
${\bf{X}}$
-
phase space vectors
-
${\theta _{p^{\prime}_{3} - q^{\prime}}}$
-
phase difference between the pressure perturbation near the V-gutter (
$p'_{3}$
) and the heat release rate fluctuation (
$q'$
) -
$\tau $
-
time lag
-
${\tau _c}$
-
chemical time scale
-
${\tau _H}$
-
time constant for high-temperature chemistry
-
${\tau _i}$
-
ignition delay time
-
${\tau _L}$
-
time constant for low-temperature chemistry
-
${\tau _M}$
-
time constant for moderate-temperature chemistry
-
${\tau _r}$
-
residence time scale
-
${\phi _{af}}$
-
global equivalence ratio at the afterburner


1.0 Introduction
The operation of airlines has been significantly affected by the considerable price fluctuations of jet fuel and the enforcement of stricter emission regulations in response to climate change. Consequently, in order to ensure a stable supply of jet fuel, reduce the impact of oil price volatility, and tackle environmental issues, sustainable aviation fuels (SAFs) are currently under development [Reference Colket, Heyne, Rumizen, Gupta, Edwards, Roquemore, Andac, Boehm, Lovett, Williams, Condevaux, Turner, Rizk, Tishkoff, Li, Moder, Friend and Sankaran1, Reference Heyne, Peiffer, Colket, Jardines, Shaw, Moder, Roquemore, Edwards, Li and Rumizen2]. The drop-in ready feature, which allows the SAFs to be used without modifications to engines, aircraft components, or infrastructure, requires extensive testing, leading to significant costs and certification time [Reference Heyne, Peiffer, Colket, Jardines, Shaw, Moder, Roquemore, Edwards, Li and Rumizen2]. The US-led National Jet Fuels Combustion Program (NJFCP) aimed to minimise and streamline this extensive testing procedure, focusing exclusively on the combustion operability aspects of these fuels, specifically lean blowoff (LBO) and ignition under cold start and altitude relight conditions [Reference Heyne, Peiffer, Colket, Jardines, Shaw, Moder, Roquemore, Edwards, Li and Rumizen2]. In other words, it is important to understand the relationship between the properties of SAFs and their combustion characteristics to safely replace existing aviation fuels.
Previous studies using the SAFs have been identifying the characteristics of exhaust emissions [Reference He, Podboy and Chang3], lean blowoff [Reference Corporan, Edwards, Stouffer, DeWitt, West, Klingshirn and Bruening4], ignition characteristics [Reference Allen, Valco, Toulson, Edwards and Lee5, Reference Kang, Kim, Kalaskar, Violi and Boehman6], etc. Zheng et al. [Reference Zheng, Cronly, Ubogu, Ahmed, Zhang and Khandelwal7] analysed the effects of the characteristics of NJFCP test fuels on the particulate matter (PM) number, LBO, and sooty flame concentration ratio (SCR), and showed that derived cetane number (DCN), aromatic content, and hydrogen content are the dominant factors for the LBO, PM number, and SCR, respectively.
Most of the studies [Reference Casselberry, Corporan and DeWitt8–Reference Alsulami, Lucas, Hageman, Knadler, Quinlan and Windom10] on the LBO characteristics of SAFs showed a strong correlation between DCN and LBO. The cetane number (CN) indicates the ignition quality [Reference Hosseinpour, Aghbashlo, Tabatabaei and Khalife11], where fuels with higher values of CN ignite more readily than fuels with lower CN values [Reference Westbrook, Pitz, Mehl and Curran12]. The cetane number of fuel blends can be characterised using DCN [Reference Zheng, Li, Liu, Zhang, Zhong and Yao13]. In simpler terms, a higher DCN indicates faster ignition and increases auto-ignition reactivity [Reference Zheng, Li, Liu, Zhang, Zhong and Yao13]. Blowoff represents the phenomenon that the flame cannot be stabilised in high velocity reactant streams [Reference Shanbhogue, Husain and Lieuwen14]. LBO has been a big problem since the gas turbine was used as the propulsion system of aircraft and power plant. Won et al. [Reference Won, Rock, Lim, Nates, Carpenter, Emerson, Lieuwen, Edwards and Dryer15] explored the changes in the LBO according to the air inlet temperature. They [Reference Won, Rock, Lim, Nates, Carpenter, Emerson, Lieuwen, Edwards and Dryer15] showed that the DCN values of initial 20% distillation cuts and the chemical properties of the entire fuel sample are the most relevant to the LBO under the low air inlet temperature and under the high air inlet temperature, respectively.
In contrast to previous studies that focused on the characteristics of SAF using a single combustor, this research introduces a novel approach by designing and fabricating a two-staged combustor. The objective of NJFCP is to assess the applicability of alternative jet fuels for commercial and military uses [Reference Heyne, Colket, Gupta, Jardines, Moder, Edwards, Roquemore, Li and Rumizen16]. Still, previous studies primarily assessed the applicability of SAF in civil aircraft, and did not focus on military-specific aircraft, such as afterburning engines. Consequently, understanding the flame characteristics of SAF in the afterburner becomes crucial. The afterburner is an additional engine component extensively employed in military aircraft engines, intended to augment aircraft thrust, particularly during supersonic and hypersonic flights, take-off, and combat scenarios [Reference Lovett, Brogan, Philippona, Kiel and Thompson17]. The afterburner is composed of an extended exhaust section with additional fuel injectors. The afterburner can burn additional fuel with the products from the turbine due to the presence of unconsumed oxygen in the upstream section of the jet engine [Reference Zukoski18]. When the afterburner is turned on, fuel is injected and the igniter is fired. As a result, the combustion process significantly increases the temperature of the afterburner outlet, which leads to a rapid increase in the engine net thrust [Reference Zukoski18].
The afterburner typically employs a bluff body as a flame holder to stabilise the flame and the V-gutter type is mainly used [Reference Nakanishi, Velie and Bryant19]. The V-gutter stabilises the flame by forming a recirculation zone at the downstream region, which lowers the flow speed. Many studies [Reference Chaudhuri, Kostka, Renfro and Cetegen20–Reference Plee and Mellor27] examined the flame stabilisation mechanism using a bluff body for various fuels including the SAFs. Chaudhuri et al. [Reference Chaudhuri, Kostka, Renfro and Cetegen20] showed that the local flame extinction occurs when the high local stretch rates, which is caused by the overlap between the flame front and the shear layer vortices, exceeds the extinction stretch rates. Nair and Lieuwen [Reference Nair and Lieuwen23] investigated the dynamics of a near-blowoff and bluff-body stabilised flame and found that these flames exhibit enhanced unsteadiness in two distinct stages before blowoff: (1) the holes in the flame sheet due to high instantaneous stretch rate and (2) the large-scale alterations of the wake dynamics, violent flapping of the flame front, and even larger straining of the flame. Tuttle et al. [Reference Tuttle, Chaudhuri, Kostka, Kopp-Vaughan, Jensen, Cetegen and Renfro24] investigated the flame holding and blowoff characteristics of bluff-body stabilised turbulent propane flames in vitiated premixed flows using in-tandem combustor. As the equivalence ratio decreased, they observed a higher occurrence of local extinctions along the flames interacting with shear layers surrounding the bluff body recirculation zone [Reference Tuttle, Chaudhuri, Kostka, Kopp-Vaughan, Jensen, Cetegen and Renfro24]. Furthermore, they revealed that the lean blowoff stability boundary for vitiated flows occurred at lower equivalence ratios compared to those in unvitiated flows with the same Reynolds number [Reference Tuttle, Chaudhuri, Kostka, Kopp-Vaughan, Jensen, Cetegen and Renfro24]. Pathania et al. [Reference Pathania, Skiba, Ciardiello and Mastorakos25] investigated the LBO behaviour of unconfined lean premixed bluff-body stabilised flames with various fuels including A-2 and C-1. They experimentally showed that A-2 and C-1 flames have higher Le compared to methane flames, resulting in lower extinction strain rates, and thus blowoff occurs at higher equivalence ratios for the same bulk velocity [Reference Pathania, Skiba, Ciardiello and Mastorakos25]. Mellor et al. [Reference Leonard and Mellor26, Reference Plee and Mellor27] showed that the LBO occurs when the residence time of the fresh mixture in the shear layer is less than the chemical time scale. Therefore, LBO occurs when the residence time of the fuel in the shear layer is smaller than the sum of evaporation time and ignition delay time [Reference Leonard and Mellor26–Reference Wang, Hu, Zhao and Xu28].
Equation (1) shows the Damköhler number (Da) which is a dimensionless number representing the ratio of residence time scale to the chemical time scale [Reference Zhang, Hu and Zhou29].
 \begin{align}{\rm{Da}} = \frac{{residence{\rm{\;}}time{\rm{\;}}scale}}{{chemical{\rm{\;}}time{\rm{\;}}scale}} = \frac{{{\tau _r}}}{{{\tau _c}}}\end{align}
Husain [Reference Husain30] have proposed a residence time scale for bluff body flow as follows.
 \begin{align}{\tau _r} = \frac{D}{U}\end{align}
where D is a bluff body diameter and U is a characteristic velocity (lip velocity).
The ignition delay time ( ${\tau _i}$
) can be used as the chemical time scale [Reference Knaus, Magari, Hill, Phillips and Kiel31]. The ignition delay time can be measured as the time between the start of fuel injection and the start of significant heat release by ignition quality test (IQT) [Reference Kalghatgi32]. Gowdagiri et al. [Reference Gowdagiri, Wang and Oehlschlaeger33] identified that ignition delay time decreases as increasing the DCN. Also, many studies [Reference Gowdagiri, Wang and Oehlschlaeger33–Reference De Toni, Werler, Hartmann, Cancino, Schießl, Fikri, Schulz, Oliveira, Oliveira and Rocha37] have tried to figure out the correlation of ignition delay time with pressure, temperature, equivalence ratio, and DCN using three-Arrhenius model as follows.
${\tau _i}$
) can be used as the chemical time scale [Reference Knaus, Magari, Hill, Phillips and Kiel31]. The ignition delay time can be measured as the time between the start of fuel injection and the start of significant heat release by ignition quality test (IQT) [Reference Kalghatgi32]. Gowdagiri et al. [Reference Gowdagiri, Wang and Oehlschlaeger33] identified that ignition delay time decreases as increasing the DCN. Also, many studies [Reference Gowdagiri, Wang and Oehlschlaeger33–Reference De Toni, Werler, Hartmann, Cancino, Schießl, Fikri, Schulz, Oliveira, Oliveira and Rocha37] have tried to figure out the correlation of ignition delay time with pressure, temperature, equivalence ratio, and DCN using three-Arrhenius model as follows.
 \begin{align}\frac{1}{{{\tau _i}}} = \frac{1}{{{\tau _L} + {\tau _M}}} + \frac{1}{{{\tau _H}}}\end{align}
 \begin{align}{\tau _j} = {A_j}{\left( {\frac{P}{{{P_{ref}}}}} \right)^{{\alpha _j}}}{\phi ^{{\beta _j}}}{\left( {\frac{{{\rm{DCN}}}}{{{\rm{DC}}{{\rm{N}}_{ref}}}}} \right)^{{\gamma _j}}}exp\left( {\frac{{{T_{act,j}}}}{T}} \right){\rm{\;}}for{\rm{\;}}j = L,{\rm{\;}}M,{\rm{\;}}H\end{align}
where ${\tau _j}$
is the time constant,
${\tau _j}$
is the time constant, ${P_{ref}}$
is a reference pressure, and
${P_{ref}}$
is a reference pressure, and ${\rm{DC}}{{\rm{N}}_{ref}}$
is a reference DCN.
${\rm{DC}}{{\rm{N}}_{ref}}$
is a reference DCN. ${A_j}$
,
${A_j}$
, ${\alpha _j}$
,
${\alpha _j}$
, ${\beta _j}$
,
${\beta _j}$
, ${\gamma _j}$
, and
${\gamma _j}$
, and ${T_{act,\;j}}$
are constant parameters chosen for each temperature range (subscripts L, M, and H represents low-, moderate-, and high-temperature, respectively) to fit experimental data. Here, each constant is varied depending on the fuel, but
${T_{act,\;j}}$
are constant parameters chosen for each temperature range (subscripts L, M, and H represents low-, moderate-, and high-temperature, respectively) to fit experimental data. Here, each constant is varied depending on the fuel, but ${\gamma _j}$
is negative or 0 for all targeted fuels. Therefore, the ignition delay time tends to decrease as DCN increases.
${\gamma _j}$
is negative or 0 for all targeted fuels. Therefore, the ignition delay time tends to decrease as DCN increases.
Wang et al. [Reference Wang, Hu, Fang, Zhao and Chen38] showed that the global Da acts as an indicator of LBO. In other words, they found that LBO occurs if the global Da is less than unity. Furthermore, the previous studies [Reference Wang, Hu, Zhao and Xu28, Reference Zhang, Chang, Ma, Wang and Bao39] confirmed that the combustion becomes more stable as the global Da increases.
In addition, since the turbine is installed after the combustor in a gas turbine engine, there are many efforts to prevent the failure caused by high temperature damage to turbine blades [Reference Carter40]. In particular, since the temperature of the combustion products is high, the dilution air is supplied to the downstream section of the main combustor to lower the temperature of the products [Reference Carter40]. Furthermore, since the afterburner is installed at the downstream end of the turbine, the flashback at the afterburner can cause high thermal damage to the turbine blades, so it is very important to understand the flashback characteristics of the bluff body flame. Jeong et al. [Reference Jeong, Bae, Kim, Yoon, Joo and Yoon21] examined the characteristics of the flashback caused by the combustion instability and showed that the strong turbulence intensity due to the combustion instability increased the flashback distance.
As the replacement of jet fuel by SAF is required for military aircraft as well, it is important to understand the combustion characteristics of the SAF at the afterburner using a V-gutter, but existing research on this is not sufficient. Furthermore, to capture the characteristics of the afterburner, there should be the main combustor operated before the afterburner and the combustion products from the main combustor should be supplied to the afterburner as reactants. This is quite complicated to realise experimentally. As a result, the research on the two-staged combustor arranged in-tandem is relatively rare [Reference Tuttle, Chaudhuri, Kostka, Kopp-Vaughan, Jensen, Cetegen and Renfro24, Reference Paxton, Fugger, Tomlin and Caswell41]. Recently, as dry air or vitiated air was supplied in the first stage, combustion characteristics at the V-gutter in the second stage were studied using NJFCP test fuels [Reference Paxton, Fugger, Tomlin and Caswell41]. However, the combustion condition at the first stage was not clear and also the flashback was not covered in the study.
Furthermore, combustion instability can lead to significant amplification of pressure perturbations inside the combustor, potentially causing damage to the engine or even explosions. Combustion instability is a phenomenon caused by the nonlinearity of combustion systems. Therefore, it is necessary to understand the nonlinear characteristics to identify the combustion instability characteristics. In many studies [Reference Marwan, Carmenromano, Thiel and Kurths42, Reference Gotoda, Nikimoto, Miyano and Tachibana43], the phase-space of the pressure inside the combustion chamber has been used to identify the nonlinear dynamic characteristics and the presence of limit cycles from combustion instability. The phase-space can be represented by the time-delayed coordinates of the time series pressure perturbation as Equation (5).
 \begin{align}{\bf{X}}( {{t_i}} ) = ( {p'( {{t_i}} ),{\rm{\;}}p'( {{t_i} - \tau } ),{\rm{\;}}p'( {{t_i} - 2\tau } ),{\rm{\;}} \cdots ,{\rm{\;}}p'( {{t_i} - ( {D - 1} )\tau } )} )\end{align}
where i =0, 1, $ \cdots $
, n (n is the number of the time series pressure data),
$ \cdots $
, n (n is the number of the time series pressure data), ${\bf{X}}( {{t_i}} )$
is the phase space vectors,
${\bf{X}}( {{t_i}} )$
is the phase space vectors, $p'( {{t_i}} )$
is the pressure perturbation at time
$p'( {{t_i}} )$
is the pressure perturbation at time ${t_i}$
, D is the dimension of the phase space, and
${t_i}$
, D is the dimension of the phase space, and $\tau $
is the time lag [Reference Gotoda, Nikimoto, Miyano and Tachibana43]. The time lag can be determined as the first zero-crossing when using the autocorrelation function, else, the time lag is chosen as the first minimum of the entropy when using the mutual information [Reference Gotoda, Nikimoto, Miyano and Tachibana43]. This study utilises the autocorrelation function, so the time lag is determined as the first zero-crossing.
$\tau $
is the time lag [Reference Gotoda, Nikimoto, Miyano and Tachibana43]. The time lag can be determined as the first zero-crossing when using the autocorrelation function, else, the time lag is chosen as the first minimum of the entropy when using the mutual information [Reference Gotoda, Nikimoto, Miyano and Tachibana43]. This study utilises the autocorrelation function, so the time lag is determined as the first zero-crossing.
The main purpose of this study is to investigate the combustion characteristics of the test SAFs including the LBO, flashback, and combustion instability at the in-tandem combustor with the afterburner, which can help accelerate the use of SAF. Specifically, this study examines the combustion characteristics at the afterburner, which receives the combustion products as the reactants, using the in-tandem combustor and investigates the flashback characteristics of test SAFs.
The remainder of this paper is organised as follows. We first describe the experimental method and test fuel properties. Next, we present the LBO and flashback characteristics, effect of shear layer reactivity on flame characteristics, and combustion instability characteristics. Finally, conclusions, limitations, and future directions for the work are provided.
2.0 Experiment methods
2.1 Two-staged in-tandem combustor
In this study, a scaled-down experimental test rig is designed and used to capture the main characteristics of the afterburner by feeding the combustion products from the main combustor to the afterburner. Figure 1 shows an in-tandem combustor with a main combustor and an afterburner used in this study. As shown in Fig. 1(a), the horizontal main combustor has a circular cross-section with a radius of 51.15 mm. The length of the main combustor is 523 mm, and the main combustor is connected to the afterburner by a 90 degree elbow. The water jacket around the main combustor prevents the thermal damage to the main combustor. Air and methane are used as the oxidiser and fuel, respectively, for the main combustor. The air and methane are mixed as jets-in-crossflow and the mixture passes through an axial swirler before entering the main combustor. The swirler has a diameter of 35 mm and has 10 swirl vanes with a swirl angle of 30 degrees. At the downstream end of the main combustor, dilution air is introduced to lower the temperature of the combustion products from the main combustor and to supply additional oxidiser for the afterburner. One dynamic pressure sensor (DP1) and one temperature sensor (TC1) are installed at the upstream end of the main combustor.

Figure 1. Schematic of the in-tandem combustor: (a) the main combustor with swirler and (b) the afterburner with V-gutter.
Figure 1(b) shows the afterburner which is installed on the 90 degree elbow vertically. The afterburner is composed of a flow strainer and three modules, and the rectangular cross-section of the afterburner is 45 × 70 mm2. The flow strainer is a plate with 135 holes with a diameter of 2.54 mm and is used to reduce the flow inhomogeneity caused by the 90 degree elbow. The afterburner uses the combustion products from the main combustor and dilution air as reactants and the liquid test fuel is additionally introduced at the upstream section of the afterburner as reactant. The length of the afterburner is about 1,400 mm and the downstream end of the afterburner is set as an acoustic open boundary condition. The liquid test fuel injector at the first module of the afterburner consists of two holes with 6.5 mm apart on the top of the injector and the orifice diameter is 0.32 mm. Both holes are oriented perpendicular to the cross-flow direction, so the liquid test fuel and the products from the main combustor are mixed as jets-in-crossflow. The flame holder at the second module is a V-gutter type with a vertex angle of 60° and a side length of 28 mm. The flame holder’s blockage ratio (V-gutter width/test section width) is 40%. The flame holder is placed 413 mm downstream after the liquid test fuel injector. Hydrogen torch igniters are mounted upstream end of the main combustor and before the flame holder to ignite the flames, respectively. Two quartz windows are employed on each sidewall on the two modules for optical access for the test fuel injector and the flame holder, respectively.
2.2 Experimental setup
Figure 2 shows the schematics of the experimental setup for this study. The air is provided from the compressor (SULLAIR, 4509AC) and controlled by a mass flow controller (MFC) (Brooks, SLA5853S, uncertainty = ± 0.6% of set point). The methane and hydrogen are provided from each bottle of high-purity feedstock gases (CH4 purity > 99.99 mol% and H2 purity > 99.999 mol%) and controlled by MFC (Brooks, SLA5851S, uncertainty = ± 0.6% of set point). Air, methane, and hydrogen are supplied to the combustor at room temperature (290 ± 5 K). The liquid test fuel is provided from the N2 pressurised tank and also controlled by MFC (Alicat, KC-1K, uncertainty = ± 0.2% of set point).

Figure 2. Schematic of the experimental setup.
2.3 Liquid test fuel characteristics
The research using NJFCP test fuels focuses on the characteristics of two types of test fuels: category A and C. Category A fuels represent conventional petroleum-derived fuels with typical properties (viscosity, flash point, aromatic content, etc.) [Reference Edwards44]. On the other hand, category C fuels are experimental fuels specifically designed to explore the extreme boundaries of jet fuel composition and properties [Reference Edwards44]. Due to their distinct physical and chemical properties, each test fuel exhibits variations in combustion characteristics such as lean blowoff, flashback, and combustion instability.
This study investigates the combustion characteristics of a total of five NJFCP test fuels (Jet-A, A-2, C-1, C-5, and C-9) and a JP-8/HRJ. A total of six fuel samples were prepared by the National Research Council (NRC). Table 1 shows the characteristics of each test fuel. Each test fuel has similar heat of combustion, but with a DCN difference of up to 3.7 times. Figures 3(a) and (b) show the properties of category A fuels and the distillation curves for category C fuels, respectively. A-2 is a test fuel with the average value of Jet-A characteristics. C-1 has a very low cetane number. C-5 has a flat boiling point. C-9 is a mixture of 80% hydrotreated renewable jet (HRJ) biofuel and 20% dodecane, and JP-8/HRJ is a mixture of 50% HRJ and 50% Jet-8.
Table 1. Characteristics of test fuels used in this study [Reference Colket, Heyne, Rumizen, Gupta, Edwards, Roquemore, Andac, Boehm, Lovett, Williams, Condevaux, Turner, Rizk, Tishkoff, Li, Moder, Friend and Sankaran1, Reference Kang, Kim, Kalaskar, Violi and Boehman6, Reference Yang, Stachler and Heyne45]


Figure 3. (a) Test fuel properties of category A fuels and (b) distillation curves for category C fuels [Reference Colket, Heyne, Rumizen, Gupta, Edwards, Roquemore, Andac, Boehm, Lovett, Williams, Condevaux, Turner, Rizk, Tishkoff, Li, Moder, Friend and Sankaran1].
2.4 Experimental conditions
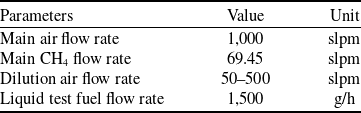
Table 2 shows the detailed experimental conditions of this study. The flow rate of air and methane used at the main combustor are kept constant at 1,000 and 69.45 slpm, respectively, so that the equivalence ratio is kept at 0.66. The test SAF supplied to the afterburner is kept at 1,500 g/h, and the equivalence ratio at the second stage burner is controlled as the dilution air flow rate is changed from 50 to 500 slpm. The inlet pressures of the air, methane, SAF, and dilution air are ambient condition. The inlet temperature of the afterburner is approximately 1,100 K, and this varies depending on the amount of dilution air.
Table 2. Experimental test conditions
2.5 Measurement and diagnostics
Three dynamic pressure sensors (DPs) (PCB, 112A22, uncertainty = ± 1% of full scale) and three thermocouples (TCs, K-type) are used to measure the pressure perturbation and temperatures, respectively, at the main combustor, after the flow strainer, and at the flame holder. The dynamic pressure sensors and thermocouples are operated at 10 kHz and 10 Hz rates, respectively. To prevent thermal damage to the TCs, temperatures near the wall were measured within the temperature range suitable for K-type TCs.
The global OH*-chemiluminescence (CL) intensity near the flame holder is measured by a photomultiplier tube (PMT) (Hamamatsu, H11526-20-NF) at 10 kHz rates. CH*-CL images are captured at 10 Hz with an intensified charged-coupled device (ICCD) camera (Princeton Instruments, PI-MAX) using a UV-enhanced lens (LaVision, f = 100 mm, f/2.8) with a 430 nm bandpass filter. Direct images are obtained using a digital single-lens reflex (DSLR) camera (Nikon, D750). The fields of view (FOVs) of the CH*-CL and direct images are 35 mm × 175 mm and 35 mm × 720 mm, respectively, as denoted in Fig. 1.
3.0 Results and discussion
3.1 Lean blowoff (LBO) and flashback characteristics
In the following, we present and discuss comparative results of the six sample fuels. The characteristics of LBO and flashback are identified by varying the global equivalence ratio at the afterburner ( ${\phi _{af}}$
), while keeping the condition for the main combustor the same. In Fig. 4, the operational limits of each test fuel are presented in the order of its DCN. It clearly shows the implications regarding the significance of DCN on the LBO and flashback characteristics.
${\phi _{af}}$
), while keeping the condition for the main combustor the same. In Fig. 4, the operational limits of each test fuel are presented in the order of its DCN. It clearly shows the implications regarding the significance of DCN on the LBO and flashback characteristics.

Figure 4. Operational limits of each test fuel.
Figure 5 shows the LBO equivalence ratio for each test fuel. Blowoff occurs when the flow residence time scale is less than the chemical time scale. Since the flame speed decreases and the flow speed increases as decreasing ${\phi _{af}}$
(by increasing the dilution air flow rate) in this study, the possibility of blowoff increases as decreasing
${\phi _{af}}$
(by increasing the dilution air flow rate) in this study, the possibility of blowoff increases as decreasing ${\phi _{af}}$
. The LBO occurs at
${\phi _{af}}$
. The LBO occurs at ${\phi _{af}}$
of about 0.42 for the C-1 with the lowest DCN in this study, but the LBO equivalence ratio decreases for the test fuel with higher DCN and LBO occurs at
${\phi _{af}}$
of about 0.42 for the C-1 with the lowest DCN in this study, but the LBO equivalence ratio decreases for the test fuel with higher DCN and LBO occurs at ${\phi _{af}}$
of about 0.3 for the C-9 with the highest DCN in this study.
${\phi _{af}}$
of about 0.3 for the C-9 with the highest DCN in this study.

Figure 5. ${\phi _{af}}$
at the lean blowoff (LBO) for each test fuel.
${\phi _{af}}$
at the lean blowoff (LBO) for each test fuel.
The DCN is a chemical property of fuels [Reference Won, Rock, Lim, Nates, Carpenter, Emerson, Lieuwen, Edwards and Dryer15] and the DCN indicates the chemical reactivity potential [Reference Won, Veloo, Dooley, Santner, Haas, Ju and Dryer46, Reference Won, Haas, Dooley, Edwards and Dryer47]. Therefore, a small DCN means a high chemical time scale [Reference Gowdagiri, Wang and Oehlschlaeger33] and a low Da under the same residence time scale according to Equation (1). According to the previous studies [Reference Gowdagiri, Wang and Oehlschlaeger33, Reference Wang and Oehlschlaeger34], the chemical time scale is lower for higher DCN fuel. Also, in previous studies [Reference Kalghatgi32, 48], the relational expression between the ignition delay time ( ${\tau _i}$
) of diesel fuel and DCN was identified within the range of ignition delay time of 3.1–6.5 ms, which is shown in Equation (6).
${\tau _i}$
) of diesel fuel and DCN was identified within the range of ignition delay time of 3.1–6.5 ms, which is shown in Equation (6).
 \begin{align}DCN = 83.99{( {{\tau _i} - 1.512} )^{ - 0.658}} + 3.547\end{align}
Since Equation (6) was derived for diesel fuels comprising ASTM National Exchange Group (NEG) check fuels, heptamethylnonane, cetane, and an in-house check fuel [48] at 2.137 MPa and 545 °C, it is difficult to apply it directly to our cases, but it can be seen that ignition delay time is closely related to DCN. However, research on the ignition time for NJFCP test fuels is not sufficient yet.
Since the total flow rate is kept same regardless of the test fuel at the same ${\phi _{af}}$
, there will be almost no change in the residence time as shown in Equation (2). Therefore, in our case, Da number will increase with the increase of DCN as chemical time scale decreases (ignition delay time decreases) and residence time is almost constant.
${\phi _{af}}$
, there will be almost no change in the residence time as shown in Equation (2). Therefore, in our case, Da number will increase with the increase of DCN as chemical time scale decreases (ignition delay time decreases) and residence time is almost constant.
In other words, test fuels with a small DCN are more easily blown-off. As shown in Fig. 5, the LBO equivalence ratio decreases as the DCN increases since the flame can be sustained even at a faster flow speed due to a small chemical time scale, which is consistent with the results of previous studies.
Figure 6 shows ${\phi _{{\rm{af}}}}$
when flashback occurs for each test fuel. Flashback occurs when the flame speed is faster than the flow speed. In this study, the flashback propensity increases as
${\phi _{{\rm{af}}}}$
when flashback occurs for each test fuel. Flashback occurs when the flame speed is faster than the flow speed. In this study, the flashback propensity increases as ${\phi _{{\rm{af}}}}$
increases by decreasing the dilution air flow rate since the flame speed increases and the flow speed decreases. Here, for C-9 with the highest DCN in this study, flashback occurs at
${\phi _{{\rm{af}}}}$
increases by decreasing the dilution air flow rate since the flame speed increases and the flow speed decreases. Here, for C-9 with the highest DCN in this study, flashback occurs at ${\phi _{{\rm{af}}}}$
of about 0.48. However, for test fuels with lower DCN, flashback occurs at a higher
${\phi _{{\rm{af}}}}$
of about 0.48. However, for test fuels with lower DCN, flashback occurs at a higher ${\phi _{{\rm{af}}}}$
. This indicates that flashback has a strong correlation with DCN in a similar way to blowoff, which has not been discussed in previous studies.
${\phi _{{\rm{af}}}}$
. This indicates that flashback has a strong correlation with DCN in a similar way to blowoff, which has not been discussed in previous studies.

Figure 6. ${\phi _{af}}$
at the onset of the flashback for each test fuel.
${\phi _{af}}$
at the onset of the flashback for each test fuel.
Behind the V-gutter, the flow speed is low owing to the recirculation zone, resulting in high Da and stable flame. However, for flashback to occur, flames need to propagate toward the upstream direction of V-gutter, where the flow speed is fast. Therefore, flow time scale becomes smaller, so Da becomes smaller, resulting in a high possibility to be extinguished. Since the fuel with a high DCN has a small chemical time scale, even if the flow time scale becomes smaller, the flame can be sustained and flashback can occur. Therefore, the flashback of C-9 flame with the highest DCN in this study occurs at a faster flow speed and the flashback of test fuels with lower DCN occurs at a lower flow speed. However, for the flames by the C-1 and C-5 test fuels with even smaller DCNs, blowoff occurs instead of flashback. This will be discussed later.
3.2 Effect of shear layer reactivity on flame characteristics
The flame at the afterburner in this study is anchored to the V-gutter which acts as a flame holder. According to the previous study [Reference Shanbhogue, Husain and Lieuwen14, Reference Chaudhuri, Kostka, Renfro and Cetegen20, Reference Chaudhuri, Kostka, Tuttle, Renfro and Cetegen49, Reference Fan, Wan, Liu, Pi, Yao and Liu50], the shear layer at the V-gutter tip has a strong influence on the stability and characteristics for the bluff body flame. Despite the ongoing debate surrounding the efficacy of CH* as a reliable indicator for accurately assessing the local heat release rate or reactivity [Reference Hossain and Nakamura51, Reference Sardeshmukh, Bedard and Anderson52], it remains a good marker commonly utilised in numerous studies [Reference Sardeshmukh, Bedard and Anderson52, Reference Yan, Gong, Guo, Yu and Wang53]. Consequently, this study also incorporated CH* as an indicator to evaluate shear layer reactivity. To examine the reactivity of the shear layer, the ratio of image intensity inside the red box shown in Fig. 7 to that of the averaged total flame is calculated as shown in Equation (7).
 \begin{align}I = \frac{{intensity{\rm{\;}}of{\rm{\;}}red{\rm{\;}}box}}{{average{\rm{\;}}intensity{\rm{\;}}of{\rm{\;}}flame}}\end{align} $I$
represents the relative reactivity in the shear layer compared to the average total flame. Therefore, a high
$I$
represents the relative reactivity in the shear layer compared to the average total flame. Therefore, a high $I$
corresponds to a case where the flame is concentrated in the shear layer region and is strongly anchored to the V-gutter. Here, since the
$I$
corresponds to a case where the flame is concentrated in the shear layer region and is strongly anchored to the V-gutter. Here, since the $I$
is calculated using both CH*-CL and direct images because of the FOV limitation and lack of CH*-CL data due to operational constraints of the experimental setup and test fuels, the
$I$
is calculated using both CH*-CL and direct images because of the FOV limitation and lack of CH*-CL data due to operational constraints of the experimental setup and test fuels, the $I$
is standardised by the
$I$
is standardised by the $I$
at
$I$
at ${\phi _{{\rm{af}}}}$
of 0.5 to compare the results from both of them.
${\phi _{{\rm{af}}}}$
of 0.5 to compare the results from both of them.

Figure 7. CH*-CL image (upper) and direct image (lower) of A-2 under ${\phi _{af}}$
= 0.6.
${\phi _{af}}$
= 0.6.
Figure 8 shows the shear layer reactivity standardised by the $I$
at
$I$
at ${\phi _{{\rm{af}}}}$
of 0.5 (
${\phi _{{\rm{af}}}}$
of 0.5 ( $I/{I_{{\phi _{{\rm{af}}}} = 0.5}}$
). As shown in Fig. 8, it shows a trend that the value of
$I/{I_{{\phi _{{\rm{af}}}} = 0.5}}$
). As shown in Fig. 8, it shows a trend that the value of $I/{I_{{\phi _{{\rm{af}}}} = 0.5}}$
decreases as
$I/{I_{{\phi _{{\rm{af}}}} = 0.5}}$
decreases as ${\phi _{{\rm{af}}}}$
decreases when the equivalence ratio is below a certain specific value to each fuel, indicating that the flame anchoring at the V-gutter is weakened. In other words, as the combustion condition approaches to a leaner condition by decreasing
${\phi _{{\rm{af}}}}$
decreases when the equivalence ratio is below a certain specific value to each fuel, indicating that the flame anchoring at the V-gutter is weakened. In other words, as the combustion condition approaches to a leaner condition by decreasing ${\phi _{{\rm{af}}}}$
, the flame speed decreases and the flow speed increases, resulting in a decrease in Da. Therefore, the flame anchoring to the V-gutter is weakened, eventually causing blowoff.
${\phi _{{\rm{af}}}}$
, the flame speed decreases and the flow speed increases, resulting in a decrease in Da. Therefore, the flame anchoring to the V-gutter is weakened, eventually causing blowoff.

Figure 8. Relative shear layer reactivity standardised using ${I_{{\phi _{af}} = 0.5}}$
of (a) Jet-A, (b) A-2, (c) C-1, (d) C-5, (e) C-9, and (f) JP-8/HRJ.
${I_{{\phi _{af}} = 0.5}}$
of (a) Jet-A, (b) A-2, (c) C-1, (d) C-5, (e) C-9, and (f) JP-8/HRJ.
Figure 9 shows the change in the average flame shape as decreasing the ${\phi _{{\rm{af}}}}$
for the A-2 flame. The upper side of Fig. 9 shows the CH*-CL image and the bottom side of Fig. 9 shows the flame edge obtained through Sobel edge detection of the upper side image. It can be seen that the average flame front is gradually pushed downstream as the
${\phi _{{\rm{af}}}}$
for the A-2 flame. The upper side of Fig. 9 shows the CH*-CL image and the bottom side of Fig. 9 shows the flame edge obtained through Sobel edge detection of the upper side image. It can be seen that the average flame front is gradually pushed downstream as the ${\phi _{{\rm{af}}}}$
decreases. In other words, as the
${\phi _{{\rm{af}}}}$
decreases. In other words, as the ${\phi _{{\rm{af}}}}$
decreases, the
${\phi _{{\rm{af}}}}$
decreases, the $I/{I_{{\phi _{{\rm{af}}}} = 0.5}}$
decreases and the average flame front is also pushed downstream, so when the
$I/{I_{{\phi _{{\rm{af}}}} = 0.5}}$
decreases and the average flame front is also pushed downstream, so when the ${\phi _{{\rm{af}}}}$
becomes lower, it can be seen that the flame blowoff occurs by detaching from the V-gutter.
${\phi _{{\rm{af}}}}$
becomes lower, it can be seen that the flame blowoff occurs by detaching from the V-gutter.

Figure 9. The changes in averaged A-2 fueled flame shape according to the global equivalence ratio at the afterburner: (a) ${\phi _{af}}$
= 0.47, (b)
${\phi _{af}}$
= 0.47, (b) ${\phi _{af}}$
= 0.41, and (c)
${\phi _{af}}$
= 0.41, and (c) ${\phi _{af}}$
= 0.36.
${\phi _{af}}$
= 0.36.
In contrast, as the ${\phi _{{\rm{af}}}}$
increases, Da increases and the flame is better anchored to the V-gutter, increasing the shear layer reactivity. However, the shear layer reactivity of Jet-A, A-2, C-9, and JP-8/HRJ flames tends to decrease after a certain
${\phi _{{\rm{af}}}}$
increases, Da increases and the flame is better anchored to the V-gutter, increasing the shear layer reactivity. However, the shear layer reactivity of Jet-A, A-2, C-9, and JP-8/HRJ flames tends to decrease after a certain ${\phi _{{\rm{af}}}}$
due to the occurrence of flashback as shown in Fig. 8. When flashback happens, the reactivity of the shear layer is weakened because the reactants are already reacted before reaching the shear layer. Since flashback does not occur in C-1 and C-5 flames, the shear layer reactivity does not decrease as the
${\phi _{{\rm{af}}}}$
due to the occurrence of flashback as shown in Fig. 8. When flashback happens, the reactivity of the shear layer is weakened because the reactants are already reacted before reaching the shear layer. Since flashback does not occur in C-1 and C-5 flames, the shear layer reactivity does not decrease as the ${\phi _{{\rm{af}}}}$
increases. Figure 10 shows the change in the average flame shape as increasing the
${\phi _{{\rm{af}}}}$
increases. Figure 10 shows the change in the average flame shape as increasing the ${\phi _{{\rm{af}}}}$
for the A-2 flame. As in Fig. 9, the upper side and bottom side of Fig. 10 show the CH*-CL image and the edge of the flame, respectively. As the
${\phi _{{\rm{af}}}}$
for the A-2 flame. As in Fig. 9, the upper side and bottom side of Fig. 10 show the CH*-CL image and the edge of the flame, respectively. As the ${\phi _{{\rm{af}}}}$
increases, the flame front shifts upstream, eventually leading to flashback.
${\phi _{{\rm{af}}}}$
increases, the flame front shifts upstream, eventually leading to flashback.

Figure 10. The changes in averaged A-2 fueled flame shape according to the global equivalence ratio at the afterburner: (a) ${\phi _{af}}$
= 0.48, (b)
${\phi _{af}}$
= 0.48, (b) ${\phi _{af}}$
= 0.58, (c)
${\phi _{af}}$
= 0.58, (c) ${\phi _{af}}$
= 0.68, and (d)
${\phi _{af}}$
= 0.68, and (d) ${\phi _{af}}$
= 0.77.
${\phi _{af}}$
= 0.77.
Figure 11 shows the relationship between the ${\phi _{{\rm{af}}}}$
where flashback occurs and the
${\phi _{{\rm{af}}}}$
where flashback occurs and the ${\phi _{{\rm{af}}}}$
where the
${\phi _{{\rm{af}}}}$
where the $I/{I_{{\phi _{{\rm{af}}}} = 0.5}}$
is the maximum in Fig. 8. It can be seen that the two
$I/{I_{{\phi _{{\rm{af}}}} = 0.5}}$
is the maximum in Fig. 8. It can be seen that the two ${\phi _{{\rm{af}}}}$
have a proportional relationship and the shear layer reactivity and flame shape are closely related. However, shear layer reactivity was not measured under all combustible
${\phi _{{\rm{af}}}}$
have a proportional relationship and the shear layer reactivity and flame shape are closely related. However, shear layer reactivity was not measured under all combustible ${\phi _{{\rm{af}}}}$
for all fuels, so additional measurement and analysis are needed in future work.
${\phi _{{\rm{af}}}}$
for all fuels, so additional measurement and analysis are needed in future work.

Figure 11. Relationship between ${\phi _{af}}$
where the shear layer reactivity is highest and
${\phi _{af}}$
where the shear layer reactivity is highest and ${\phi _{af}}$
where the flashback occurs.
${\phi _{af}}$
where the flashback occurs.
3.3 Combustion instability characteristics
With the increase of the ${\phi _{af}}$
, the flame speed increases, while the flow speed decreases due to reduced dilution air, so Da increases and the likelihood of blowoff decreases. Indeed, for the flames by Jet-A, A-2, C-9, and JP-8/HRJ test fuels, as the
${\phi _{af}}$
, the flame speed increases, while the flow speed decreases due to reduced dilution air, so Da increases and the likelihood of blowoff decreases. Indeed, for the flames by Jet-A, A-2, C-9, and JP-8/HRJ test fuels, as the ${\phi _{af}}$
increases, blowoff does not occur until flashback occurs. However, as mentioned in Chapter 3.1, for flames using C-1 and C-5 test fuels, blowoff occurs before flashback occurs as
${\phi _{af}}$
increases, blowoff does not occur until flashback occurs. However, as mentioned in Chapter 3.1, for flames using C-1 and C-5 test fuels, blowoff occurs before flashback occurs as ${\phi _{af}}$
increases. This is deemed to be related to the pressure perturbation. As can be seen in Fig. 1, pressure perturbations (
${\phi _{af}}$
increases. This is deemed to be related to the pressure perturbation. As can be seen in Fig. 1, pressure perturbations ( $p'_{2}$
and
$p'_{2}$
and $p'_{3}$
) are measured by a high frequency pressure transducers ported just after the honeycomb (DP2) and near the V-gutter (DP3).
$p'_{3}$
) are measured by a high frequency pressure transducers ported just after the honeycomb (DP2) and near the V-gutter (DP3). $p'_{2}$
is the pressure perturbation upstream end of the afterburner, which represents the pressure perturbation affecting the turbine blade, and
$p'_{2}$
is the pressure perturbation upstream end of the afterburner, which represents the pressure perturbation affecting the turbine blade, and $p'_{3}$
is the pressure perturbation near the V-gutter, which is closely related to the heat release rate fluctuation from the flame at the afterburner. Therefore,
$p'_{3}$
is the pressure perturbation near the V-gutter, which is closely related to the heat release rate fluctuation from the flame at the afterburner. Therefore, $p'_{2}$
and
$p'_{2}$
and $p'_{3}$
were measured and analysed for the strength of pressure perturbation and the phase difference between the pressure perturbation and the heat release rate fluctuation, respectively.
$p'_{3}$
were measured and analysed for the strength of pressure perturbation and the phase difference between the pressure perturbation and the heat release rate fluctuation, respectively.
Figure 12 shows the pressure perturbations ( $p'_{2}$
and
$p'_{2}$
and $p'_{3}$
) according to the change in the
$p'_{3}$
) according to the change in the ${\phi _{af}}$
for each test fuel. The plots are obtained by varying the dilution air flow rate while maintaining a steady liquid test fuel flow. The RMS pressures start with the low RMS pressure at the low
${\phi _{af}}$
for each test fuel. The plots are obtained by varying the dilution air flow rate while maintaining a steady liquid test fuel flow. The RMS pressures start with the low RMS pressure at the low ${\phi _{af}}$
for all test fuels, then rapidly increase with the increase in the
${\phi _{af}}$
for all test fuels, then rapidly increase with the increase in the ${\phi _{af}}$
until they reach a plateau region or blowoff. This is similar to the results of previous studies [Reference Stouffer, Hendershott, Monfort, Diemer, Corporan, Wrzesinski and Caswell54, Reference Monfort, Stouffer, Hendershott, Wrzesinski, Foley and Rein55], which examined the pressure perturbations for some NJFCP test fuels and found that pressure perturbation increased sharply above a certain equivalence ratio. For comparison among test fuels, curve fits are performed for the RMS pressures of A-2 and these curve fits are plotted in the red and blue lines along with the RMS pressures. It can be seen that C-1 and C-5 flames have notably different tendency between the RMS pressures and the
${\phi _{af}}$
until they reach a plateau region or blowoff. This is similar to the results of previous studies [Reference Stouffer, Hendershott, Monfort, Diemer, Corporan, Wrzesinski and Caswell54, Reference Monfort, Stouffer, Hendershott, Wrzesinski, Foley and Rein55], which examined the pressure perturbations for some NJFCP test fuels and found that pressure perturbation increased sharply above a certain equivalence ratio. For comparison among test fuels, curve fits are performed for the RMS pressures of A-2 and these curve fits are plotted in the red and blue lines along with the RMS pressures. It can be seen that C-1 and C-5 flames have notably different tendency between the RMS pressures and the ${\phi _{af}}$
while other test fuels show similar trend. In overall, they show much higher RMS pressures compared to other test fuels. In addition, C-1 and C-5 flames don’t have flat RMS pressure region at the low
${\phi _{af}}$
while other test fuels show similar trend. In overall, they show much higher RMS pressures compared to other test fuels. In addition, C-1 and C-5 flames don’t have flat RMS pressure region at the low ${\phi _{af}}$
because they are blown off at higher
${\phi _{af}}$
because they are blown off at higher ${\phi _{af}}$
than other test fuels. They are also blown off at a high
${\phi _{af}}$
than other test fuels. They are also blown off at a high ${\phi _{af}}$
of near 0.64 and 0.58 before flashback happens, respectively. Therefore, flammability limit for C-1 and C-5 flames are narrower than that of the other test fuels.
${\phi _{af}}$
of near 0.64 and 0.58 before flashback happens, respectively. Therefore, flammability limit for C-1 and C-5 flames are narrower than that of the other test fuels.

Figure 12. RMS pressure perturbations measured just after the honeycomb ( $p'_{2}$
) and near the V-gutter (
$p'_{2}$
) and near the V-gutter ( $p'_{3}$
) for each of the test fuels ((a) Jet-A, (b) A-2, (c) C-1, (d) C-5, (e) C-9, and (f) JP-8/HRJ) according to the
$p'_{3}$
) for each of the test fuels ((a) Jet-A, (b) A-2, (c) C-1, (d) C-5, (e) C-9, and (f) JP-8/HRJ) according to the ${\phi _{af}}$
along with the curve fits of the RMS pressures for the A-2 test fuel (shown as the red and blue lines).
${\phi _{af}}$
along with the curve fits of the RMS pressures for the A-2 test fuel (shown as the red and blue lines).
Figure 13 shows the three-dimensional phase space of A-2 flame obtained from $p'_{2}$
for different
$p'_{2}$
for different ${\phi _{af}}$
. When
${\phi _{af}}$
. When ${\phi _{af}}$
is 0.32, the trajectories fill the core of the phase space, which means
${\phi _{af}}$
is 0.32, the trajectories fill the core of the phase space, which means $p'_{2}$
does not have deterministic dynamic characteristics. With the increase of
$p'_{2}$
does not have deterministic dynamic characteristics. With the increase of ${\rm{\;}}{\phi _{af}}$
, it is clearly seen that the trajectory deviates from the core of the phase space and limit cycle is formed. This indicates that the periodicity of the dominant pressure perturbations becomes stronger. This trend happens similarly for all test fuels including C-1 and C-5 universally.
${\rm{\;}}{\phi _{af}}$
, it is clearly seen that the trajectory deviates from the core of the phase space and limit cycle is formed. This indicates that the periodicity of the dominant pressure perturbations becomes stronger. This trend happens similarly for all test fuels including C-1 and C-5 universally.

Figure 13. Three-dimensional phase space [ $p'_{2}$
(
$p'_{2}$
( $t$
),
$t$
), $p'_{2}$
(
$p'_{2}$
( $t - \tau $
),
$t - \tau $
), $p'_{2}$
(
$p'_{2}$
( $t - 2\tau $
)] for different
$t - 2\tau $
)] for different ${\phi _{af}}$
using A-2.
${\phi _{af}}$
using A-2.
In addition, Rayleigh index, which represents the relationship between the pressure perturbation and the heat release fluctuations, is calculated by Equation (8). Here, both the pressure perturbation ( $p'_{3}$
) and the heat release rate fluctuation (
$p'_{3}$
) and the heat release rate fluctuation ( $q'$
) for calculating the Rayleigh index are measured near the V-gutter, where
$q'$
) for calculating the Rayleigh index are measured near the V-gutter, where ${t_p}$
is the period of oscillation.
${t_p}$
is the period of oscillation.
 \begin{align}{\rm{Rayleigh\;index}} = {1 \over {{t_p}}}\mathop \int \nolimits_0^{{t_p}} p'_{3}( t ) \cdot q'(t)dt\end{align}
As shown in Fig. 14, as the Rayleigh index increases, the strength of pressure perturbation also increases. The Rayleigh index refers to the degree of interaction between the pressure perturbation inside the afterburner and the heat release rate fluctuation. Therefore, the pressure perturbations shown in Fig. 12 are attributed to the thermo-acoustic combustion instability. Especially, the Rayleigh indexes of C-1 and C-5 are mostly positive and greater than those of other test fuels, which means that the strength of combustion instability of C-1 and C-5 flames is stronger than that of other flames. Therefore, as the equivalence ratios increase, C-1 and C-5 flames show strong combustion instability caused by constructive interference between the pressure perturbation and the heat release rate fluctuation leading to blowoff.

Figure 14. RMS of $p'_{2}$
for each of the test fuels according to the Rayleigh index.
$p'_{2}$
for each of the test fuels according to the Rayleigh index.
Figure 15 shows the RMS of $p'_{2}$
according to the phase difference between the pressure perturbation (
$p'_{2}$
according to the phase difference between the pressure perturbation ( $p'_{3}$
) and the heat release rate fluctuation (
$p'_{3}$
) and the heat release rate fluctuation ( $q'$
) for each test fuel. As shown in Fig. 15, RMS of
$q'$
) for each test fuel. As shown in Fig. 15, RMS of $p'_{2}$
is strong when the phase difference between
$p'_{2}$
is strong when the phase difference between $p'_{3}$
and
$p'_{3}$
and $q'$
is near zero. Therefore, it can be also seen that the perturbation inside the afterburner is caused by the thermo-acoustic combustion instability.
$q'$
is near zero. Therefore, it can be also seen that the perturbation inside the afterburner is caused by the thermo-acoustic combustion instability.

Figure 15. RMS of $p'_{2}$
according to the phase difference for each test fuel.
$p'_{2}$
according to the phase difference for each test fuel.
Figure 16 shows the joint probability density distribution between the pressure perturbation at DP3 and the heat release rate fluctuation measured by PMT for each test fuel at the ${\phi _{af}}$
of 0.58. For the flames by Jet-A, A-2, C-9, and JP-8/HRJ test fuel, the distribution of
${\phi _{af}}$
of 0.58. For the flames by Jet-A, A-2, C-9, and JP-8/HRJ test fuel, the distribution of $p'_{3}$
and
$p'_{3}$
and $q'$
is circular in the centre and the order of the coefficient of linear relationship corresponds to O(-2). However, for the flames by C-1 and C-5, the distribution shows an upward-sloping trend and the order of the coefficient of linear relationship corresponds to O(-1). In other words, the interaction between the pressure and heat release rate perturbations is weak for the flames by Jet-A, A-2, C-9, and JP-8/HRJ, so perturbations are not strong. However, for the flames by C-1 and C-5, the interaction is stronger so the pressure and heat release rate perturbations are amplified strongly. In other words, the combustion instability occurs strongly for C-1 and C-5 flames due to the relatively strong interaction between the pressure perturbation and the heat release rate fluctuation at the high
$q'$
is circular in the centre and the order of the coefficient of linear relationship corresponds to O(-2). However, for the flames by C-1 and C-5, the distribution shows an upward-sloping trend and the order of the coefficient of linear relationship corresponds to O(-1). In other words, the interaction between the pressure and heat release rate perturbations is weak for the flames by Jet-A, A-2, C-9, and JP-8/HRJ, so perturbations are not strong. However, for the flames by C-1 and C-5, the interaction is stronger so the pressure and heat release rate perturbations are amplified strongly. In other words, the combustion instability occurs strongly for C-1 and C-5 flames due to the relatively strong interaction between the pressure perturbation and the heat release rate fluctuation at the high ${\phi _{af}}$
, which makes the flame detach from the V-gutter and eventually causes the blowoff. In contrast, the flames by Jet-A, A-2, C-9, and JP-8/HRJ test fuels can be sustained without the blowoff even at the high
${\phi _{af}}$
, which makes the flame detach from the V-gutter and eventually causes the blowoff. In contrast, the flames by Jet-A, A-2, C-9, and JP-8/HRJ test fuels can be sustained without the blowoff even at the high ${\phi _{af}}$
since the interaction between the pressure perturbation and heat release rate fluctuation is weak and the DCN of the flames is also high.
${\phi _{af}}$
since the interaction between the pressure perturbation and heat release rate fluctuation is weak and the DCN of the flames is also high.

Figure 16. Joint probability density distribution between $p'_{3}$
and
$p'_{3}$
and $q'$
under
$q'$
under ${\phi _{af}}$
= 0.58 of (a) Jet-A, (b) A-2, (c) C-1, (d) C-5, (e) C-9, and (f) JP-8/HRJ flames.
${\phi _{af}}$
= 0.58 of (a) Jet-A, (b) A-2, (c) C-1, (d) C-5, (e) C-9, and (f) JP-8/HRJ flames.
Using chemiluminescence images of A-2, C-1, C-9, and JP-8/HRJ test fuel flames, the intensity centre within the chemiluminescence FOV was measured. Figure 17 shows the phase difference between pressure and heat release rate with respect to the intensity centre. The intensity centre is set at zero at the position of the V-gutter tip, with the upstream direction being positive and the downstream direction being negative. As the equivalence ratio increases, the intensity centre moves closer to the V-gutter tip. As shown in Fig. 17, as the intensity centre moves upstream, the phase difference between pressure perturbation and heat release rate fluctuation decreases. This is because the delay time between pressure perturbation and heat release rate fluctuation changes as the distance between the fuel injector and flame centre changes according to the equivalence ratio [Reference Lieuwen56, Reference Bae, Jeong and Yoon57]. Additionally, when the position of the intensity centre was around -30 mm, the phase difference was close to zero for all test fuels. For C-1 flame, the intensity centre was mostly located at -30 mm under most chemiluminescence measurement conditions, indicating a stronger oscillation intensity compared to other test fuels since the phase difference was close to zero.

Figure 17. Phase difference between $p'_{3}$
and
$p'_{3}$
and $q'$
for each test fuel according to the location of intensity centre from V-gutter tip.
$q'$
for each test fuel according to the location of intensity centre from V-gutter tip.
4.0 Conclusion
Combustion characteristics of the test sustainable aviation fuels (SAFs) are experimentally explored using an in-tandem combustor. The main combustor operates with CH4 and air, while the afterburner uses the combustion products of the main combustor, the dilution air, and the test SAF as reactants. A total of six test SAFs are used in this study. The following conclusions are drawn from our results.
The lean blowoff (LBO) and flashback characteristics of the test SAF flames are assessed with varying the global equivalence ratio at the afterburner ( ${\phi _{af}}$
). The current study confirms, for the first time, that the flashback is also closely correlated to the derived cetane number (DCN) of each test fuel in a way similar to LBO. For the test fuels with higher DCN, the LBO and flashback occur at the lower
${\phi _{af}}$
). The current study confirms, for the first time, that the flashback is also closely correlated to the derived cetane number (DCN) of each test fuel in a way similar to LBO. For the test fuels with higher DCN, the LBO and flashback occur at the lower ${\phi _{af}}$
. This is because fuels with higher DCN result in a lower chemical time scale for the flame, allowing it to be sustained under conditions of lower flow timescale (i.e., the faster flow speed).
${\phi _{af}}$
. This is because fuels with higher DCN result in a lower chemical time scale for the flame, allowing it to be sustained under conditions of lower flow timescale (i.e., the faster flow speed).
From the measurement of the shear layer reactivity of the test SAFs flame at the V-gutter, it is confirmed that the shear layer reactivity decreases as the ${\phi _{af}}$
approaches the LBO point, which implies that the strength of flame anchoring to the V-gutter becomes weakened. Conversely, the shear layer reactivity increases as the
${\phi _{af}}$
approaches the LBO point, which implies that the strength of flame anchoring to the V-gutter becomes weakened. Conversely, the shear layer reactivity increases as the ${\phi _{af}}$
increases, which means that the flame is more strongly anchored to the V-gutter. However, above a certain
${\phi _{af}}$
increases, which means that the flame is more strongly anchored to the V-gutter. However, above a certain ${\phi _{af}}$
, the shear layer reactivity decreases due to the flashback.
${\phi _{af}}$
, the shear layer reactivity decreases due to the flashback.
From the measurement of the pressure perturbation at the afterburner, the perturbation strength increases as the ${\phi _{af}}$
increases and it was confirmed that the perturbation is caused by thermo-acoustic combustion instability. For the flames by C-1 and C-5 with smaller DCN than other test fuels, the interaction between pressure and heat release rate perturbations is stronger than other test fuels, so the blowoff occurs at the high
${\phi _{af}}$
increases and it was confirmed that the perturbation is caused by thermo-acoustic combustion instability. For the flames by C-1 and C-5 with smaller DCN than other test fuels, the interaction between pressure and heat release rate perturbations is stronger than other test fuels, so the blowoff occurs at the high ${\phi _{af}}$
due to the strong combustion instability.
${\phi _{af}}$
due to the strong combustion instability.
In conclusion, the test fuels with a high DCN, a chemical property of the fuel, can be stabilised at lower equivalence ratios, show wider combustible ranges (including stable and flashback conditions) than test fuels with a small DCN, and have relatively small pressure perturbations, but have a higher risk of flashback. Conversely, the probability of the flashback is low for the test fuels with a small DCN, but they have narrower combustible ranges and higher-pressure perturbations. Therefore, these characteristics need to be considered when they are used in actual combustion engines.
This study explores the combustion characteristics such as LBO, flashback, and combustion instability of six SAFs in an in-tandem combustor and identifies the relationship between the fuel property and those combustion characteristics. Through this, the suitable fuel property and combustion conditions for stable combustion are identified. Therefore, the results will provide a reference for future studies on the SAFs including the NJFCP test fuels. Furthermore, this study demonstrated a unique experimental setup of an in-tandem combustor where two combustors interact each other. The future work will focus the interaction between the two combustors for a wider range of operating conditions, including the utilisation of SAF in the main combustor.
Acknowledgements
The authors would like to acknowledge the NRC Gas Turbine Laboratory team for setting up and performing this test, US AFRL for supplying the fuels and the Canadian Department of National Defence (DND) for their co-funding support.


