


Introduction
Tea (Camellia sinensis L.) is an evergreen and perennial plant of the Theaceace family, which grows in tropical and subtropical climates. Its young leaves are becoming one of the oldest caffeinated soft drinks in the world and it has been accepted as a healthy beverage of human life for 3000 years and is a favourable drink for millions of people (Li et al., Reference Li, Wang, Yao, Hua, Zhou, Jiang and Dong2020). Although tea originated in China, it has been widely cultivated in different parts of the world like Iran (Khiavi et al., Reference Khiavi, Azadi Gonbad and Falakro2020a). Various chemical compounds, namely flavonols, flavanols, phenolic acids, caffeine, amino acids, vitamins, minerals, organic acids, monopolysaccharides, lignin, photosynthetic pigments, ash and aromatic substances are found in tea leaves that have important effects on human health (Shen et al., Reference Shen, Li, Teng, Wang, Wang and Zhuang2019; Li et al., Reference Li, Wang, Yao, Hua, Zhou, Jiang and Dong2020; Samadi and Fard, Reference Samadi and Fard2020; Vastrad et al., Reference Vastrad, Badanayak, Goudar and Badria2022).
Polyphenols are important aromatic compounds in tea that have high antioxidant activity and are beneficial for human health (Kottawa-Arachchi et al., Reference Kottawa-Arachchi, Gunasekare and Ranatunga2019). The major polyphenols in tea leaves were flavonoids, particularly flavanols and organic acids. Among these, catechins are one of the most important components of tea, which include 60–80% of polyphenols. Tea possesses principal medicinal properties such as cardiovascular protection, anti-cancer, anti-diabetes and anti-obesity (Pan et al., Reference Pan, Wang, Rankin, Rojanasakul, Tu and Chen2017; Tang et al., Reference Tang, Zhao, Xu, Gan, Cao, Liu and Li2019). In addition, photosynthetic pigments of tea leaves are strongly correlated with its medical properties and colour (Wang et al., Reference Wang, Liu, Zhao, Sun, Li, Duan and Li2019).
The tea plant has been widely cultivated in the north of Iran as one of the main economic products (Khiavi et al., Reference Khiavi, Falakro, Safaei Chaeikar, Ramzi and Kahneh2020b). It is dried with different drying methods and then packaged and used in the markets of Iran and other countries. There are many differences in the phytochemical attributes of tea genotypes, which make different flavours for consumers. Additionally, because it is a main drink in Iran and many countries, there is a necessity to study the biochemical attributes of tea plants in different accessions. Previously, the changes in phenolic profile and antioxidant capacity of 30 tea genotypes have been addressed by Tang et al., (Reference Tang, Zhao, Xu, Gan, Cao, Liu and Li2019). Yamashita et al., (Reference Yamashita, Katai, Ohnishi, Morita, Panda and Ikka2021) showed different responses of tea tissues (leaf and stem) to main metabolites in 30 tea accessions. Since tea grows in a variety of habitats and has long since adapted to the local environment, it is believed that each place has a unique accession. Evaluation of the morphological and biological characteristics of the many tea accessions in each region can help with accessing the best breeding plans, selection strategies and germplasm management (Iezzoni and Pritts, Reference Iezzoni and Pritts1991; Dargah et al., Reference Dargah, Rezaei, Jahromi, Jari and Khiavi2023). Plant breeders may get more knowledge from this information as they search for new varieties.
The novelty of this research is to investigate the diversity of morphological and biochemical attributes, particularly the essential oil (EO) profile of various tea accessions originating from temperate climates. This study hypothesized that there is a remarkable variability of biochemical properties, particularly polyphenols, photosynthesis pigments and EO constituents on the tea accessions owing to the effect of variation in the conditions of the regions where they originated and genotype factor. The research question is whether different accessions of tea in Iran have different phytochemical and morphological characteristics based on genetics and geographic origin. Therefore, this work was carried out to study the evaluation of the phenotypical diversity of 12 Iranian tea accessions for the introduction of the elite accessions based on caffeine, photosynthesis pigments, catechins, polyphenolic content, EOs constituents and active components amount, also the relationships among studied parameters were evaluated.
Material and methods
Plant materials
In this study, 12 tea accessions from Langroud (A1, A2, A3), Siahkal (A4, A5, A6), Kobijar (A7, A8, A9) and Bazkiaguorab (A10, A11, A12) areas as major tea growing sites in Iran were considered (Table S1). Two-year-old tea plants that were previously propagated from single-leaf node cuttings in the target areas were prepared from the Tea Research Institute nursery in Lahijan City. Plants were cultivated in a completely randomized design (CRD) with five replicates in a greenhouse with a day/night photoperiod of 15/9 h, a temperature range of 16–26 °C, and 85% humidity in 2020. The phytochemical and morphological diversity of plants was studied one year after their establishment in 2021 and 2022. The data of this research are the average of two experimental times on tea accessions.
Morphological study
To investigate tea accession diversity, six quantitative traits were studied based on morphological data (Table 1).
Table 1. Morphological traits of different tea accessions

values are means ± standard deviation for five replicates. Different letters show significantly by Duncan multiples ranges test (P ≤ 0.05).
Tea accessions originated from Langroud (A1, A2, A3), Siahkal (A4, A5, A6), Kobijar (A7, A8, A9) and Bazkiaguorab (A10, A11, A12).
Chlorophyll (Chl) assay
The total Chl content was extracted according to Arnon (Reference Arnon1949). The 200 mg of fresh samples were homogenized in 8 ml of 80% acetone. After that, the mixture was centrifuged at 4 °C for 15 min (3000 rpm). Supernatants were used to analyse total Chl concentration. The samples were read at 645 and 663 nm by a spectrophotometer and final amounts of Chl were calculated according to the following equations:


where V: final volume of Chl extracted in 80% acetone; W: fresh weight of the leaf powder used.
Total polyphenolic content (TPC)
TPC was measured by the Folin-Ciocalteu method using as a reagent and gallic acid (GA) as standard by a spectrophotometer. About 2 g of the sample was homogenized with 8 ml of 80% ethanol and centrifuged at 12,000 × g for 20 min. After that, 0.5 ml supernatant was mixed with 500 μl of Folin-Ciocalteu in 15-ml Falcons, and after 2 min, 1 ml of 7% sodium carbonate was added to the reaction mixture. The final volume of this mixture was increased to 6 ml using distilled water. The Falcons were placed in a Banmari (30 °C) in the dark condition for 90 min. The absorbance of the samples was also measured in a 725 nm wavelength (Ouchikh et al., Reference Ouchikh, Chahed, Ksouri, Taarit, Faleh, Abdelly and Marzouk2011).
Total ash amount
To measure total ash in tea, which is based on burning organic matter in tea at a temperature of 525 ± 25 °C to reach a constant weight. First, the mortar was heated in an oven at 525 ± 25 °C for 1 h, and after cooling in a desiccator, it was weighed. After that 5 g of the dried sample were placed in the mortar in the oven for 2 h until the samples were free of charcoal particles. After cooling the samples, moisten them with some distilled water and dry them in the oven again at the same temperature for 1 h. This process was done till the difference between the two weights was less than 0.001 g. The weight percentage of total ash from the powdered sample was calculated based on the dry matter using the following formula according to ISO (1987).

where, M = weight percentage of total ash, m1 = total ash weight in g, m0 = Sample weight in g, RS = dry matter weight percentage.
Catechins and caffeine contents
Catechins and caffeine contents were determined according to the method described by Horie and Kohata (Reference Horie and Kohata2000). To extract, 25 mg of dry powder was added to 5-ml 50% (v/v) acetonitrile and shaken (130 strokes per minute) for 1 h at 25 °C, and then centrifuged at 2000 × g for 15 min at 4 °C. The supernatant was selected and passed through a 0.45-μm polytetrafluoroethylene filter. The solution was stored at − 30 °C for further sanyasis by high-performance liquid chromatography (HPLC). The HPLC was carried out with 5 μl of injection volume, column, 75 mm × 4.6 mm × 2.6 μm SunShell C18 column (ChromaNik Technologies Inc., Osaka, Japan). The temperature of the column oven, 40 °C; photodiode array detector, 190–400 nm. Eluent A and eluent B, ultra-pure water:acetonitrile: 85% phosphoric acid were used as the mobile phases at a flow rate of 1.0 ml/min. Finally, the amounts of catechins and caffeine were determined according to their standards.
Essential oil (EO) extraction
To extract the EO content, plant samples were dried in the shade, and 100 g was utilized in a Clevenger device for 3 h. The isolated EOs were preserved at −20 °C and dried with anhydrous sodium sulphate in preparation for further analysis (Sefidkon et al., Reference Sefidkon, Abbasi and Khaniki2006).
Gas chromatography/mass spectrometry (GC/MS) and compound identification
An Agilent 6890 GC with a BPX5 capillary column of 30 mm × 0.25 mm and a film thickness of 0.25 m was used to analyse the EO after it had been diluted in hexane (1 mg mL−1). The temperature of the column was fixed at 50 °C for 5 min. It was then heated from that point on by 3 °C per minute to 240 °C and then by 15 °C per minute to 300 °C. The split ratio was set to one-third, and the injector and detector were set to 240 and 290 °C, respectively. Helium was employed as the carrier gas at a flow rate of 0.5 mL min−1. In terms of oven and column temperatures as well as flow pattern, the GC/MS (Agilent 5973N mass detector) adhered to the GC's protocol.
To determine the constituents, retention time (RT) and mass spectra of the compounds were compared with information from the Wiley library and the literature, as well as with those of actual compounds. Using a combination of n-alkanes (C8–C25), the components' retention indices (RI) were computed and they were further identified.
Statistical analysis
The data were analysed in a completely randomized design (CRD) for 12 accessions. Data were analysed using SAS software version 9.2 and the mean of data was compared using the Duncan multiple range test. Agglomerative hierarchical clustering (AHC) based on the Ward variance method and principal component analysis (PCA) were performed using the XLSTAT software (version 2022.4, ADDINSOFT INC.). The heat map was done by CIMMiner based on one matrix CIM. Pearson correlation coefficient was done for biochemical and morphological traits using SPSS (V.19).
Results
Morphological traits
According to the ANOVA, significant differences occurred in the morphological traits among the accessions (P ≤ 0.05). Morphological properties showed various amounts between accessions. The variability of 23 cm in plant height was recorded among the tea accessions. Internode length differed from 15.33 mm in A7 to 38.5 mm in A2. In addition, A6 represented the longer and wider leaves than other accessions. Petiole length was found in a range of 2.81–6.36 mm, which A1 showed a higher amount than others (Table 1).
Chlorophyll (Chl) content, ash and total polyphenolic content (TPC)
Chl a was significantly (P ≤ 0.05) changed among accessions. It differed from 0.80 mg g−1 in A10 to 3.33 mg g−1 in A4 (Table 2). In total, tea plants collected from Bazkiaguorab showed lower Chl a as compared with other accessions. Like Chl a, Chl b represented different amounts between accessions. The maximum and minimum Chl b were observed in A7 and A11, respectively. Total Chl was found in a range of 0.94-4.15 mg g−1. A 4.4-fold increase in total Chl content was observed in A6 relative to A11 (Table 2).
Table 2. Phytochemical traits of different tea accessions from Iran

*Chlorophyll (Chl), Total ash, total polyphenolic content (TPC), caffeine (CAF) and gallic acid (GA), catechin, epicatechin (b), and epigallocatechin gallate (EGCG) of different tea accretions. Values are means ± standard deviation for five replicates. Different letters show significantly by Duncan multiples ranges test (P ≤ 0.05). Tea accessions originated from Langroud (A1, A2, A3), Siahkal (A4, A5, A6), Kobijar (A7, A8, A9) and Bazkiaguorab (A10, A11, A12).
The variability of total ash and TPC were significantly (P ≤ 0.05) obtained between accessions. The A9 with 7.5% represented the highest total ash, while its lowest amount was obtained in A11 to be 4% (Table 2). Although the accessions of Langarud showed no significant changes, there were noticeable changes between the accessions from other sites. Generally, accessions of Bazkiaguorab had lower total ash when compared to the control (Table 2). Unlike total ash, Bazkiaguorab accessions, particularly A10 and A11, showed a higher TPC relative to other accessions. Interestingly, A6 and A7 possessed the lowest TPC with 3.4 and 3.2-fold decreases compared to A11 (Table 2).
Caffeine and gallic acid (GA)
The significant (P ≤ 0.05) differences of caffeine and catechin, as the main ingredients of tea, were obtained in tea accessions (Table 2). Caffeine differed from 4.37 mg g−1 in A2 to 9.43 mg g−1 in A7. The minimum variability of caffeine was addressed in the accessions of Bazkiaguorab, ranging from 4.50 (A12) to 4.81 (A11) mg g−1 (Table 2). In addition, GA in A9 and A10 possessed higher amounts when compared to other accessions. It was obtained in a wide range of 0.10–7.46 mg g−1. The minimum variability in GA was obtained in accessions of Langarud (Table 2).
Catechins
The catechins, represented significant (P ≤ 0.05) variability between accessions. Catechin in A9 (2.88 mg g−1) from the Kobijar site was significantly higher than other accessions. The high variability of catechin was observed in accessions collected from Kobijar, where a 3.5-fold increase of catechin was reported in A9 relative to A8 (Table 2). Epicatechin in A10 reached the highest amount. It ranged from 6.48 mg g−1 in A5 to 15.44 mg g−1 in A10 (Table 2). Interestingly, EGCG in accessions of Langarud and Bazkiaguorab was greater when compared to other accessions. It was found in a wide range of 0.94–21.03 mg g−1 (Table 2).
Multivariate analysis of phytochemical and morphological traits
According to PCA of biochemical traits, F1 and F2 explained 72.67% of changes with 43.39% for F1 and 29.28% for F2 (Fig. 1a). F1 described A6, A8, A11, A12 and F2 justified A1, A5, A9 and A10. For traits, Chl a, Chl b, total Chl, total ash, TPC and EGCG were described by F1, and catechin, epicatechin, and GA were justified by F2. Therefore, among the catechins, EGCG possessed different behaviour between accessions. As expected, all Chl attributes and ash showed similar trends between accessions. Catechin was positively correlated with epicatechin and GA. However, TPC and EGCG were negatively correlated with Chl and Ash contents (Fig. 1a). All morphological traits were justified by F1; therefore, PCA was not appropriate for morphological variability among tea accessions (Fig. 1b).

Figure 1. Principal component analysis (PCA) for biochemical (a) and morphological (b) attributes in different tea accessions. Agglomerative hierarchical clustering (AHC) for biochemical (c) and morphological (d) attributes in different tea accessions. (e) Heat map analysis for studied traits in different tea accessions. GA, gallic acid; Chl, Chlorophyll; TPC, total polyphenolic content; EGCG, epigallocatechin gallate; IL, internode length; LL, leaf length; LW, leaf width; PL, petiole length.
AHC showed three clusters of accessions, where cluster 1 included A1, A2, A3, A4, A5, A6, A7 and A8; cluster 2 consisted of only A9; and A10, A11 and A112 were placed in class 3 (Fig. 1c). For morphological traits, A1, A3 and A4 were placed in cluster 1; cluster 2 included A6 and A12; cluster 3 consisted of A2, A7, A8, A9, A10 and A11 (Fig. 1d).
Heat map of phytochemical and morphological traits
The heat map represents the distribution of traits based on colour value, ranging from blue (the minimum) to red (the maximum). Accordingly, EGCG, catechin and GA showed the maximum variability, while ash, caffeine and epicatechin had the minimum changes between the accessions. According to its clustering, A9, A10, A11 and A12 were presented in a separate cluster (Fig. 1e).
Correlation between phytochemical and morphological data
Plant height positively correlated with the ratio of leaf length to leaf width (r = 0.558), and Chl a (r = 0.385), but had a negative correlation with EGCG (r = −0.448). Internode length showed a positive and significant correlation with leaf length (r = 0.455), and leaf width (r = 0.459), but a negative correlation with EC (r = −0.490), GA (r = −0.409), and caffeine (r = −0.378). Catechin strongly correlated with GA (r = 0.822), and epicatechin (r = 0.577). In addition, a negative and strong correlation was obtained for EGCG with photosynthesis pigments (Table 3).
Table 3. Correlation between phytochemical and morphological data

IL, internode length; LL, leaf length; LW, leaf width; PL, petiole length; GA, gallic acid; EC, epicatechin; EGCG, epigallocatechin gallate; Chla, chlorophyll a; Chlb, chlorophyll b; ChlT, total chlorophyll; TPC, total polyphenolic content.
*Correlation is significant at the 0.05 levels (bilateral).
**Correlation is significant at the 0.01 levels (bilateral).
Essential oil (EO) profile
The GC-MS analysis identified 18 compounds, which represented more than 90% of the total EO for all treatments (Table 4). The main EO constituents were 2-pentyl furan followed by octane, hexanal, ortho-cymene, gamma-terpinene, terpinen-4-ol, alpha-copaene, E-caryophyllene. 2-pentyl furan varied from 9.87% in A12 to 12.99% in A1. The maximum and minimum octane was obtained in A5 and A9 to be 5.01 and 6.76%, respectively. Hexanal was found in 8.35–10.43%. Terpinen-4-ol showed the minimum variability, ranging from 6.91 to 7.34%. Alpha-copaene had 18% variability among the accessions, ranging from 7.58 to 8.91. The maximum E-caryophyllene was recorded in A11, which had a 19% increase relative to its minimum amount in A1 (Table 4).
Table 4. Essential oil profile of tea accessions
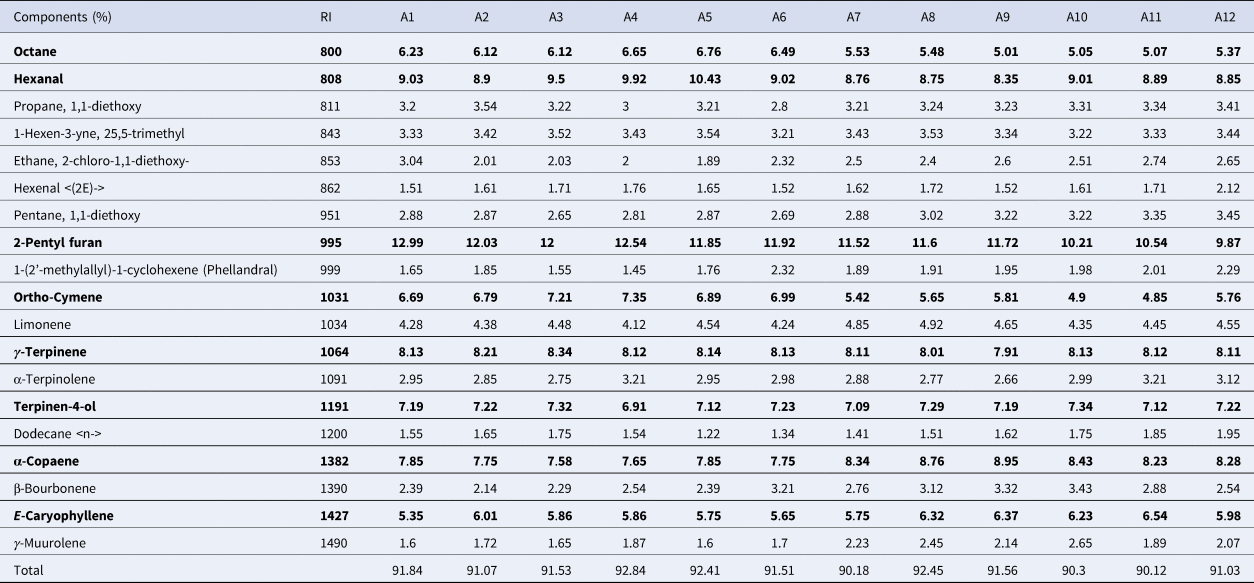
Tea accessions originated from Langroud (A1, A2, A3), Siahkal (A4, A5, A6), Kobijar (A7, A8, A9) and Bazkiaguorab (A10, A11, A12). Bold words show the main essential oil constituents which represent the major amount of essential oil.
Multivariate analysis and heat map for essential oil (EO) profile
According to PCA, octane, hexanal, 2-pentyl furan, ortho-cymene and gamma-terpinene are negatively corralled with terpinen-4-ol, alpha-copaene and E-caryophyllene. A1-6 showed a negative trend with A7-12 in terms of the main EO profile (Fig. 2a). Based on AHC, three clusters were identified for tea accessions in terms of the EO profile (Fig. 2b). The heat map analysis for the EO profile showed that octane, hexanal and ortho-cymene had the maximum variability, while the minimum variability was recorded for gamma-terpinene and terpinen-4-ol (Fig. 2c).

Figure 2. Principal component analysis (a), agglomerative hierarchical clustering (b), and heat map (c) for essential oil profile in tea accessions.
Discussion
Morphological traits
In this study, morphological characteristics showed significant differences between tea accessions. Rajanna et al. (Reference Rajanna, Ramakrishnan and Simon2011) reported that phenotypic characters such as leaf area, shoot weight and young shoot colour can be used to differentiate between the three Camellia species and their accessions into well-defined phenotypic groups, similar to the genetic diversity determined by RAPD markers. As a result, information on morphological diversity should be valuable for future breeding programmes as well as optimal genetic diversity conservation in adapted germplasm. Even though morphological and phytochemical traits can vary in response to environmental stress, climatic changes and genetics (Ghanbari et al., Reference Ghanbari, Salehi and Moghadam2022; Zare Hoseini et al., Reference Zare Hoseini, Mehregan, Ghanbari Jahromi, Mousavi and Salami2022), morphological traits are still an essential and basic step in correctly identifying plants (Ghanbari et al., Reference Ghanbari, Salehi and Jowkar2023).
Phytochemical traits
The results of the present study showed considerable variabilities of biochemical traits between tea accessions, which these changes can be expected due to the cross-pollination and self-incompatibility of the tea plant (Kottawa-Arachchi et al., Reference Kottawa-Arachchi, Gunasekare and Ranatunga2019). Based on the result, Siahkal accessions (A4, A6) showed the highest photosynthetic pigments content. Photosynthesis is the main process that affects plant growth. High photosynthetic pigment content can improve the growth indicators and medicinal value of tea plants (Chavoshizadeh et al., Reference Chavoshizadeh, Pirsa and Mohtarami2020; Zeng et al., Reference Zeng, Ping, Sanaeifar, Xu, Luo, Sha and Li2021). Also, Chl content is an effective tool for evaluating tea quality, which has a direct correlation with polyphenols (Li et al., Reference Li, Yang, Ahammed, Shen, Yan, Li and Han2016) and colour and flavour characteristics (Ošťádalová et al., Reference Ošťádalová, Tremlová, Pokorná and Král2015). In this study, the accessions of Siahkal had both high levels of Chl content and high polyphenol content, but PCA confirmed the negative correlation between Chl content and TPC. According to heat map analysis, Chl content was relatively susceptible to geographical region changes.
The total ash content in all tea accessions varied between 4 and 7.5. In terms of quality, the values obtained from total ash in all accessions were similar to the ISO (International Standard Organization) range defined based on Nepal standards (4–8%) (Jayawardhane et al., Reference Jayawardhane, Madushanka, Mewan, Jayasinghe, Karunajeewa and Edirisinghe2016). Ash content is an important parameter of tea quality. Higher ash content in tea may be due to the lower moisture content in tea (Jayawardhane et al., Reference Jayawardhane, Madushanka, Mewan, Jayasinghe, Karunajeewa and Edirisinghe2016) and may also be related to the mineral content of the tea sample (Yadav et al., Reference Yadav, Parajuli, Khatri and Shiwakoti2020).
In this research, the TPC is varied in different accessions statistically. Tea polyphenols possess anti-mutagenic, antioxidant and antidepressant effects as well as reduce blood pressure and inhibit lipid peroxidation (Kottawa-Arachchi et al., Reference Kottawa-Arachchi, Gunasekare and Ranatunga2019). Currently, high polyphenols in tea and caffeine content are used as commercial raw materials to extract functional compounds (Cheptot et al., Reference Cheptot, Maritim, Korir, Kipsura, Kamunya, Matasyoh and Muoki2019). Studies have shown that the polyphenolic composition of plant organs varies under the influence of genotype and growth conditions (Chen et al., Reference Chen, Huang, Liang, Dai, Zhang, Li and Sun2020).
Significant variation was observed among the 12 tea accessions for caffeine content in this study. In tea plants, catechins and caffeine act as secondary metabolite defensive chemicals. They defend sessile plants from diseases and predators, as well as oxidative stress and other environmental factors. Thus, the quantity of catechins and caffeine in tea samples differed depending on the environment and genotype (Hyun et al., Reference Hyun, Gi, Sebastin, Cho, Kim, Yoo, Lee, Son and Lee2020). Many earlier investigations found a high diversity of caffeine levels in tea accessions (Kottawa-Arachchi et al., Reference Kottawa-Arachchi, Gunasekare and Ranatunga2019; Hyun et al., Reference Hyun, Gi, Sebastin, Cho, Kim, Yoo, Lee, Son and Lee2020). Caffeine is the most prevalent alkaloid in tea, with a level ranging from 15 to 50 mg g−1. (Kottawa-Arachchi et al., Reference Kottawa-Arachchi, Gunasekare and Ranatunga2019). In this study, the caffeine content of 12 tea accessions ranged from 4.5 to 9 mg g−1 (Fig. 2a). Significant variations in caffeine content have been observed in tea germplasm collections from a number of tea-growing countries. Because of caffeine's pharmacological characteristics on the central nervous system, the demand for low-caffeine tea is developing rapidly, rising from 2% of global tea consumption in 1980 to 15% in the early twenty-first century (Gill, Reference Gill, Willson and Clifford1992). Although many nations have invested in decaffeinated tea methods and techniques, such methods and techniques might lose the tea's characteristic fragrance and flavour, lowering the quality. Thus, it is critical to generate low-caffeine clones through breeding and selection, since such clones might be a solution to the problem of excessive caffeine levels and significantly contribute to the availability of natural low-caffeine tea (Chen et al., Reference Chen, Zhou, Chen and Zhou2005). The tea accessions with reduced caffeine content in this study might be employed as naturally low-caffeine genetic resources for crossbreeding parents.
Tea leaf has six main catechins: (+)-catechin, (−)-epicatechin, (−)-epicatechin gallate, (+)-gallocatechin, (−)-epigallocatechin and (−)-epigallocatechin gallate (EGCG) (Robertson, Reference Robertson, Willson and Clifford1992). In this research, three types of catechins (catechin, epicatechin and EGCG) in different accessions were examined and compared. Catechins showed significant differences between different tea accessions. It has been reported that the amount of catechins in green and dried leaves varies according to genotypes and climatic conditions, especially sunlight (Donlao and Ogawa, Reference Donlao and Ogawa2019; Yadav et al., Reference Yadav, Parajuli, Khatri and Shiwakoti2020). Our results showed that Bazkiaguorab and Kobijar accessions produced higher catechin compared with that obtained in other accessions. The amount of catechins also depends on the topographic status of tea-growing areas (Wen et al., Reference Wen, Ren, Zhang, Duan, Shen, Zhu and Fang2020). In addition, Zhang et al., (Reference Zhang, Zhang, Qiu, Guo, Wan, Zhang and Wen2020) showed different amounts of catechin and gallic acid in different tea cultivars. The highest amount of EGCG was measured in Langroud A2 and Bazkiaguorab A11. Previous investigations found the following catechin content ranges: EGCG, 13.0 to 139.0 mg g−1; epicatechin, 2.0 to 54.5 mg g−1 and catechins, 0.3 to 30.9 mg g−1 (Yao et al., Reference Yao, Caffin, D'Arcy, Jiang, Shi, Singanusong, Liu, Datta, Kakuda and Xu2005; Jin et al., Reference Jin, Ma, Ma, Yao and Chen2014; Koch et al., Reference Koch, Kukula-Koch, Komsta, Marzec, Szwerc and Głowniak2018). In this investigation, the 12 tea accessions had a similar degree of catechins concentration to previous studies. Consequently, tea accessions with favourable catechin compositions might be introduced into crop breeding programmes.
PCA showed Bazkiaguorab (A10, A1 and A12) in a distinguished cluster, which was confirmed by biochemical changes due to high genetic differences between the various accessions. According to heat map analysis, EGCG, catechin and GA showed the maximum variability. Therefore, these biochemical traits are more sensitive to genetic variations and geographical origin and can be used as smart attributes in tea plants for breeding and production programmes. The changes in biochemical traits upon environmental and genetic conditions exert the variability in morphological traits of plants (Vozhdehnazari et al., Reference Vozhdehnazari, Hejazi, Sefidkon, Jahromi and Mousavi2022). Since the studied 12 accessions were cultivated under the same environmental conditions, the existence of differences in their phytochemical characteristics was probably related to their origin and/or genotypic factors.
The larger plants showed a lower amount of EGCG. Epicatechin and catechin have a positive correlation with gallic acid. Additionally, a strong negative correlation between photosynthetic pigments and EGCG was found (Table 3). These correlations between traits can help to choose the best plant in terms of the desired breeding traits. Certainly, any selection with consideration of correlation analysis based on morphological markers must be done according to the goal of breeding for improvement of plant yield or bioactive components, because each parameter has its morphological markers (Bahmani et al., Reference Bahmani, Darbandi, Ramshini, Moradi and Akbari2015).
The distinct chemicals were identified in this study, a first for tea plants. Rehman et al. (Reference Rehman, Bhatti, Iqbal and Rashid2008) claimed that the principal EO components of black tea leaves were α-Pinene and β-Pinene. Lin et al. (Reference Lin, Dai, Guo, Xu and Wang2012) demonstrated that the primary EO profiles of Longjing tea leaves were linalool, nonanal, (Z)-3-hexenyl hexanoate and β-ionone. According to Sharma et al. (Reference Sharma, Rana and Kumar2022), tea cultivar flowers include citral, octadecane and benzyl benzoate. According to the literature, plant tissue of the main factor in representing different EO profiles. According to the AHC data, the accession's EO profile exhibited similar behaviour to other chemical and morphological features. Sesquiterpenes (α-copaene and E-caryophyllene) were inversely linked with octane, hexanal and ortho-cymene, which led to the intriguing results that were validated by PCA. In the future, it will be necessary to generate superior genotypes and greater yield with particular breeding goals in order to study how the constituents of tea EO alter in various climates.
Conclusions
In this study, the tea accessions exhibited variations of morphological traits, caffeine, catechins, photosynthetic pigments content and polyphenols that support the notion that the phytochemical content of tea is affected by geographical origin and genetic factors. Among these traits, gallic acid, epigallocatechin gallate, catechin and chlorophyll b represented the higher variability compared with other traits upon genetic and geographical variations. Based on the essential oil profile, the presence of some beneficial compounds for human health was identified in the essential oil of tea accessions. It was clear from this study's dendrogram that the one based on morphological attributes largely differed from the one based on phytochemical variables, which indicated a strong potential for breeding programmes for the analysed accessions. The results of this study can be used as a start in breeding projects in the future to enhance and create new cultivars with superior traits. Additionally, it can help programmes discover rare cultivars and preserve and develop indigenous genotypes of the C. sinensis (L.) Kuntze.
Supplementary material
The supplementary material for this article can be found at https://doi.org/10.1017/S1479262123000928.
Competing interests
None.


