


1. Introduction
In light of the increasing public awareness of environmental and climate damages due to polluting (e.g., greenhouses gas or GHG) emissions, an increasing number of firms are engaging in environmental actions such as emission-reducing activities. For instance, a recent global survey of 530 corporate executives conducted by corporate governance advocacy non-profit OCEG reveals that 32 per cent of respondents said they were planning to base compensation for executives on Environmental, Social and Governance (ESG) factors, while 20 per cent said they already do so (DiNapoli, Reference DiNapoli2021).
Indeed, 45 per cent of the companies listed in the FTSE 100 already have an ESG factor in either the annual bonus or long-term incentive plan (LTIP) or both. In detail, 19 per cent use ESG in LTIP, with an average weight of 16 per cent; the most common LTIP is linked to environmental issues such as decarbonisation and energy transition (PwC, 2021).
Looking more closely at a specific industry, oil and gas companies seem to be the pioneers in offering their executives compensation schemes linked to environmental targets. For instance, in December 2018, Shell made a public announcement that, from 2020 onwards, the company would start linking the incentive pay of its CEO and senior management to company-wide carbon targets. In 2019, due to shareholder pressure, other major actors in the sector, such as BP, Chevron, ExxonMobil, and Total, decided to include carbon targets in executive pay. Nonetheless, CEO incentives are linked to climate metrics in different ways. For short-term incentives, all the above mentioned companies, except ExxonMobil, link the incentive to a measure of GHG emissions reduction, with weights up to 10 per cent. ExxonMobil relates the short-term pay only to financial performance; Total is the only company with explicitly-labelled performance measures on environmental corporate social responsibility. On the other hand, BP, ExxonMobil and Shell link long-term CEO incentives to climate targets, while Total and Chevron only to financial performances. On average, climate-related metrics make up 8 per cent of short-term and 4 per cent of long-term incentive pay (Ritz, Reference Ritz2020).
Consequently, scholars have started analysing the introduction of explicit environmental incentives into the compensation contract of executives, mainly in the context of Cournot oligopolies in which pollution externalities exist, either with firms engaging voluntarily in emission reduction via corporate socially responsible actions (e.g., Hirose et al., Reference Hirose, Lee and Matsumura2017; Lee and Park, Reference Lee and Park2019, Reference Lee and Park2021), or with governments setting emissions taxes (e.g., Buccella et al., Reference Buccella, Fanti and Gori2022).Footnote 1
In the latter framework, a pioneering contribution is an article by Poyago-Theotoky and Yong (Reference Poyago-Theotoky and Yong2019) (PTY henceforth). They build a three-stage game in which, in a Cournot duopoly, owners design the incentive contracts for their managers in the first stage, before the emission tax level is set by the environmental regulator. Then, in the second stage, the regulator and the managers decide simultaneously on the emission tax and abatement levels, respectively. In the final stage of the game, managers choose output. The key results are as follows.
Comparing the exogenous equilibria under the symmetric sub-games with the environmental contract (in which the incentive is the reduction of the environmental tax base) and the standard sales contract, PTY show that, depending on the efficiency of the ‘green’ R&D, the explicit environmental contract can lead to higher abatement levels than those with a standard sales (revenues) compensation contract. Therefore, the regulator sets a lower emissions tax, and social welfare is higher. Moreover, the environmental delegation contract yields higher profits than the sales delegation contract.
Our work is based on the idea developed by Buccella et al. (Reference Buccella, Fanti and Gori2022), who study the green delegation theory in a duopoly with a timing of the game different from that proposed by PTY, and with a different environmental contract, and extends the model of PTY by analysing it under an appropriate game-theoretic approach to study the emergence of Nash equilibria. In doing this, the present article: (1) introduces the asymmetric sub-games in which the owner of one firm adopts the environmental contract, whereas the owner of the rival firm adopts the standard delegation contract; and (2) adds the (decision) stage in which owners strategically choose the delegation contract. Our findings show that the environmental contract never arises in the PTY setting as the unique sub-game perfect Nash equilibrium (SPNE) of the non-cooperative managerial game.
However, if the owners offer a ‘pure’ sales delegation contract based on sales volume (i.e., with a bonus linked to output) instead of the sales/revenues delegation contract considered by PTY, closed-form results reveal that: (1) when the green R&D technology is efficient, the ‘pure’ sales contract emerges as the unique Pareto-inefficient Nash equilibrium (self-interest and mutual benefit of designing an environmental managerial contract conflict when the environmental contract is contrasted with the sales contract); and (2) when the green R&D technology is inefficient, multiple Nash equilibria in pure strategies exist (coordination game). The theoretical predictions shown in this article seem to be more in line with the anecdotal evidence reported above that, in an oligopoly market, no universal environmental contract is offered by companies to their executives.
The work also compares the environmental delegation contract with profit maximisation and studies the emergence of the corresponding Nash equilibrium of the game. The main finding is that, when contrasted with profit maximisation, the environmental contract emerges as the unique (Pareto efficient) SPNE (self-interest and mutual benefit of designing an environmental managerial contract do not conflict when the environmental contract is contrasted with profit maximisation), providing an incentive for the design of the environmental contract proposed by PTY. However, when it is contrasted with the sales delegation contract, it never emerges as the unique SPNE. Indeed, owners often have the incentive to design the sales delegation contract, which emerges as the unique (Pareto inefficient) SPNE when contrasted with profit maximisation (in line with the literature pioneered by Vickers (Reference Vickers1985), Fershtman and Judd (Reference Fershtman and Judd1987) and Sklivas (Reference Sklivas1987)).
The policy implication is clear: either there is no need to design the environmental contract if the R&D abatement technology is efficient or there may be an incentive to design it if the R&D abatement technology is inefficient. Given the historical observation of improvements in the R&D technology, an increase in R&D abatement efficiency makes ad hoc environmental delegation contracts increasingly unnecessary over time. Therefore, it is increasingly important to direct resources towards innovation to improve R&D efficiency instead of designing ad hoc green contracts to managers, which instead can be proposed when the R&D efficiency is lower.
The remainder of the article is organised as follows. Section 2 briefly presents the model and summarises the findings of PTY. Section 3 extends PTY's model by considering the asymmetric sub-game in which the owner of one firm offers the environmental contract to his/her manager and the owner of the rival offers the sales contract based on revenue delegation. Then, it proceeds by deriving the endogenous market structure and analysing the SPNE emerging in the contract decision game. Section 4 studies the game in which owners offer to managers either the ‘environmental’ or the ‘pure’ sales delegation contract. This is done to get closed-form expressions and then analytically solve the contract decisions game at the decision stage. Section 5 provides details on the comparison between the incentive contracts studied in this article (i.e., environmental delegation and sales delegation) and the standard case of profit maximisation (i.e., no delegation), following the spirit of Buccella et al. (Reference Buccella, Fanti and Gori2022) and the corresponding emergence of Nash equilibria. Section 6 closes the article with a discussion of the possible policy implications following the main results and some final remarks. The online appendix offers some modelling explanations and numerical examples to clarify the outcomes of section 3.
2. The model
This section briefly reports the basic ingredients of the PTY model. In a Cournot duopoly, firm i and firm j ($i = \{{1,\,2} \}$ , $i \ne j$
 ) produce homogeneous goods, ${q_i}$
 and ${q_j}$
 , respectively, and sell them in a market where the aggregate normalised inverse demand is $p = 1 - Q$
 , where p denotes the marginal willingness to pay of consumers, and $Q = {q_i} + {q_j}$
 is the total supply.
The cost function of firm i is ${C_i}({{q_i},\,{x_i}} )$ , where ${x_i}$
 represents the ‘green’ R&D effort (abatement) that firm i engages in. Following PTY, we assume:

where $0 \le c < 1$ is the marginal cost of production, and $\gamma > 0$
 is a parameter measuring the R&D efficiency. A decrease in $\gamma$
 represents a technological development so that investing in green R&D is cheaper (i.e., the efficiency of the green R&D investment increases).
The net emissions following the industrial production of each firm are

Combining the indirect linear demand with equations (1), (2), the profit function of firm i is:

Without loss of generality, we assume that $c = 0$ henceforth by directly following PTY. Total emissions ($E$
 ) are measured by the index $E = \mathop \sum \nolimits^ {e_i}({{q_i},\,{x_i}} )$
 and the environmental damage ($ED$
 ) is assumed to be a convex function given by $ED = ({1/2} ){E^2}$
 .
.
Owners delegate the choice of output and abatement to managers by offering them a ‘take-it-or-leave-it’ linear retribution scheme (e.g., Fershtman and Judd, Reference Fershtman and Judd1987), whose structure is ${\mathrm{\Omega }_i} = {\beta _i} + {B_i}{\textrm{O}_i}$ , with ${\beta _i},{B_i} > 0,$
 and with ${O_i}$
 the incentive part. As in PTY, we analyse the following alternative contracts:


where ${\alpha _i} \in ({0,\,1} )$ is the size of the bonus (chosen by the owner at the bonus stage), $t{x_i}$
 is the tax savings with respect to which the delegation is based in scenario (4), and $p{q_i}$
 is the revenue with respect to which the delegation is based in scenario (5). Owners fix the compensation scheme such that the manager obtains his/her reservation utility, normalized to zero. Therefore, managers take their decisions by maximizing ${O_i}$
 , depending on whether the contract includes an environmental component.
The timing of the game resembles PTY.Footnote 2 Unlike PTY, however, we add the analysis of the asymmetric sub-games, in which one firm hires an $ed$ -oriented manager and the rival an $sd$
 -oriented one, and the contract decision stage, in which owners endogenously choose the market structure. Therefore, firms engage in a four-stage non-cooperative managerial decision game with homogenous products and complete information. At stage one, each owner chooses to design a contract based on environmental or sales incentives (the contract decision stage). At stage two (the bonus stage), each owner chooses the extent of the bonus that should be set to his/her manager (either in the $ed$
 or in the $sd$
 case). As in PTY, each contract cannot be re-negotiated and becomes common knowledge. At stage three, the manager hired in each firm decides on the extent of the abatement effort and, simultaneously, the regulator (government) sets the emission tax. Finally, at stage four (the market stage) each manager chooses the output in the product market. The game is solved according to the backward induction logic.
2.1 Symmetric sub-games and exogenous equilibria
The equilibrium outcomes of the symmetric sub-games developed by PTY, in which both owners (i.e., firms) universally design either the $ed$ contract or the $sd$
 contract, are summarised in table 1 (the $ed$
 contract) and table 2 (the $sd$
 contract). The results obtained and discussed in PTY hold here.Footnote 3
Table 1. Equilibrium outcomes in the PTY model when the owners of both firms offer the $ed$ contract
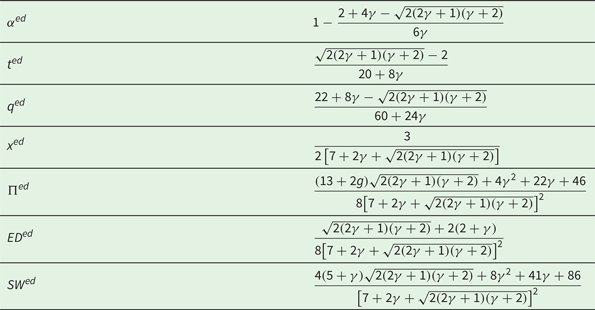
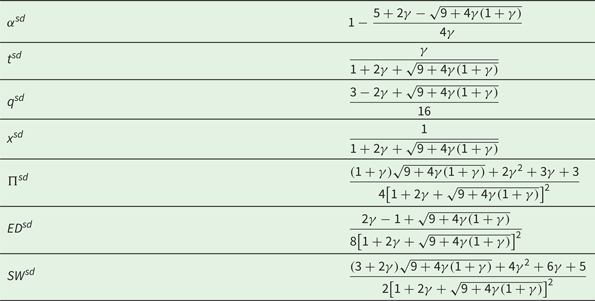
Table 2. Equilibrium outcomes in the PTY model when the owners of both firms offer the $sd$ contract
All the quantities reported in table 1 (including net emissions ${q^{ed}} - {x^{ed}}$ ) are positive for any $\gamma > 0$
 , $0 < {\alpha ^{ed}} < 1$
 for any $\gamma > 0$
 , and ${t^{ed}} = 0$
 if and only if $\gamma = 0$
 . Equilibrium social welfare $SW$
 is given by the algebraic sum of consumers' surplus ($CS = {Q^2}/2$
 ), producers' surplus ($PS = {\mathrm{\Pi }_i} + {\mathrm{\Pi }_j}$
 ), tax revenues ($TR = t({{e_i} + {e_j}} )$
 ) and environmental damage ($ED$
 ), i.e., $SW = CS + PS + TR - ED$
 .
.
Likewise, all the quantities reported in table 2 (including net emissions ${q^{sd}} - {x^{sd}}$ ) are positive for any $\gamma > 0$
 , $0 < {\alpha ^{sd}} < 1$
 for any $\gamma > 2/3$
 , and ${t^{sd}} = 0$
 if and only if $\gamma = 0$
 . Therefore, to compare the sub-game $ed$
 with the sub-game $sd$
 , one must assume that $\gamma > 2/3$
 .
.
The following lemma summarises the key findings of PTY.
Lemma 1. ${\mathrm{\Pi }^{ed}} > {\mathrm{\Pi }^{sd}}$ , ${t^{ed}} < {t^{sd}}$
 always hold; ${\alpha ^{ed}} \frac{\gt}{\lt} {\alpha ^{sd}}$
 , ${x^{ed}} \frac{\gt}{\lt} {x^{sd}}$
 , ${q^{ed}} \frac{\gt}{\lt} {q^{sd}}$
 , ${\left(\frac{E}{Q}\right)^{ed}} \frac{\gt}{\lt} {\left(\frac{E}{Q}\right)^{sd}}$
 and $S{W^{ed}} \frac{\gt}{\lt} S{W^{sd}}$
 if $\gamma \frac{\gt}{\lt} \tilde{\gamma }$
 , where $\tilde{\gamma } = 2.735$
 .
.
3. Asymmetric sub-games and endogenous equilibria
This section studies the asymmetric sub-game in which the owner of one firm, say firm 1, offers his/her manager the $ed$ contract and the owner of the rival, say firm 2, offers the standard $sd$
 contract (based on revenues). Thereby, it evaluates the firms' profits emerging in each possible strategic profile, and then determines the SPNE of the game at the contract decision stage, in which the owners strategically choose the contract that should be proposed to their managers (first stage of the game), i.e., the endogenous market structure. The stages of this asymmetric sub-game are identical to those analysed so far for the symmetric ones (see also the online appendix).
3.1 The asymmetric sub-game
First, we note that the formulation of the $sd$ contract adopted by PTY resembles the combination of profits and revenues used by the pioneering works of Fershtman and Judd (Reference Fershtman and Judd1987) and Sklivas (Reference Sklivas1987). Unfortunately, in a delegation model with pollution externalities and environmental tax (set at a timing of the game discussed so far), the revenue formulation of the $sd$
 contract does not allow us to solve for ${\alpha _1}$
 and ${\alpha _2}$
 in closed form at the bonus stage in the asymmetric sub-game. Then, we need to resort to numerical simulations to determine which SPNE endogenously emerges at the contract decision stage in this non-cooperative game. We pinpoint that it is possible to overcome this lacuna and have closed-form expressions allowing analytical characterisations by following the early formulation of the $sd$
 contract outlined by Vickers (Reference Vickers1985) and subsequently adopted in several works, for example, van Witteloostuijn et al. (Reference van Witteloostuijn, Jansen and van Lier2007), Jansen et al. (Reference Jansen, van Lier and van Witteloostuijn2009) and Fanti et al. (Reference Fanti, Gori and Sodini2017a, Reference Fanti, Gori and Sodini2017b), in which the performance measure is based on the sales volume instead of revenues. Indeed, as Jansen et al. (Reference Jansen, van Lier and van Witteloostuijn2007) show, the combination of profits and revenues used by Fershtman and Judd (Reference Fershtman and Judd1987) and Sklivas (Reference Sklivas1987) can be rewritten as a combination of profits and sales volume. We carry out this analysis in section 4 to get closed-form expressions as well as to deepen and clarify (analytically and geometrically) the results presented here. By using the $sd$
 contract based on the sales volume, section 5 also provides first a comparison of the $ed$
 contract and then of the $sd$
 contract with profit maximisation (i.e., the $pm$
 contract), resembling the case in which the owner does not hire any managers and directly chooses all the relevant variables as a profit maximising agent. This will be useful to get a rationale for the designing of the $ed$
 or $sd$
 contract and thus for comparison purposes.
We now turn to the study of the stages of the asymmetric sub-game $ed/sd$ and then add the (first) decision stage.
At the fourth stage of the asymmetric sub-game, manager 1 chooses ${q_1}$ by maximising $O_1^{ed/sd}$
 as given by the expression in (4). Likewise, manager 2 chooses ${q_2}$
 by maximising $O_2^{ed/sd}$
 as given by the expression in (5). The optimal value of output just obtained by manager 1 (resp. manager 2) is substituted into the incentive part of his/her managerial contract $O_1^{ed/sd}$
 (resp. $O_2^{ed/sd}$
 ) to get an expression that should be maximised by manager 1 (resp. manager 2) at the third stage of the game by choosing the abatement effort ${x_1}$
 (resp. ${x_2}$
 ), taking the tax rate t as given. Simultaneously, by replicating the timing schedule used by PTY in the symmetric sub-games, the government sets the emission tax rate by maximising social welfare and by taking the abatement efforts ${x_1}$
 and ${x_2}$
 as given.
We now move from the narrative to the mathematics of the $ed/sd$ sub-game. The first step is manager 1's utility maximisation $O_1^{ed/sd}$
 with respect to ${q_1}$
 and manager 2's utility maximisation $O_2^{ed/sd}$
 with respect to ${q_2}$
 . Then, one gets the following downward-sloping output reaction functions of firm 1 and firm 2 in the $({{q_i},\,{q_j}} )$
 space as a function of the environmental tax rate t and the incentive parameter of the $sd$
 firm (the incentive parameter of the ed firm does not affect the system of best response functions as ${q_1}$
 and ${x_1}$
 enter additively in $O_1^{ed/sd}$
 ), that is:

and

These two expressions reveal that the output reaction functions of both firms in the asymmetric sub-game are similar, differing however in one crucial respect: the incentive parameter applied by the owner designing the $sd$ contract mitigates the negative effects of environmental taxation allowing the manager of the $sd$
 firm to produce more than the manager of the $ed$
 firm. The solution of the system of output reaction functions allows us to get the equilibrium output of firm 1 and firm 2 at the fourth stage of the asymmetric sub-game $ed/sd$
 as a function of the environmental tax rate and the incentive parameter ${\alpha _2}$
 , that is:

and

A direct comparison of the last two equations reveals that the production of the $ed$ is negatively affected by the taxation, and the production of the $sd$
 firm is negatively affected by the taxation if and only if manager 2 is highly rewarded (${\alpha _2} > 1/2$
 ); otherwise, if manager 2 is poorly rewarded (${\alpha _2} < 1/2$
 ), an increase in the tax rate increases the production of the $sd$
 firm. Substituting out the intermediate equilibrium values $\bar{q}_1^{ed/sd}$
 and $\bar{q}_2^{ed/sd}$
 into $O_1^{ed/sd}$
 , $O_2^{ed/sd}$
 and social welfare, one gets the expressions that manager 1, manager 2 and the regulator should maximise. At the third stage of the game, they simultaneously choose the optimal amount of the R&D abatement effort (by taking the tax rate as given) and the optimal tax rate (taking the R&D abatement effort as given), respectively. Then,


and

An increase in the incentive parameter ${\alpha _1}$ reduces the amount of pollution abatement chosen by the manager of the $ed$
 firm, and the incentive parameter of the $sd$
 does not affect the amount of pollution abatement chosen by manager 2, but ${x_1}({{\alpha_1},t} )> {x_2}(t )$
 . In addition, as expected, an increase in the abatement of both firms reduces the extent of the optimal tax rate. Making use of the last three equations, one obtains the (intermediate) equilibrium values of ${x_1}$
 , ${x_2}$
 and t as a function of ${\alpha _1}$
 , ${\alpha _2}$
 computed at the third stage of the game. That is,


and

Now, substituting out $\overline {\bar{x}} _1^{ed/sd}({{\alpha_1},\,{\alpha_2}} )$ , $\overline {\bar{x}} _2^{ed/sd}({{\alpha_1},\,{\alpha_2}} )$
 , and ${\overline {\bar{t}} ^{ed/sd}}({{\alpha_1},\,{\alpha_2}} )$
 into $\bar{q}_1^{ed/sd} ({t,\,{\alpha_2}} )$
 and $\bar{q}_2^{ed/sd}({t,\,{\alpha_2}} )$
 , one gets:

and

The $ed$ delegation contract incentivizes manager 1 to produce less and abate more than manager 2, whose contract is based on the $sd$
 delegation (revenue version). Considering the optimal values computed at the third and fourth stages of the game, the owner of firm 1 (resp. firm 2) maximises profits $\mathrm{\Pi }_1^{ed/sd}$
 (resp. $\mathrm{\Pi }_2^{ed/sd}$
 ) at the second stage by choosing ${\alpha _1}$
 (resp. ${\alpha _2}$
 ). These values do not exist in closed form when the $sd$
 contract is based on a combination of profits and revenues (PTY). However, they only depend on $\gamma$
 , representing the efficiency of the R&D abatement technology.Footnote 4
3.2 The decision stage and the endogenous market structure
To close the model, we resort to numerical simulations keeping in mind that the conditions $0 < \alpha _1^{ed/sd} < 1$ and $0 < \alpha _2^{ed/sd} < 1$
 must hold. Both inequalities are fulfilled when $\gamma > 1.83$
 .Footnote 5 Therefore, by assuming henceforth that $\gamma > 1.83$
 holds for feasibility, at the first stage of the game the owners endogenously design the contract to offer to their managers. Result 1 summarises the outcome of this choice. Let first $\Delta {\Pi _A}(\gamma ): = \Pi _i^{ed/sd} - \Pi _i^{sd}$
 , $\mathrm{\Delta }{\mathrm{\Pi }_B}(\gamma ): = \mathrm{\Pi }_i^{sd/ed} - \mathrm{\Pi }_i^{ed}$
 and $\Delta {\Pi _C}(\gamma ): = \Pi _i^{sd} - \Pi _i^{ed}$
 be the profit differentials of firm i as a function of the R&D efficiency of the abatement technology. Knowing that $\mathrm{\Delta }{\mathrm{\Pi }_A}(\gamma )< 0$
 and $\mathrm{\Delta }{\mathrm{\Pi }_C}(\gamma )< 0$
 irrespective of the size of $\gamma$
 and $\mathrm{\Delta }{\mathrm{\Pi }_B}(\gamma )$
 is positive (resp. negative) if $\gamma < 13.3$
 (resp. $\gamma > 13.3$
 ), where $\gamma \cong 13.3$
 is the value of $\gamma$
 such that $\mathrm{\Delta }{\mathrm{\Pi }_B}(\gamma )= 0$
 , then the following result holds.
Result 1. [1] If $1.83 < \gamma < 13.3$ then ($sd$
 , $sd$
 ) is the unique pure strategy Pareto inefficient Nash equilibrium (prisoner's dilemma). [2] If $\gamma > 13.3$
 then ($sd$
 , $sd$
 ) and ($ed$
 , $ed$
 ) are two pure strategy Nash equilibria, and the $ed$
 payoff dominates $sd$
 (coordination game).
Result 1 has a simple intuitive explanation. The environmental delegation contract has commitment value like the sales delegation contract (based on revenues); however, the environmental delegation (based on tax savings) generates an effect that, in the later stage (i.e., the stage in which managers choose production), makes managers behave more aggressively than under the sales contract. This, in turn, leads to higher abatement and profits than in the $sd$ scenario. The higher the efficiency of the R&D technology ($\gamma \downarrow$
 ), the lower the environmental damage, which in turn implies a lower need for the owner to design a managerial contract including an environmental component. In fact, with efficient technology, the size of the environmental tax is not excessively high, and the owners do not need to incentivize managers for the reduction of the environmental tax base, as the $sd$
 contract performs better than the $ed$
 contract. Therefore, $sd$
 is the dominant strategy of each player. Larger values of $\gamma$
 lead to an indeterminacy though both owners have the incentive to coordinate their strategy unilaterally towards the $ed$
 contract (to get higher profits) in that case.
The key point in order to understand which contract eventually emerges in equilibrium is to consider what happens in the asymmetric sub-game. If one assumes that $\gamma$ – scaling up/down the efficiency of the R&D abatement technology – goes historically for a reduction, i.e., it goes in the direction of efficiency improvements, this means that the $ed$
 contract could have a chance to be designed in a highly-polluted environment in which the R&D abatement technology is at its beginning (the $ed$
 contract payoff dominates the $sd$
 contract). When time goes by, and environmental quality becomes an issue of strict concern, the R&D abatement technology becomes more and more efficient with no need to design an ad hoc managerial contract to incentivise managers to abate pollution. The online appendix clarifies the outcomes of this section with some numerical examples.
4. A reformulation of the $sd$ contract based on sales volume and (endogenous) Nash equilibria

The main purpose of this section is to make the previous analysis robust, deepening the analytical characterisation of the managerial decision game with pollution externalities and emissions taxes.Footnote 6 The lacuna that follows the revenue-based contract can be overcome through an appropriate formulation of the $sd$ contract, as was originally formulated in the influential work of Vickers (Reference Vickers1985) by introducing the sales volume instead of revenues in the incentive part of the contract. Therefore, other things being equal, equation (5) modifies as follows:

The stages of the (sub)game are the same as those outlined in the previous sections. Therefore, the equilibrium outcomes of the sub-game in which both firms play $ed$ remain those summarised in table 1. Table 3 details the main equilibrium outcomes of the symmetric sub-game in which both firms offer the $sd$
 contract in (6), whereas table 4 presents the corresponding outcomes of the asymmetric sub-game in which the owner of firm 1 designs the $ed$
 contract and the owner of firm 2 designs the $sd$
 contract. All the quantities reported in table 3 (including net emissions ${q^{sd}} - {x^{sd}}$
 ) are positive for any $\gamma > 0$
 , $0 < {\alpha ^{sd}} < 1$
 for any $\gamma > 0$
 , and ${t^{sd}} = 0$
 if and only if $\gamma = 0$
 . Likewise, all the quantities reported in table 4 (including net emissions by firm 1, $q_1^{ed/sd} - x_1^{ed/sd}$
 , and net emission by firm 2, $q_2^{ed/sd} - x_2^{ed/sd}$
 ) are positive, $0 < \alpha _1^{ed/sd} < 1$
 for any $\gamma > 0.78077 = ((\sqrt {17} - 1)/4)$
 , $0.8 < \alpha _2^{ed/sd} < 1$
 for any $\gamma > 0$
 , and ${t^{ed/sd}} = 0$
 if and only if $\gamma = 0$
 . The quantity produced by firm 1 is always positive as $\alpha _2^{ed/sd} > 2/3$
 always holds. Definitively, to compare the symmetric and asymmetric sub-game we need to assume that $\gamma > 0.78077$
 holds for feasibility.
Table 3. Equilibrium outcomes when the owners of both firms offer the $sd$ contract based on the sales volume instead of revenues
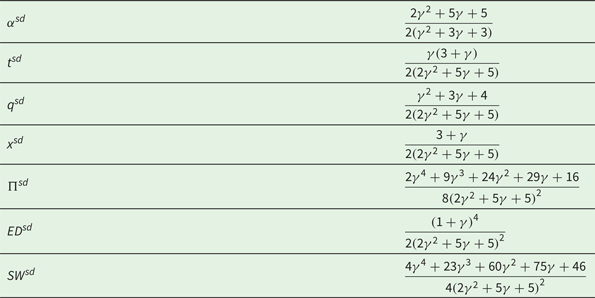
Table 4. Equilibrium outcomes when the owner of firm 1 offers the $ed$ contract and the owner of firm 2 offers the $sd$
 contract based on the sales volume instead of revenues
At the first stage of the game, the owners engage in the designing of the contract to offer their managers. The outcome of this choice is summarised in proposition 1.
Proposition 1. [1] If $0.78077 < \gamma < 7.00647$ then ($sd$
 , $sd$
 ) is the unique Pareto inefficient Nash equilibrium of the game (prisoner's dilemma). [2] If $\gamma > 7.00647$
 then ($sd$
 , $sd$
 ) and ($ed$
 , $ed$
 ) are two pure-strategy Nash equilibria and the $ed$
 payoff dominates $sd$
 (coordination game).
Proof. First, we note that $\mathrm{\Delta }{\mathrm{\Pi }_A}(\gamma )< 0$ and $\mathrm{\Delta }{\mathrm{\Pi }_C}(\gamma )< 0$
 for any $\gamma > 0.78077$
 , whereas the sign of $\mathrm{\Delta }{\mathrm{\Pi }_B}(\gamma )$
 changes depending on the size of $\gamma$
 . In particular, $\mathrm{\Delta }{\mathrm{\Pi }_B}(\gamma )> 0$
 for any $0.78077 < \gamma < 7.00647$
 and $\mathrm{\Delta }{\mathrm{\Pi }_B}(\gamma )< 0$
 for any $\gamma > 7.00647$
 . Then, we have that [1] $\mathrm{\Delta }{\mathrm{\Pi }_A}(\gamma )< 0$
 , $\mathrm{\Delta }{\mathrm{\Pi }_B}(\gamma )> 0$
 and $\mathrm{\Delta }{\mathrm{\Pi }_C}(\gamma )< 0$
 for any $0.78077 < \gamma < 7.00647$
 , and [2] $\mathrm{\Delta }{\mathrm{\Pi }_A}(\gamma )< 0$
 , $\mathrm{\Delta }{\mathrm{\Pi }_B}(\gamma )< 0$
 and $\mathrm{\Delta }{\mathrm{\Pi }_C}(\gamma )< 0$
 for any $\gamma > 7.00647$
 . Q.E.D.
Figure 1 represents the geometrical projection of proposition 1. Figure 2 also shows the equilibrium values of environmental damage and social welfare corresponding to the emergence of Nash equilibria as in proposition 1.

Figure 1. Managerial decision game with pollution externalities and emissions taxes: SPNE when $\gamma$ varies.
Notes: The red region represents the parametric area of unfeasibility. When the abatement technology is relatively efficient ($0.78077 < \gamma < 7.00647$ ), the game is a prisoner's dilemma. When the abatement technology is relatively inefficient, $\gamma > 7.00647,$
 there is indeterminacy, i.e., there exist symmetric multiple SPNE in pure strategies (coordination game) and $ed$
 payoff dominates $sd$
 (coordination game). The vertical black line at $\gamma = 7.00647$
 divides the region in which the game is a prisoner's dilemma (left) from the region in which it is a coordination game (right). The profit differentials of firm i are defined as $\Delta {\Pi _A}(\gamma ): = \Pi _i^{ed/sd} - \Pi _i^{sd}$
 , $\Delta {\Pi _B}(\gamma ): = \Pi _i^{sd/ed} - \Pi _i^{ed}$
 and $\Delta {\Pi _C}(\gamma ): = \Pi _i^{sd} - \Pi _i^{ed}$
 .
.
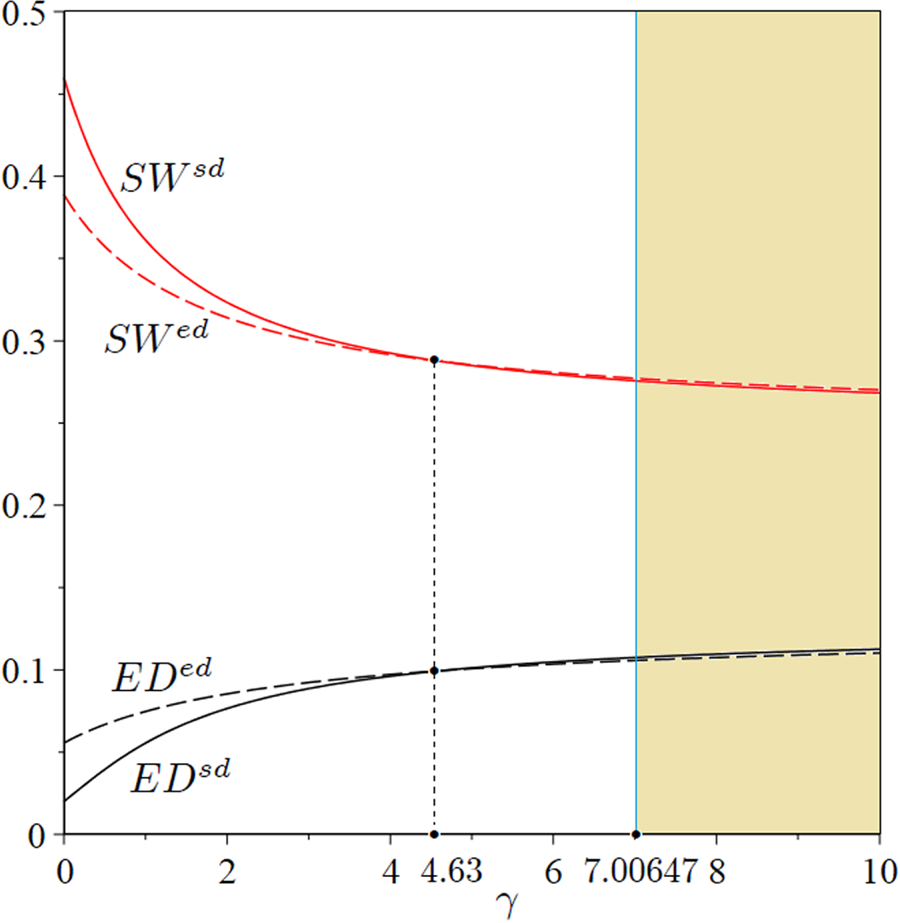
Figure 2. Welfare and environmental damage.
Notes: The white region corresponds to the area of figure 1 in which ($sd$ , $sd$
 ) emerges as the unique Pareto inefficient SPNE of the contract decision game (prisoner's dilemma). The sand-coloured region corresponds to the area of figure 1 in which ($sd$
 , $sd$
 ) and ($ed$
 , $ed$
 ) emerge as multiple pure strategy SPNE of the contract decision game (coordination game).
Figure 2 clearly shows that the $sd$ contract can never lead to a Pareto efficient outcome for the society, whereas the $ed$
 contract can lead to a Pareto efficient outcome for society if firms cooperate to design an environmental managerial contract when the R&D abatement technology is not efficient ($\gamma \uparrow$
 ). Indeed, the $sd$
 contract leads to the highest social welfare and the lowest total and marginal environmental damage when the R&D abatement technology is efficient ($\gamma \downarrow$
 ), a scenario that can possibly be observed in the future; however, firms would be better off with the $ed$
 contract, which however is not the SPNE of the game.
5. Environmental (and sales) delegation versus profit maximisation
This section goes one step further and considers the comparison of the environmental delegation contract with the profit maximisation ($pm$ ) contract (i.e., ${\alpha _i} = 1$
 ) to study whether there exists a strategic incentive for the designing of an environmental-oriented contract. The section does also explicitly analyse the case of the $sd$
 contract (based on sales) versus the $pm$
 contract showing that the endogenous game-theoretic outcome continues to be the Pareto inefficient Nash equilibrium ($sd,\,sd$
 ), as in the literature led by Vickers, Fershtman, Judd and Sklivas without pollution externalities, abatement and environmental taxes. This provides a rationale for the comparison of $ed$
 versus $sd$
 in a game-theoretic setting.
First, we compare the $ed$ scheme outlined in equation (4) versus the $pm$
 scheme, for which the owner (instead of the manager) chooses the quantity at the later stage and the abatement effort at the third stage – simultaneously with the choice of the government about the optimal emission tax rate. The profit function in the symmetric sub-game $pm$
 with pollution externalities, abatement and environmental taxes is:

By also considering the asymmetric sub-game $ed/pm$ , in which only one firm (e.g., firm 1) chooses the $ed$
 contract and the rival (e.g., firm 2) the $pm$
 contract, the payoff matrix is reported in table 5, in which $\mathrm{\Pi }_i^{ed} = \mathrm{\Pi }_j^{ed} = {\mathrm{\Pi }^{ed}}$
 is defined in table 1, $\mathrm{\Pi }_i^{pm} = ({({2{\gamma^2} + 9\gamma + 8} )/8{{({2\gamma + 3} )}^2}} )$
 , $\mathrm{\Pi }_i^{ed/pm} = ({({2{\gamma^2} + 9\gamma + 6} )/2({16{\gamma^2} + 46\gamma + 27} )} )$
 and $\mathrm{\Pi }_j^{ed/pm} = ({16{\gamma^4} + 120{\gamma^3} + 284{\gamma^2} + 260\gamma + 81} )/{({16{\gamma^2} + 46\gamma + 27} )^2}$
 .
.
Table 5. Payoff matrix of the managerial decision game $ed$ versus $pm$
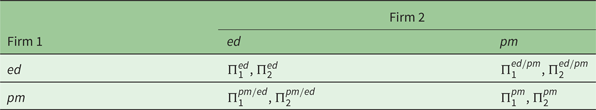
Then, the following proposition holds:
Proposition 2. The unique Pareto efficient Nash equilibrium of the game $ed$ versus $pm$
 is ($ed$
 , $ed$
 ) for any $\gamma > 0$
 (anti-prisoner's dilemma).
Proof. The sign of the profit differentials is $\mathrm{\Delta }{\mathrm{\Pi }_A}(\gamma )> 0$ , $\mathrm{\Delta }{\mathrm{\Pi }_B}(\gamma )< 0$
 and $\mathrm{\Delta }{\mathrm{\Pi }_C}(\gamma )< 0$
 for any $\gamma > 0$
 . Q.E.D.
Second, we compare the $sd$ scheme (based on sales) outlined in equation (6) versus the $pm$
 scheme summarised in equation (7). By considering the asymmetric sub-game $sd/pm$
 , in which only one firm (e.g., firm 1) chooses the $sd$
 contract based on sales and the rival (e.g., firm 2) the $pm$
 contract, the payoff matrix is reported in table 6, in which $\mathrm{\Pi }_i^{sd} = \mathrm{\Pi }_j^{sd} = {\mathrm{\Pi }^{sd}}$
 is defined in table 3, $\mathrm{\Pi }_i^{pm} = ({2{\gamma^2} + 9\gamma + 8} )/8{({2\gamma + 3} )^2}$
 , $\mathrm{\Pi }_i^{sd/pm} = {(2 + \gamma )^2}/8(2{\gamma ^2} + 5\gamma + 4)$
 and $\mathrm{\Pi }_j^{sd/pm} = ({2{\gamma^4} + 9{\gamma^3} + 20{\gamma^2} + 20\gamma + 8} )/8{(2{\gamma ^2} + 5\gamma + 4)^2}$
 .
.
Table 6. Payoff matrix of the managerial decision game $sd$ versus $pm$
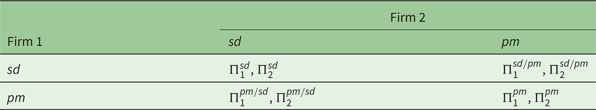
Then, the following proposition holds:
Proposition 3. The unique Pareto inefficient Nash equilibrium of the game $sd$ versus $pm$
 is ($sd$
 , $sd$
 ) for any $\gamma > 0$
 (prisoner's dilemma).
Proof. The sign of the profit differentials is $\mathrm{\Delta }{\mathrm{\Pi }_A}(\gamma )> 0$ , $\mathrm{\Delta }{\mathrm{\Pi }_B}(\gamma )< 0$
 and $\mathrm{\Delta }{\mathrm{\Pi }_C}(\gamma )> 0$
 for any $\gamma > 0$
 . Q.E.D.
The outcomes of proposition 2 and proposition 3 provide the rationale for the designing of the $ed$ contract in a managerial Cournot duopoly, as an alternative to the $sd$
 contract. Both managerial schemes emerge as Nash equilibrium outcomes in a game-theoretic setting when each of them is separately compared with profit maximisation. In fact, each profile ($ed$
 and $sd$
 ) represents a dominant strategy when contrasted with the $pm$
 profile. The only difference is that the Nash equilibrium emerging in the game $ed$
 (resp. $sd$
 ) versus $pm$
 is Pareto efficient (resp. inefficient). This is because in the former case the increase in production and abatement following the managerial behaviour also favours a tax savings in comparison with the owner's behaviour, whereas in the latter case the same remarks emerging in the literature led by Vickers, Fershtman, Judd and Sklivas hold.
However, this $ed$ contract is ineffective when it is contrasted with the $sd$
 contract for the reasons discussed above. Definitively, though there exists an expected incentive for the designing of an environmental-oriented managerial contract as it is strictly preferred to the $pm$
 scenario, this is not in the selfish interest of the owners (when the R&D abatement technology is efficient) that unilaterally prefer to set up a sales contract to their manager to avoid being the only ones to make the lowest possible profit following the lowest production.
6. Conclusions
In a managerial Cournot duopoly with pollution externalities and emission taxes, Poyago-Theotoky and Yong (Reference Poyago-Theotoky and Yong2019) introduce an explicit environmental (tax base reduction) incentive in the compensation scheme. They find that abatement and social welfare (resp. emission taxes) under that kind of environmental delegation contract are higher (resp. lower) than under a standard sales delegation (revenue delegation). The present work has shown that the environmental contract introduced by PTY never arises as the unique SPNE of the non-cooperative managerial game. Indeed, if the green R&D technology is efficient, the sales contract is the unique, Pareto-inefficient Nash equilibrium. Otherwise, if the green R&D technology is inefficient, multiple Nash equilibria in pure strategies exist. Therefore, by extending the model of PTY, in which the managerial contracts are exogenously given, using an appropriate game-theoretic approach this work has shown that a rich spectrum of different contracts representing SPNEs can indeed emerge. Our findings offer policy warnings as an environmental component in managerial contracts that may not need to be included depending on the efficiency of the abatement technology, which should possibly be known to the regulator. In this regard, following the historical pathway of the improvements observed in the existing technology for R&D abatement, designing an ad hoc green contract for managerial firms: (1) is not necessary for the close future, following Buccella et al. (Reference Buccella, Fanti and Gori2022); and (2) is harmful to the environment as the environmental damage generated by the industrial production of the $ed$ firm is larger than that which is generated by the $sd$
 firm when the R&D abatement technology is inefficient, and the conditions for designing the green managerial contract can be in the selfish interest of each firm.
Econometric implications can follow our contribution pinpointing the emergence of sales contracts in firms using an efficient abatement technology.
This line of research can include models with the managerial delegation with cross-ownership and the environment, along the lines of Bárcena-Ruiz and Campo (Reference Bárcena-Ruiz and Campo2012, Reference Bárcena-Ruiz and Campo2017), to test whether the environmental delegation can represent a Nash equilibrium strategy in that case. In addition, the study of models including cooperative environmental delegation (Hirose et al., Reference Hirose, Lee and Matsumura2020; Xu and Lee, Reference Xu and Lee2022) – set within an appropriate game-theoretic framework – can represent a promising agenda as that issue is becoming an industry-wide common phenomenon in the climate change era.
Supplementary material
The supplementary material for this article can be found at https://doi.org/10.1017/S1355770X23000025.
Acknowledgements
The authors gratefully acknowledge two anonymous reviewers of the journal for their valuable comments and suggestions that facilitated a substantial improvement in the quality of the article. Luca Gori acknowledges financial support from the University of Pisa under the ‘PRA – Progetti di Ricerca di Ateneo’ (Institutional Research Grants) – Project No. PRA_2000_64 ‘Infectious diseases, health and development: economic and legal effects’. The usual disclaimer applies. This study was conducted when Domenico Buccella was a visiting scholar at the Department of Law of the University of Pisa.
Financial support
The authors declare that this study was funded by the University of Pisa.
Conflict of interest
The authors declare that they have no conflict of interest.


 Open access