


1. Introduction
Wind transport of sand and dust is a potent erosional force that generates sand dunes and ripples while also filling the sky with suspended dust aerosols. These phenomena can inflict damage to infrastructures, telecommunications and crops, impacting transportation due to reduced visibility and resulting in significant economic losses (Sivakumar Reference Sivakumar2005; Middleton & Kang Reference Middleton and Kang2017; Song et al. Reference Song, Bi, Zhang, Li, Dai, Zhang, Li, Wang, Liang and Feng2022; Liu et al. Reference Liu2023). Therefore, acquiring a comprehensive understanding of the mechanisms behind sand and dust storms (SDS) is essential, where turbulent structures play a dominant role in the transportation of sand and dust. The SDS interact intricately with other non-turbulent motions including gravity waves, solitary waves and low-level jets (Terradellas et al. Reference Terradellas, Soler, Ferreres and Bravo2005; Banta, Pichugina & Brewer Reference Banta, Pichugina and Brewer2006; Sun et al. Reference Sun, Mahrt, Nappo and Lenschow2015). As such, gaining insights into these turbulent features becomes paramount in delving further into the intricate dynamics of SDS. The effect of particles on the coherent structure evolution depends on various factors, including both particle and flow parameters. Due to the complexity of the multiphase flow rather than the single-phase flow, it remains to reach a consensus on the particle effects if only the streamwise vortices are investigated. For example, different influences on the turbulence size and inclination angle are observed under different scenarios (Dritselis & Vlachos Reference Dritselis and Vlachos2008, Reference Dritselis and Vlachos2011; Zhao, Andersson & Gillissen Reference Zhao, Andersson and Gillissen2010; Li et al. Reference Li, Wang, Liu, Chen and Zheng2012). However, the scarcity of multiheight and high-frequency wind and dust data presents a challenge in comprehensively studying the dynamic properties of SDS (Akhlaq, Sheltami & Mouftah Reference Akhlaq, Sheltami and Mouftah2012; Albarakat & Lakshmi Reference Albarakat and Lakshmi2019; Li et al. Reference Li, Huang, Wang and Zheng2021a). The challenge particularly applies to understanding interactions between flow and dust fields, along with the characteristics of coherent structures. This study aims to address these challenges regarding the turbulent models and multiheight interactions in detail, building upon unique observations from the atmospheric surface layer (ASL).
Flow structures with a hierarchical ordering of scales in the wall-normal direction, considerable lifetimes in the streamwise direction and arrangements in both the spanwise and streamwise directions have been employed to demonstrate large-scale coherence in high Reynolds number wall turbulence (Favre, Gaviglio & Dumas Reference Favre, Gaviglio and Dumas1967; Wark & Nagib Reference Wark and Nagib1991; Ganapathisubramani, Longmire & Marusic Reference Ganapathisubramani, Longmire and Marusic2003; Tomkins & Adrian Reference Tomkins and Adrian2003; Hutchins & Marusic Reference Hutchins and Marusic2007; Baars, Hutchins & Marusic Reference Baars, Hutchins and Marusic2017). This large-scale flow structure is most visible in the logarithmic region of the turbulent boundary layer (TBL), where turbulent kinetic energy (TKE) is mostly composed of large-scale energy (Hutchins & Marusic Reference Hutchins and Marusic2007). These coherent structures range in scale from the extent of the very large-scale motions (extending up to 10 $\delta$ in the streamwise direction, where $\delta$ is the boundary layer thickness (Salesky & Anderson Reference Salesky and Anderson2020)) down to the viscosity scale ( $\nu /u_\tau$, where $\nu$ is the kinetic viscosity, and $u_\tau$ is the friction velocity), which represents the smallest scale of turbulence. A thorough reading on coherent structures in laboratory flows can be found in the reviews of Robinson (Reference Robinson1991) and Jiménez (Reference Jiménez2018). The attached eddy hypothesis (AEH) is a theoretical framework for wall-bounded flow that idealizes wall-bounded flow as a set of inertia-driven coherent structures, which are self-similar and randomly scattered in the plane of the wall (Townsend Reference Townsend1976). A recent description by Marusic & Monty (Reference Marusic and Monty2019) explains the basic assumptions and constraints of AEH. According to Perry & Chong (Reference Perry and Chong1982), these coherent formations, or eddies, scale with the distance from the wall, and the height of the eddies follows a geometric evolution based on AEH. Evidence in favour of self-similarity and wall-scaling has been published by the boundary layer community (e.g. Jiménez Reference Jiménez2012; Hwang Reference Hwang2015; Baars et al. Reference Baars, Hutchins and Marusic2017; Marusic, Baars & Hutchins Reference Marusic, Baars and Hutchins2017). Results from Del Alamo et al. (Reference Del Alamo, Jiménez, Zandonade and Moser2006) characterize for the first time the structural organization of the self-similar range of the turbulent logarithmic region. The extraction of instantaneous structures, analysis of their self-similar characteristics and scaling laws of statistics are also well-presented. Lozano-Durán & Jiménez (Reference Lozano-Durán and Jiménez2014) discovered that these eddies grow large, attach to the wall, extend across the logarithmic layer and exhibit geometric and temporal self-similarity, with lifetimes proportional to their size (or distance from the wall). These structures also explain the previously observed symmetry between sweeps and ejections (Lozano-Durán, Flores & Jiménez Reference Lozano-Durán, Flores and Jiménez2012). Hwang & Sung (Reference Hwang and Sung2018) characterized the AEH as offering a ‘unified theory for the asymptotic behaviours of wall turbulence’. Further research by Hwang & Sung (Reference Hwang and Sung2019) revealed that the identified coherent structures are directly connected to the logarithmic velocity law and serve as the structural basis for the inertial layer. In addition to the basis of AEH, Marusic et al. (Reference Marusic, McKeon, Monkewitz and Nagib2010) developed a mathematical model to forecast near-wall turbulence given just large-scale knowledge from the outer boundary layer area. This model has been extended to a refined inner–outer interaction model based on spectral stochastic estimation of turbulence by Baars, Hutchins & Marusic (Reference Baars, Hutchins and Marusic2016). Further, Baars et al. (Reference Baars, Hutchins and Marusic2016) proposed an empirically derived transfer kernel comprising implicit filtering via a scale-dependent gain and phase to capture the coherent portion in the prediction. Inspired by the interactions between near-wall and outer boundary layer regions, we aim to extend the AEH model to describe vertical coherence, thereby exploring coherence features during SDS.
Baars et al. (Reference Baars, Hutchins and Marusic2017) investigated two-point measurements in the wall-normal direction in smooth terrain with well-controlled flow circumstances, where the novel set-up allowed researchers to explore the relationship between outer-region turbulence and the near-wall footprint in the fluctuating velocity spanning a friction Reynolds number range  $Re_{\tau }\sim O(10^3)\unicode{x2013}O(10^6)$. They further showed that the self-similarity in the neutral laboratory zero-pressure gradient TBL is characterized by a streamwise/wall-normal aspect ratio of $AR=\lambda _{x}/\Delta {z} \approx 14$, which was also investigated by Duan et al. (Reference Duan, Zhang, Zhong, Zhu and Li2020) in channel flows. Baidya et al. (Reference Baidya2019) reported that the self-similar wall-attached structures follow a three-dimensional aspect ratio of $14:1:1$ in the streamwise, spanwise and wall-normal directions in high Reynolds number pipe and boundary layer flows. In addition, both Krug et al. (Reference Krug, Baars, Hutchins and Marusic2019) and Li et al. (Reference Li, Hutchins, Zheng, Marusic and Baars2022a) explored the coherence for both velocity and temperature signals in the ASL. They found that the streamwise/wall-normal aspect ratio decays with a logarithmic trend with increasing unstable thermal stratification. More recently, Basley, Perret & Mathis (Reference Basley, Perret and Mathis2019) and Li, Wang & Zheng (Reference Li, Wang and Zheng2022b) explored the wall similarity under roughness surface in laboratory and atmospheric observations, giving that the aspect ratio of coherent structures increases with increasing surface roughness. Previous studies by Zhang, Hu & Zheng (Reference Zhang, Hu and Zheng2018) and Wang, Gu & Zheng (Reference Wang, Gu and Zheng2020) have shown that the dust field possesses similar coherent structures to the fluid field. Given that dust particles adhere to the flow field and share similar structures, the remaining unknown similarity features of aspect ratio for dust field during SDS are identified specifically in the current study.
One of the goals of analysing AEH flow data is to look for scaling laws in the energy spectra (Nickels et al. Reference Nickels, Marusic, Hafez and Chong2005; Baidya et al. Reference Baidya, Philip, Hutchins, Monty and Marusic2017) and wall-normal profiles of turbulent stresses (Marusic et al. Reference Marusic, Monty, Hultmark and Smits2013). The population density of linked eddies is inversely proportional to their height ( $H$), which fluctuates in the range $O(z_{min}) \leq H\leq O(\delta )$, where $z_{min}$ marks the start of the inertial region. The cumulative contribution from the spectrum of linked eddies causes the streamwise turbulence intensities to differ logarithmically as a function of $z$ at any $z\geq z_{min}$. This structure is also illustrated by the semilogarithmic wall-normal decay of the variance of the streamwise velocity. This scaling has already been observed by simulations, experimental investigations and other theoretical arguments (Perry & Abell Reference Perry and Abell1977; Perry, Henbest & Chong Reference Perry, Henbest and Chong1986; Nikora Reference Nikora1999; Katul, Porporato & Nikora Reference Katul, Porporato and Nikora2012; Li, Wang & Zheng Reference Li, Wang and Zheng2021b). In addition to low Reynolds number simulations (Jiménez & Hoyas Reference Jiménez and Hoyas2008; Lee & Moser Reference Lee and Moser2015), experimental datasets (Hultmark et al. Reference Hultmark, Vallikivi, Bailey and Smits2012; Marusic et al. Reference Marusic, Monty, Hultmark and Smits2013) and atmospheric observations (Kunkel & Marusic Reference Kunkel and Marusic2006; Krug et al. Reference Krug, Baars, Hutchins and Marusic2019; Li et al. Reference Li, Hutchins, Zheng, Marusic and Baars2022a) at high Reynolds numbers have indicated that self-similar contributions at the same scale are veiled by non-self-similar contributions, implying that a logarithmic law for $\overline {u^2}^+$ (the symbol $()^+$ indicates wall units) is more persuasive (Rosenberg et al. Reference Rosenberg, Hultmark, Vallikivi, Bailey and Smits2013; Baars & Marusic Reference Baars and Marusic2020b). Notably, Baars & Marusic (Reference Baars and Marusic2020b) separated these two contributions (self-similar and non-self-similar), exposing the near-wall logarithmic growth (of $\overline {u^2}^+$) down to $z^+\sim 80$, where the lower bound was reported by Duan et al. (Reference Duan, Zhang, Zhong, Zhu and Li2020) at $z^+\sim 100$ with a slope of 0.98 $(=A_1)$. The slope of the logarithmic variation of the streamwise variance in wall turbulence is the Townsend–Perry constant (Marusic et al. Reference Marusic, Monty, Hultmark and Smits2013; Baars & Marusic Reference Baars and Marusic2020b). Considering the hierarchy of geometrically self-similar eddy motions that expand through wall-normal separation featuring a logarithmic energy contribution, and a reference point that has been fixed at a near-wall region previously to obtain the wall-attached eddies along all three axis directions, we postulate that self-similar eddies also feature a logarithmic energy distribution during the SDS for components of velocity, temperature and $PM_{10}$. The above review readily demonstrates that the energy profile of wall-attached motions during the SDS in the logarithmic region of turbulent flows has not yet been explicitly quantified.
2. Methodology and experiment
The coherence statistic in signal processing is a tool for analysing the relationship between two signals. It is frequently employed to calculate the power transfer between the input and output of a linear system. If the signals are ergodic and the system function is linear, the causality between the input and output can be estimated using coherence. The coherence between two signals  $x(t)$ and $y(t)$ is defined as
 \begin{equation} \gamma_{L}^{2}(f)\equiv\frac{|\langle{\tilde{X}(f) \tilde{Y}^{*}(f)}\rangle|^{2}}{\langle{|\tilde{X}(f)|^{2}}\rangle \langle{|\tilde{Y}(f)|^{2}}\rangle}=\frac{|\phi_{xy}^{'} (f)|^{2}}{\phi_{xx}(f)\phi_{yy}(f)}.\end{equation}
 Here,  $\tilde {X}(f)=\mathcal {F}[x(t)]$ represents the Fourier transform of signal $x$ in time, and $x$ can be replaced by $y$. The asterisk $*$ indicates the complex conjugate, $\langle \rangle$ denotes ensemble averaging, and $||$ designates the modulus. Specifically, $0\leq \gamma _{L}^{2}\leq 1$ is defined using the linear coherence spectrum (LCS), where $\gamma _{L}^{2}$ is a function of the frequency $f$;
$f$;  $\phi _{xy}^{'}$ is the cross-spectrum; $\phi _{xx}$ and $\phi _{yy}$ are the autospectral densities of signals $x$ and $y$, respectively. A similar analysis between different signals using LCS can be found in Baars et al. (Reference Baars, Hutchins and Marusic2016). Consider a linear system with an impulse response $h_l(t)$ defined as $y(t)=h_l(t) x(t)$. In the Fourier domain, this equation becomes $\tilde {Y}(f)=H_L(f)\tilde {X}(f)$, where $H_L(f)$ is the complex-valued linear system transfer function, generally known as spectral linear stochastic estimation (LSE) (also introduced in Adrian (Reference Adrian1979), Ewing & Citriniti (Reference Ewing and Citriniti1999), Tinney et al. (Reference Tinney, Coiffet, Delville, Hall, Jordan and Glauser2006) and Baars et al. (Reference Baars, Hutchins and Marusic2016)). Hence, for a linear system,
 \begin{equation} H_L(f)=\frac{\phi_{xy}^{'}(f)}{\phi_{xx}(f)}.\end{equation}
The system's gain is intuitively connected to the LCS, scaled by the ratio of input-to-output energies, and can be expressed as follows (Bendat & Piersol Reference Bendat and Piersol2000):
 \begin{equation} |H_L^2(f)|=\gamma_{L}^{2}(f)\frac{\phi_{yy}(f)}{\phi_{xx}(f)}.\end{equation}
 A self-similar hierarchy of wall-attached structures inside the logarithmic zone of a TBL (Baidya et al. Reference Baidya2019; Deshpande, Monty & Marusic Reference Deshpande, Monty and Marusic2019; Marusic & Monty Reference Marusic and Monty2019; Hu, Yang & Zheng Reference Hu, Yang and Zheng2020; Li et al. Reference Li, Hutchins, Zheng, Marusic and Baars2022a) is idealized in figure 1(a). Here, we investigate three hierarchy levels of zones of coherent velocity fluctuations that are randomly positioned, with each hierarchy being represented by a distinct hue. For the sake of simplicity, we define each level's eddy effect volume as having a  $l_x\sim \lambda _x$ and $l_z\sim z$ in the $x$ and $z$ directions, respectively, resulting in the aspect ratio of the streamwise/wall-normal direction as $AR=\lambda _x/\Delta z$. To obtain the coherence between two turbulent signals, the position of $z_R$ should be close enough to the wall. In ASL, $z_R$ was selected at the lowest height and the travel signal $z_T$ is the upper position located in the logarithmic regions of TBL as indicated in figure 1(a) by $z_R$ and $z_T$ to obtain the coherence.

Figure 1. (a) The schematic shows isometric  $x$–
$x$– $z$ plane views of a hierarchy of self-similar wall-attached eddies representing the logarithmic region, presented as simplified parallelograms (not scaled). Three hierarchical levels are considered, each represented by different colours. Vertical arrays are installed with 11 sonic anemometers (squares) and 11 dust monitors (circles) ranging from 0.9 m to 30 m. The heights, referred to as $z_R$ and $z_T$, respectively, are set as the fixed near-wall location at $z=0.9$ m and the travelled heights. Here, $l_x\sim \lambda _x$ and $l_z\sim z$ denote the streamwise and wall-normal extents of the hierarchical level, respectively, with $AR=\lambda _x/\Delta z$ indicating the aspect ratio in the streamwise wall-normal plane. Panels (b–e) indicate the example signals obtained at $z_R=0.9$ m and $z_T=5$ m for the velocity of streamwise component $u$, the spanwise component $v$, the temperature $\theta$ and the $PM_{10}$ concentration $pc$, respectively.
Baars et al. (Reference Baars, Hutchins and Marusic2017) applied the coherence spectrum to streamwise fluctuating velocity signals at a wall-normal position  $z_R$ and a travel signal in the logarithmic region $z_T$ to explore the wall-attached features of turbulent flow. Similar investigations can be found in Krug et al. (Reference Krug, Baars, Hutchins and Marusic2019), Baars & Marusic (Reference Baars and Marusic2020b), Duan et al. (Reference Duan, Zhang, Zhong, Zhu and Li2020) and Li et al. (Reference Li, Hutchins, Zheng, Marusic and Baars2022a). They imply that, as a consequence of the AEH, the coherence magnitude within the self-similar region adheres to
 \begin{equation} \gamma_{L}^{2}=C_{1}{\ln}\left( \frac{\lambda_{x}}{\Delta z} \right) +C_{2}.\end{equation}
 Here,  $C_1$ and $C_2$ are fit constants, with $C_1=0.302$ being a fixed value, and $C_2$ being affected by the stability/roughness/dust conditions. The statistical aspect ratio (in this case streamwise/wall-normal) then follows:
 \begin{equation} AR = \left. \frac{\lambda_x}{\Delta z}\right\vert_{\gamma_{L}^2=0}=\exp\left(\frac{-C_{2}}{C_{1}} \right). \end{equation}
 In neutral turbulent flow at  $Re_\tau \approx 14\,000$ (laboratory data (Baars et al. Reference Baars, Hutchins and Marusic2017)), ${Re_\tau \approx 2000}$ (numerical data, Sillero, Jiménez & Moser Reference Sillero, Jiménez and Moser2013) and $Re_\tau \approx 1.4\times 10^6$ (ASL data, Marusic & Heuer Reference Marusic and Heuer2007), Baars et al. (Reference Baars, Hutchins and Marusic2017) gave $C_2=-0.796$ which results in $AR\approx 14$. In addition, Krug et al. (Reference Krug, Baars, Hutchins and Marusic2019) found that the self-similar scaling applies also to fluctuations of the spanwise velocity $v$ and the static temperature $\theta$, which will be further extended to $PM_{10}$ in the current work.
Using findings from typical tower micrometeorological data, Davenport (Reference Davenport1961) established a trend in the wall-normal coherence of streamwise velocity fluctuation  $u$. The study revealed that turbulent quantities were less coherent as both the vertical separation ( $\Delta z$) and the wavelength ( $\lambda _x=U/f$, where $U$ is the local mean velocity, $f=50$ Hz is the sampling frequency) decreased. Based on this assumption, the coherence should primarily be affected by the ratio of $\Delta z$ to $\lambda _x$ for a certain stability. Davenport (Reference Davenport1961) further provided the following empirical formula, noting that the decline in coherence with rising $\Delta z/\lambda _x$ mimics an exponential decay:
 \begin{equation} \gamma_L^2=\exp \left({-}2a \frac{\Delta z}{\lambda_x} \right),\end{equation}
where  $a$ is a decay parameter. For the vertical coherence $\gamma _L^2$ of the $u$ component under neutral conditions, Davenport (Reference Davenport1961) first stated $a = 7.7$ with regard to the fitting constant in (2.6). Subsequent literature (Pielke & Panofsky Reference Pielke and Panofsky1970; Davison Reference Davison1976; Berman & Stearns Reference Berman and Stearns1977) have reported somewhat revised results and expansions of the concept to spanwise velocity components ( $v$) and the temperature field ( $\theta$). It is well acknowledged that $a$ changes with surface-layer stability, being small in intense convection and large in neutral or stable air. Krug et al. (Reference Krug, Baars, Hutchins and Marusic2019) provided a depiction of (2.6) with $a=23$ (e.g. Naito & Kondo Reference Naito and Kondo1974), which was observed to closely agree with (2.4) and the data under neutral conditions.
The field measurements of the ASL were taken at the Qingtu Lake Observation Array (QLOA) site in western China during the SDS, and detailed information about the field and data collection can be found in Li et al. (Reference Li, Huang, Wang and Zheng2021a). The QLOA is located between two of the largest deserts in China: the Badain Jaran Desert and the Tengger Desert, lying within a dusty belt in the Hexi Corridor. Dust weather in the Hexi Corridor is often caused by intense frontal systems, and the flow field and dust field were measured by the current observation site. The data used in this work included wall-normal arrays of sonic anemometers, which performed synchronous measurements of the three-dimensional turbulent flow field. Campbell CSAT3B instruments installed at heights from  $z_1$ to $z_{11}$ were spaced logarithmically from ${z = 0.9}$ to 30 m ( ${z = 0.9}, 1.71, 2.5, 3.49, 5, 7.15, 8.5, 10.24, 14.65, 20.96, 30$ m) and were employed to acquire time series data of the three components of velocity, as well as the air temperature, at a sampling frequency of 50 Hz. Additionally, dust monitors were installed at corresponding heights to measure the $PM_{10}$ concentration with a frequency of 1 Hz, as illustrated in figure 1(a). Figure 1(b–e) show an example of data obtained from the ASL to illustrate the streamwise velocity component $u$, spanwise velocity component $v$, temperature $\theta$ and $PM_{10}$ concentration $pc$ at $z_R=0.9$ m and $z_T=5$ m. Throughout this study, we only employ the fluctuating components of the turbulence quantities; the streamwise (or longitudinal), spanwise and wall-normal velocity fluctuations are denoted by $u$,
$u$,  $v$ and $w$, respectively, with associated coordinates $x$,
$x$,  $y$ and $z$. Temperature fluctuations are denoted by $\theta$, and $PM_{10}$ concentrations are denoted by $pc$.
$pc$.
Table 1 provides the details of key information for two selected SDS data, where  $u_{\tau }=(-\overline {uw})^{1/2}$ is used to determine the friction velocity at $z=2.5$ m. The duration extends to 2 h, in comparison with previous ASL literature (e.g. Hutchins et al. Reference Hutchins, Chauhan, Marusic, Monty and Klewicki2012; Wang & Zheng Reference Wang and Zheng2016; Krug et al. Reference Krug, Baars, Hutchins and Marusic2019; Li et al. Reference Li, Hutchins, Zheng, Marusic and Baars2022a), to ensure a larger number of ensemble runs while performing spectrum analysis on $PM_{10}$ due to the relatively low sampling frequency. The thermal stability of the ASL is generally characterized by the Monin–Obukhov stability parameter $z/L$ (Obukhov Reference Obukhov1946; Monin & Obukhov Reference Monin and Obukhov1954), where $L=-u_{\tau }^3{\bar {\theta }}/(\kappa {g}\overline {w\theta })$ is the Obukhov length, $\kappa =0.41$ the von Kármán constant, $g$ the gravitational acceleration, $\overline {w\theta }$ the surface heat flux with $w$ and $\theta$ the fluctuating wall-normal velocity and temperature components, $\bar {\theta }$ the mean temperature and $z=2.5$ m is the reference height for evaluating this parameter. In this work, two durations of the dataset were selected to obtain the features of vertical coherence. For the lack of direct measurement of the surface-layer thickness, we assume an estimate for $\delta = 60$ m, following Hutchins et al. (Reference Hutchins, Chauhan, Marusic, Monty and Klewicki2012). Prior to further analysis, the data are adjusted for wind direction and a detrending process is used (see Hutchins et al. (Reference Hutchins, Chauhan, Marusic, Monty and Klewicki2012), Wang & Zheng (Reference Wang and Zheng2016), for details). While detrending is required to eliminate slow temporal patterns in the data, it also affects coherence at extremely long scales, which must be considered when investigating the data. Thus, raw data were used to apply for coherence, but the detrending process ensures the exploration of the scaling of the logarithmic energy profile for wall-attached eddies.
Table 1. The key information relating to the datasets during the SDS. Here  $\bar {U}$ and $\overline {pc}$ were obtained at $z=0.9$ m, indicating the mean velocity and mean $PM_{10}$ concentration. A detailed description of SDS can be seen in Li et al. (Reference Li, Huang, Wang and Zheng2021a). Note that the sampling frequency for $PM_{10}$ is $f=1$ Hz.

The spatiotemporal transformation uses Taylor's hypothesis (Taylor Reference Taylor1938), where the local mean velocity is taken as the convection velocity. Taylor's idea is frequently contested in the literature; however, applying it to the current coherence spectrum research should be successful and may not significantly impact the key findings. The findings of Baars et al. (Reference Baars, Hutchins and Marusic2017) support this claim, as they demonstrate that both temporal and spatial data produce comparable coherence spectra, except for the near-wall area where the predicted convection velocity is no longer valid (Del Álamo & Jiménez Reference Del Álamo and Jiménez2009). Since the primary focus of the current investigation is the outer region, the near-wall inaccuracy associated with the application of Taylor's theory is not considered significant in this context.
3. Results
3.1. Scaling of vertical coherence
Previous studies (Krug et al. Reference Krug, Baars, Hutchins and Marusic2019; Li et al. Reference Li, Hutchins, Zheng, Marusic and Baars2022a,Reference Li, Wang and Zhengb) have examined the aspect ratio of  $AR$ in $u$,
$u$,  $v$ and $\theta$ under stratified and rough-wall ASL. However, a lack of self-similarity investigation on $PM_{10}$ and $u$,
$u$,  $v$ and $\theta$ under dust-carrying flows will be explored in this work. Figure 2 shows the coherence spectrum $\gamma ^2_L$ for the two velocity components, the temperature, and $PM_{10}$ concentration in the unstable case with $z/L=-0.12$. It should be noted that, in this case, we choose normalization with $\Delta z$ since it offers a larger scaling zone. Plotting the findings as shown in figure 2(a–c) examines the self-similarity feature as, in this situation, a collapse of curves at various $\Delta z$ is anticipated, which is also evident in previous ASL results by Krug et al. (Reference Krug, Baars, Hutchins and Marusic2019) and Li et al. (Reference Li, Hutchins, Zheng, Marusic and Baars2022a,Reference Li, Wang and Zhengb). We can fit the formula (2.4) to the data and extract the statistical aspect ratio by locating the scaling region by the area of this collapse (highlighted in red in figure 2). For the coherent spectrum of the $pc$ in figure 2(d), we take the dashed grey line to fit the spectrum based on (2.6) since the lower sampling frequency of the $pc$ can not ensure to obtain the smaller scales of structures. The fit in figure 2(d) matches well with the raw coherent spectrum at $z_T=5$ m, further used to fit the other $\gamma ^2_L$ of the $pc$. Figure 2(e) gives a gradual feature of decay on coherence. Generally, the fitting to the lower heights ( $\Delta z\lesssim 15$ m) can also be considered that the transportation of $PM_{10}$ indicates wall-attached features with similarity. And the aspect ratio of $pc$ is significantly larger than the value of $AR_u\approx 6.2$.

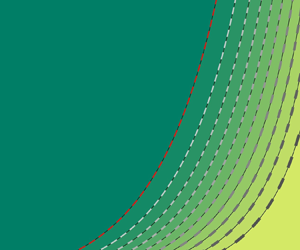
Figure 2. Here  $\gamma ^2_L$ is shown in the range $1.6\ {\rm m} \leq \Delta {z} \leq 29.1$ m (with decreasing $\Delta {z}$ indicated by lighter shades of grey) for the following variables: (a) streamwise component $u$; (b) spanwise component $v$; (c) temperature $\theta$; (e) $PM_{10}$ concentration $pc$, respectively, in the unstable case with $z/L = -0.11$ (D1). In (d), an example of the coherence spectrum $\gamma ^2_L$ for $PM_{10}$ concentration $pc$ at $z_T=5$ m is represented by the solid line, and a fitting line with (2.6) is depicted by the dashed line. The red line is a fit according to (2.4) with $C_1 = 0.302$ fixed; the fitting region used is bounded by $\gamma _{L}^2>0.1$ and $\lambda _x < 200$ m and is indicated in blue lines.
These results are also concluded in table 2, which is also compared with the previous ASL work by Krug et al. (Reference Krug, Baars, Hutchins and Marusic2019) and Li et al. (Reference Li, Hutchins, Zheng, Marusic and Baars2022a) at the corresponding stability conditions. Evidently, the results in datasets D1 and D2 are significantly larger than the value of  $AR$ obtained under unstable conditions from Li et al. (Reference Li, Hutchins, Zheng, Marusic and Baars2022a) but without the influence of dust. In this study, we conducted the first investigation on the self-similarity of $pm$ and further explored the aspect ratio of $pc$. We observed that the value of $AR$ differs between Li et al. (Reference Li, Hutchins, Zheng, Marusic and Baars2022a) and Krug et al. (Reference Krug, Baars, Hutchins and Marusic2019), despite both papers describing the self-similarity under a stratified ASL. Since they share the same field observation site, it demonstrates that sand and dust movement dramatically increases the aspect ratio of coherent structures in the flow. It is worth noting that dust monitors continuously measure particle concentration, and data can only be collected when SDS pass through the measurement site. Additionally, we first present the aspect ratio of the $PM_{10}$, which depicts the similarity features of the dust field.
Table 2. The values of  $AR$ for $u$,
$u$,  $v$,
$v$,  $\theta$ and $pc$ are provided at two stability parameters, $z/L=-0.12$ and $z=-0.11$, for datasets D1 and D2. These corresponding values under the stability conditions are also obtained by fitting $AR=a_1\log (z/L)+a_2$, where $a_1$ and $a_2$ are parameters for the velocity and temperature components, as described in Li et al. (Reference Li, Hutchins, Zheng, Marusic and Baars2022a) and Krug et al. (Reference Krug, Baars, Hutchins and Marusic2019).

Previous studies (Wang et al. Reference Wang, Gu and Zheng2020; Liu, Feng & Zheng Reference Liu, Feng and Zheng2022) suggest that the statistics of turbulent flow undergo changes in sand- or particle-laden two-phase flow. Wang et al. (Reference Wang, Gu and Zheng2020) reveal that the inclination angles of large-scale structures tend to increase with sand concentration in atmospheric flow. Moreover, Liu et al. (Reference Liu, Feng and Zheng2022) discuss the impacts of particle near-wall movements on turbulence statistics in wind tunnel experiments. Both studies imply that the length scales of turbulent coherent structures are somewhat reduced in sand-laden flows. Consequently, the aspect ratio of  $u$,
$u$,  $v$ and $\theta$ is bound to exhibit certain differences. One possible reason is that particulate matters follow the flow field, relying on turbulent motions. Simultaneously, the flow field structures are affected to varying degrees in the streamwise and spanwise directions, resulting in an overall increase in $AR$.
$AR$.
In order to obtain the vertical coherence between two wall-normal signals, an empirically derived transfer kernel comprises implicit filtering to capture the coherent portion in the prediction. Taking the idea from Davenport (Reference Davenport1961) to capture the transfer kernel  $|H_L^2(f)|$ between the signals in the near-wall and logarithmic regions, the empirical expression follows:
 $$\begin{gather} |H_L^2(f)|=\exp \left(c_{1i}-\frac{c_{2i}}{\lambda_x/\delta} \right) ; \quad (i=u,v,\theta \text{ and } pc), \end{gather}$$
 $$\begin{gather}c_{1i}=A_i\log (\Delta z/\delta)+B_i; \quad c_{2i}=C_i\log (\Delta z/\delta)+D_i. \end{gather}$$
 Here,  $c_{1i}$ is the extreme parameter, depicting the asymptote value to $\exp (c_1)$ while $\lambda _x/\delta \rightarrow \infty$. $c_{2i}$ is a decay parameter, where $i=u,v, \theta$ and $pc$. Meanwhile, the normalized parameters $c_{1i}$ and $c_{2i}$ are functions of $\Delta z/\delta$, constrained by $A_i$, $B_i$, $C_i$ and $D_i$.
Figure 3 shows the linear gain  $|H_L^2(f)|$ as a function of $\lambda _x/\delta$ for $u$,
$u$,  $v$,
$v$,  $\theta$ and $pc$ at (figure 3a) $\Delta z/\delta =(z_2 - z_1)/\delta =(1.71-0.9)/60$ and (figure 3b) $\Delta z/\delta =(z_5 - z_1)/\delta =(5-0.9)/60$. The solid-coloured lines represent the linear gain obtained from (2.3), and the corresponding dashed-coloured lines are fitted by (3.1a). As can be seen from the figure, significant matches are indeed observed for all quantities plotted. At lower wavelengths, the kernel of linear gain $|H_L^2(f)|$ reaches zero, indicating that there is no coherence in this region with no coherent energy between inner and outer signals. For the larger wavelengths, the formula (3.1a) depicts the trend to asymptote determined by parameter $c_1$. Notably, the fitting to $pc$ shows the extending estimation at lower wavelengths due to the lower sampling frequency. It should be noted that the linear gain $|H_L^2(f)|$ varies across $u$,
$u$,  $v$,
$v$,  $\theta$ and $pc$ due to their distinct coherence levels, intuitively linked to the LCS (2.3), caused by variations in $AR$. In the case of $pc$, the gain is biased towards larger wavelengths, with a lower maximum gain value compared with the other three components due to weaker coherence of corresponding scales, which is evident from the larger value of $AR$. Since the linear gain $|H^2_L(f)|$ of $pc$ and $\theta$ are smaller than $u$ and $v$, it can be inferred that the dust and temperature do not follow the flow as closely. As $\Delta z$ increases, the $|H_L^2(f)|$ of $\theta$ and $pc$ decrease significantly, demonstrating that the followability of these two parameters in the normal direction is weaker, particularly for $pc$.
$pc$.

Figure 3. The linear gain  $|H_L^2(f)|$ is presented for the $z_R$ and $z_T$ signals of $u$,
$u$,  $v$,
$v$,  $\theta$ and $pc$, respectively, in (a) $\Delta z/\delta =(z_2 - z_1)/\delta$ and (b) $\Delta z/\delta =(z_5 - z_1)/\delta$ by solid coloured lines. The corresponding dashed lines represent fitting lines for $|H_L^2(f)|$ as per (3.1a). The stability parameter is $z/L=-0.11$ (D2).
Once the  $c_1$ and $c_2$ values are obtained at a certain wall-normal offset $\Delta z$, the parameters for $A$,
$A$,  $B$,
$B$,  $C$ and $D$ in (3.1b) are easily determined. Figure 4 shows the parameters $c1$ and $c2$ as a function of $\Delta z/\delta$. An empirical parametric equation is fitted to the log–linear trend of SDS data to model the variation. Considering the influence of the current flow from dust-flow interaction and buoyancy-driven effects, the parameters are expected to be explored for the pure shear flow or stratified flow, and even the effects of the Reynolds number could be considered in the future.


In summary of the parameters in (3.1b), table 3 gives a comparison of  $A$,
$A$,  $B$,
$B$,  $C$ and $D$ at $z/L=-0.12$ and $z/L=-0.11$. Generally, the variation of $c_1$ and $c_2$ shows the same trends in both datasets. Meanwhile, the parameters $c_1$ of the velocity components $u$ and $v$ share the same increasing trend, contrary to the temperature $\theta$ and $pc$. Additionally, the parameters are expected to be compared under neutral conditions to reveal the influence of dust and buoyancy on the features of input–output interactions of the flow.
Table 3. The values of  $A$,
$A$,  $B$,
$B$,  $C$ and $D$ for $u$,
$u$,  $v$,
$v$,  $\theta$ and $pc$ in (3.1b) are provided at $z/L=-0.12$ and $z/L=-0.11$.

To exhibit the kernel of linear gain  $|H_L^2(f)|$ on different wavelengths $\lambda _x/\delta$ and wall-normal offsets $\Delta z/\delta$, figure 5 indicates the contour plot of $|H_L^2(f)|$ for (figure 5a) $u$, (figure 5b) $v$, (figure 5c) $\theta$ and (figure 5d) $pc$, respectively. The red dashed lines correspond to $|H_L^2(f)|=0.1$, and the decreasing values are represented by lighter shades of dashed grey lines. As can be seen, larger wavelengths and lower wall-normal offsets present higher values of $|H_L^2(f)|$ for all components. Generally, the velocity components $u$,
$u$,  $v$ and temperature $\theta$ show great similarity in the variation trend with respect to $\lambda _x/\delta$ and $\Delta z/\delta$. The magnitude of $|H_L^2(f)|$ for $pc$ is much lower than for other components, which may reflect that the ability of dust to follow the flow field determines the energy transfer in input–output signals.

Figure 5. Contour plots of  $|H_L^2(f)|$ based on (3.1a), (3.1b) are shown for (a) $u$, (b) $v$, (c) $\theta$ and (d) $pc$, respectively, with decreasing values represented by lighter shades of dashed grey lines. The parameters are provided in table 3 at $z/L=-0.12$ (D1). Contour line levels range from 0.1 to 1 with an increment of 0.1, and the red lines correspond to $|H_L^2(f)|=0.1$.
3.2. Scaling of logarithmic energy profile for wall-attached eddies
The coherence of a linear system,  $\gamma _L^2$, therefore represents the fractional part of the output signal power that is produced by the input at that frequency. We can also view the quantity ( $1-\gamma _L^2$) as an estimate of the fractional power of the output that is not contributed by the input at a particular frequency. This naturally leads to the definition of the coherent/incoherent output spectrum,
 $$\begin{gather} \phi_{uu}( z_T; \lambda_{x}) =\underbrace{(\gamma_{L}^2)\phi_{uu}( z_T; \lambda_{x})}_{{coherent}}+\underbrace{(1-\gamma_{L}^2)\phi_{uu}( z_T; \lambda_{x})}_{{incoherent}}, \end{gather}$$
 $$\begin{gather}\overline{u^2}^+( z_T)|_{{coherent}} = \int_{0}^{\infty} (\gamma_{L}^2)\phi_{uu}( z_T; \lambda_{x}) \,{\rm d}{\lambda_{x}}, \end{gather}$$
 $$\begin{gather}\overline{u^2}^+( z_T)|_{{incoherent}} = \int_{0}^{\infty} (1-\gamma_{L}^2)\phi_{uu}( z_T; \lambda_{x}) \,{\rm d}{\lambda_{x}}. \end{gather}$$
 Here,  $\overline {u^2}^+(z_T)|_{{coherent}}$ corresponds to the energy of motions attached to the wall; otherwise, $\overline {u^2}^+(z_T)|_{{incoherent}}$ reflects the detached portion. Following the separation of the coherent and incoherent portions of the streamwise turbulence intensities, the LCS can be used as a wavelength-dependent filter for decomposing $\phi _{uu}$ into stochastically coherent and incoherent portions relative to the signal $u(t,z_R)$, as demonstrated in the previous work by Baars & Marusic (Reference Baars and Marusic2020a).
The input signal is convolved with a first-order transfer kernel,  $H_L(f)$, to create the output. Only the linear mechanism of energy transfer is accounted for by the convolution, as the output is proportionate to the input. The analysis permits nonlinear energy transfer when higher-order terms in (3.3a) and (3.3b) are retained. Higher-order estimating approaches have been the focus of several investigations in wall-bounded turbulence. One noteworthy example is the formulation by Naguib, Wark & Juckenhöfel (Reference Naguib, Wark and Juckenhöfel2001) of a time-domain quadratic scheme that included estimates of the velocity field in a TBL given surface pressures as an input; their stochastic estimates improved upon the addition of the quadratic elements. Additionally, the reader is directed to the works mentioned above as well as the discussion in Baars & Tinney (Reference Baars and Tinney2014) for information on the specifics of higher-order approaches. The extraordinary concordance between LSE and conditionally averaged fields in TBL flow, which has applicability to the current ASL flow, was highlighted in Adrian, Moin & Moser (Reference Adrian, Moin and Moser1987) and Baars et al. (Reference Baars, Hutchins and Marusic2016).
While the transfer gain embeds the scaling of each Fourier component in the estimate, the shift of each Fourier mode is embedded in the phase, which yields the LSE in (3.3a). For LSE, we use a combination of the filtered gain factor and the original phase to form a new kernel in (3.3a). Although an inconsistent phase exists at the smaller wavelengths, it will not impact the estimation due to the zero-valued gain factor at these incoherent wavelengths. Finally, the time-domain conditional estimate is obtained by the inverse Fourier transform for both ‘with phase’ and ‘without phase’ in the form of (3.3a) and (3.3b). Meanwhile, the Fourier spectrum of the predicted signal  $y_{{LSE}}(t)$ by LSE can be written as (3.3c), further the turbulent intensity for $y_{{LSE}}(t)$ acquired in (3.3d):
 $$\begin{gather} y_{{LSE}}(t)=\mathcal{F}^{{-}1}(H_L \mathcal{F}[x(t)] ) \quad \text{(with phase)}, \end{gather}$$
 $$\begin{gather}y_{{LSE}}(t)=\mathcal{F}^{{-}1}(|H_L| \mathcal{F}[x(t)] ) \quad \text{(without phase)}, \end{gather}$$
 $$\begin{gather}\phi_{uu}( z_T; \lambda_{x})|_{{LSE}} = |\mathcal{F}[y_{{LSE}}(t)]|^2, \end{gather}$$
 $$\begin{gather}\overline{u^2}^+( z_T)|_{{LSE}} = \int_{0}^{\infty} \phi_{uu}( z_T; \lambda_{x})|_{{LSE}} \,{\rm d}{\lambda_{x}}. \end{gather}$$
By connecting to (3.2b), a stochastic estimate of the output's energy spectrum can be expressed as (3.3d), which yields to
 \begin{equation} \phi_{uu}( z_T; \lambda_{x})|_{{LSE}}=|H_L^2(f)| \phi_{uu}( z_R; \lambda_{x})=\gamma_L^2\phi_{uu}( z_T; \lambda_{x}). \end{equation}
 It is the equivalent form of (2.3). This implies that the amount of energy of  $z_T$ that can be reconstructed via an LSE procedure, from input $z_R$, is equal to the measured spectrum at $z_T$, multiplied by $\gamma _{L}^{2}$, which is also applied to the TBL in Baars et al. (Reference Baars, Hutchins and Marusic2017) and Baars & Marusic (Reference Baars and Marusic2020a). It should be noted that (3.4) includes not only wall-attached self-similar motions but also wall coherent motions scaled by the outer scale (i.e. wall-attached non-self-similar motion) which is discussed in the previous works (Baars & Marusic Reference Baars and Marusic2020a; Deshpande et al. Reference Deshpande, Chandran, Monty and Marusic2020; Hwang, Lee & Sung Reference Hwang, Lee and Sung2020). Moreover, Davenport (Reference Davenport1961) implies the possibility of self-similar motions among wall-incoherent motions (Krug et al. Reference Krug, Baars, Hutchins and Marusic2019). The detached self-similar structures in several studies (Marusic & Monty Reference Marusic and Monty2019; Yoon et al. Reference Yoon, Hwang, Yang and Sung2020) have also been discussed.
Figure 6 shows the fluctuations of the measured signals in grey and the constructed output signals by (3.3b) in black. The gain function in figure 3 and (2.2) can be interpreted as an experimentally calculated scale filter because it shows a steady roll-off. As suggested by Baars et al. (Reference Baars, Hutchins and Marusic2016), the LSE eliminates the need for an a priori choice of a separation scale, which is necessary for large-wavelength pass-filtering of the input and output signals. Scaling the transfer kernel gain allows for the prediction of a filter that retains only the coherent scales of the acquired input.

Figure 6. The figure displays time series data at  $z/L=-0.12$ (D1), with the measured signals represented in grey and the corresponding constructed output signals shown in black. The construction employs a first-order transfer kernel, as defined by (3.3b). The values of $u'^{+}$, $v'^{+}$, $\theta '^{+}$ and $pc'^{+}$ are normalized by their respective standard deviations.
Based on the empirical fitting in (3.1a) and (3.3b), a premultiplied energy spectrum of the conditional estimate is shown in figure 7, alongside the raw output spectra and estimated spectrum by LSE procedure. In figure 7, arbitrary input–output pairs of dataset  $z_R=0.9$ m to $z_T=5$ m for $u$,
$u$,  $v$,
$v$,  $w$ and $pc$, are chosen to illustrate the LSE of the premultiplied spectrum, where the process is called LSE-based in the current study. The smaller wavenumber (corresponding to larger scales) of the spectrum is indicated in figure 7. In other words, the linearly estimated spectrum constitutes less energy due to the lack of perfect coherence (the visual implication of (2.2)).

Figure 7. Premultiplied energy spectra of the output signal at  $z_T=5$ m, with the raw signal depicted in grey and the corresponding smoothed signal shown in blue at $z/L=-0.12$ (D1). The signals are decomposed into coherent contributions represented in green, relative to (3.2a). Panels (a–d) correspond to $u$,
$u$,  $v$,
$v$,  $\theta$ and $pc$, respectively.
Townsend (Reference Townsend1976) and Perry & Chong (Reference Perry and Chong1982) established the theory that the interior part of the inertial region requires a logarithmic profile for the streamwise turbulence intensities, giving a Townsend–Perry constant  $A_1=1.26$ to depict the slope of the logarithmic profile, which has been supported by Marusic et al. (Reference Marusic, Monty, Hultmark and Smits2013). According to Townsend's AEH, the wall-normal logarithmic decay of turbulence intensity can be extended to the logarithmic decay of wall-attached turbulence intensity. More recently, Li et al. (Reference Li, Wang and Zheng2021b) also support the logarithmic decay of turbulence intensity for wall-attached eddies in the spanwise direction. For the LSE-based turbulence intensities for $u$,
$u$,  $v$,
$v$,  $\theta$ and $pc$, we postulate that coherent and incoherent portions also feature a logarithmic energy distribution as follows:
 $$\begin{gather} \overline{u^2}^+( \Delta z) = B_{1}-A_{1}\ln(\Delta z/\delta), \end{gather}$$
 $$\begin{gather}\overline{u^2}^+( \Delta z)|_{{coh}} = P_{c}-Q_{c}\ln(\Delta z/\delta), \end{gather}$$
 $$\begin{gather}\overline{u^2}^+( \Delta z)|_{{incoh}} = P_{i}-Q_{i}\ln(\Delta z/\delta), \end{gather}$$
where  $A_1 = 1.26$ represents the Townsend–Perry constant under neutral conditions for the streamwise velocity component, and $Q_{c}$ and $P_{c}$ denote the fitting parameters governing the self-similar logarithmic behaviour of LSE-based turbulence intensities (corresponding to the coherent portions). Here $Q_{i}$ and $P_{i}$ are fitting parameters used to characterize the logarithmic behaviour of the incoherent portions.
Significantly, the value assigned to  $A_1$ has undergone significant alterations over time. A key aspect contributing to this discrepancy is that (3.5a) is confined to attached-eddy turbulence exclusively, while measures of the total streamwise TKE encompass additional contributions. Thus far, our understanding of turbulent intensity scaling within the logarithmic region, as articulated by the AEH, has been well-established. We firmly believe that the coherent component in the current signal decomposition primarily comprises vortex structures exhibiting self-similarity in scale. Previous investigations by Marusic & Kunkel (Reference Marusic and Kunkel2003), Kunkel & Marusic (Reference Kunkel and Marusic2006) and Wang & Zheng (Reference Wang and Zheng2016) have highlighted that turbulent energy, particularly at elevated Reynolds numbers in atmospheric flows, adheres to a logarithmic law. This body of evidence indicates that turbulent energy in flows governed by attached eddies approximately adheres to the principles of the AEH within the logarithmic region.
In our current study, we operate under the assumption that attached eddy structures predominate in  $\overline {u^2}$ within atmospheric observations, thereby leading to the logarithmic behaviour observed in the coherent component. Contributions from different eddy types to inner flow-scaled premultiplied $u$-spectra, with scaling and overlap regions following Perry et al. (Reference Perry, Henbest and Chong1986), where these contributions are referred to as Type A, B and C energy contributions (Perry & Marusic Reference Perry and Marusic1995; Marusic & Monty Reference Marusic and Monty2019). Type-A eddies are attached and self-similar, and only these are part of the AEH. In the context of low wavenumbers. Type-B energy is postulated to originate from detached motions, which encompasses Type-C energy emanating from Kolmogorov scales and small-scale detached eddies. Should we postulate that the behaviour of the incoherent component follows a logarithmic trajectory, it can be expressed as (3.5c). Hence, the incoherent component should also adhere to a logarithmic pattern: $P_{i} = B_{1} - P_{c}$ and $Q_{i} = A_{1} - Q_{c}$, a proposition supported by the parameters illustrated in figure 8 and table 4. Additionally, analogous findings regarding the logarithmic distribution for both coherent and incoherent components are evident in Li et al. (Reference Li, Wang and Zheng2021b). It should be emphasized that the parameters adhere to a relationship based on $A_1 = Q_c + Q_i$.

Figure 8. Turbulence intensity profiles along the wall-normal offset, with the raw, coherent (Coh) and incoherent (Incoh) depicted in grey, green and blue, respectively, at  $z/L=-0.12$ (D1). The dashed lines represent fitting lines based on (3.5a), (3.5b) and (3.5c), respectively. Panels (a–d) correspond to $u$,
$u$,  $v$,
$v$,  $\theta$ and $pc$, respectively.
Table 4. The fitting parameters of the slope  $A_1$, $Q_c$ and $Q_i$ for $u$,
$u$,  $v$,
$v$,  $\theta$ and $pc$ in (3.5a), (3.5b) and (3.5c) are provided for two stability conditions, $z/L=-0.12$ and $z/L=-0.11$, comparing with the neutral conditions by Marusic et al. (Reference Marusic, Monty, Hultmark and Smits2013) and Baars & Marusic (Reference Baars and Marusic2020b).

Figure 8 gives turbulence intensity profiles for  $u$,
$u$,  $v$,
$v$,  $\theta$ and $pc$ along the wall-normal offset $\Delta z/\delta$. The raw signal and LSE-based turbulence intensities are fitted as grey, green and blue lines based on (3.5a), qs (3.5b) and (3.5c), respectively. The log–linear manner is obvious to see for all quantities, being evident as a proper way to depict the scaling law.
The variations in  $A_1$, $Q_c$ and $Q_i$ for $u$,
$u$,  $v$,
$v$,  $\theta$ and $pc$ based on (3.5a) and (3.5b) for datasets D1 and D2 are presented in table 4. Obviously, the slope of turbulence intensity for LSE-based $Q_c$ is much bigger than $A1$ for $u$ and $v$. On the contrary, the slope of $\theta$ and $pc$ for $A_1$ is somewhat larger. We also give a comparison of $A_1$ and $Q_c$ for $u$ under neutral condition with Marusic et al. (Reference Marusic, Monty, Hultmark and Smits2013) and Baars & Marusic (Reference Baars and Marusic2020b) to indicate the difference of parameters obtained during SDS. It is necessary to consider abundant atmospheric features (e.g. buoyancy, roughness, dust emission) while arguing for self-similarity in high Reynolds numbers. Consequently, it would be helpful to understand how the logarithmic decay of turbulence intensity changes under increasing buoyancy conditions. For the current study, the slope of the logarithmic decay of turbulence intensity for wall-attached eddies during SDS is also influenced by a varied Townsend–Perry constant in neutral shear flow, as discussed by Baars & Marusic (Reference Baars and Marusic2020b), with the additional consideration of buoyancy and dust field effects.
4. Conclusion
We have demonstrated the implications of Townsend's AEH for the coherence trend, which is also supported by turbulence during the SDS. The self-similarity assumptions/hypotheses do seem to hold for  ${PM_{10}}$ data at lower heights. The aspect ratio for ${PM_{10}}$ in the streamwise/wall-normal plane ( $AR_{pc}$) is much larger than the aspect ratio for velocity and temperature components. Following the idea from Davenport (Reference Davenport1961), this work derived an empirical transfer kernel $|H_L^2(f)| = \exp (c_1 - c_2\delta /\lambda _x)$ to depict the coherence between the near-wall reference position and the travelled signal in higher heights for $u$,
$u$,  $v$,
$v$,  $\theta$ and $pc$. After fitting the transfer kernel as a function of wall-normal offset ( $\Delta z$) and wavelength ( $\lambda _x$), the contour features of $|H_L^2(f)|$ for all four components indicate that larger wavelengths and lower wall-normal offsets present higher values. The eddies are distinguished as coherent and incoherent by the LCS. Upon separating, the energy profile for wall-attached eddies for $u$,
$u$,  $v$,
$v$,  $\theta$ and $pc$ all obey the log–linear manner, giving a slope larger than the Townsend–Perry constant ( ${\approx }0.98$ from Baars & Marusic (Reference Baars and Marusic2020b)) during the SDS.
The established logarithmic behaviour of second-order statistics proposed by this paper is beneficial for improving existing wall models in numerical simulations. One direct application is to assess the simulated results. Due to the fact there is lack of information for atmospheric boundary layer flow at various Reynolds number, the given logarithmic law for the second-order moments (i.e.  $\overline {u^2}^+$, $\overline {\theta ^2}^+$, etc) can be utilised to appraise the near wall behaviour of simulated flow, thermal and scalar quantities via either Reynolds-averaged Navier–Stokes or large-eddy simulation (LES) at different Reynolds number. For instance, Stevens, Wilczek & Meneveau (Reference Stevens, Wilczek and Meneveau2014) assessed the performance of LES for the generalized logarithmic law of second- and high-order moments via AEH (Marusic et al. Reference Marusic, Monty, Hultmark and Smits2013; Meneveau & Marusic Reference Meneveau and Marusic2013). This serves as an extra guide for the accuracy of numerical simulations, apart from comparing the mean profiles of velocity, temperature and scalar fields. Moreover, in term of the prediction of the small particle dispersion, it is also interesting to incorporate the effect of non-uniform TKE along wall-normal direction (Gorlé et al. Reference Gorlé, van Beeck, Rambaud and Van Tendeloo2009), such as approximating the inner scaled TKE $\simeq 3/2\overline {u^2}^+$.
As a final note, while the current study is confined to vertical coherence, particularly on the lower sampling frequency of  $PM_{10}$ data, expanding the similarity to SDS events strengthens predictions and applicability to wall-attached features.
Acknowledgements
We express our sincere gratitude to X. Xu for providing constructive discussion. The authors also appreciate the valuable comments made by the anonymous referees which helped to improve both the quality and the presentation of this paper.
Funding
We acknowledge support from the Scientific Research Foundation of Chongqing University of Technology (2022ZDZ017) and the Youth Project of Science and Technology Research Program of Chongqing Education Commission of China (KJQN202201141).
Declaration of interests
The authors report no conflict of interest.


