


The domestic horse, Equus Caballus, is an evolutionary successor of grazing herbivores, whose survival was closely related to the speed and endurance necessary to escape predators and search for food. Since its domestication, man has used selective breeding to enhance performance capabilities of equids, so that they can fulfil their important role in human civilisation( Reference Waller and Lindinger 1 ). This has made the horse a valuable animal model for studying exercise physiology.
In modern days, the horse has become an extraordinary ‘athlete’, exercised for a broad range of sporting activities (racing, endurance rides, show jumping, dressage, 3-d eventing, heavy draught work, polo, reining, cutting and competitive driving, as well as pleasure riding)( Reference Waller and Lindinger 1 ), which may be associated with serious muscle overloading and an increased risk of injuries. This concerns especially the top-level competitors that are exposed to maximal training loads to achieve even a tiny increase in performance; however, even this small edge over competitors may result in winning the competition( Reference Harris and Harris 2 ).
This explains the growing demand for alternative treatments that may help improve equine muscle performance and avoid injury. One of these is supplementation with β-hydroxy-β-methylbutyrate (HMB), a metabolite of the essential branched-chain amino acid leucine( Reference Wilson, Fitschen and Campbell 3 ). The benefits of HMB supplementation on muscle metabolism have been demonstrated in various species, under physiological as well as pathological conditions( Reference Wilson, Fitschen and Campbell 3 , Reference Szcześniak, Ostaszewski and Fuller 4 ). Previous studies have indicated that HMB may affect muscle metabolism and growth by at least six different mechanisms of action, including attenuation of protein degradation( Reference Ostaszewski, Kostiuk and Balasinska 5 ), increased protein synthesis( Reference Smith, Mukerji and Tisdale 6 ), protection of sarcolemma( Reference Nissen and Abumrad 7 ), inhibition of apoptosis( Reference Kornasio, Riederer and Butler-Browne 8 ), enhancement of somatotrophic axis function( Reference Tatara 9 ) and myogenic cell activation( Reference Fernyhough, Helterline and Vierck 10 ). Recent evidence has indicated additional benefits of HMB supplementation related to energy metabolism, including improved aerobic performance( Reference Vukovich and Dreifort 11 ) as well as increased fat loss with exercise( Reference Bruckbauer, Zemel and Thorpe 12 ); however, the underlying mechanisms are poorly understood.
Despite the large amount of literature linked to HMB, only two reports have supported anecdotal data showing HMB’s benefits in thoroughbred racing horses. In one of them, exercising thoroughbred race horses receiving daily 15 g Ca salt of HMB during a 16-week training season showed a significant decrease in post-exercise blood creatinine phosphokinase and lactate levels over both training and racing seasons( Reference Ostaszewski, Kowalska and Szarska 13 ). Miller et al.( Reference Miller, Sandberg and Fuller 14 ) observed similar results when supplementing racing horses with 10 g of HMB daily, with a significantly improved win rate after the 1st month of racing. Taken together, the present experiment meets the demand for more detailed studies concerning HMB’s effectiveness in horses.
In adult skeletal muscle, regeneration and hypertrophy depend on the activation of mononucleated, muscle precursor cells called satellite cells (SC)( Reference Mauro 15 ), embedded between the sarcolemma and the basement membrane of muscle fibres. Previous in vitro and in vivo studies indicate that HMB may activate SC( Reference Kornasio, Riederer and Butler-Browne 8 , Reference Fernyhough, Helterline and Vierck 10 , Reference Alway, Pereira and Edens 16 , Reference Kao, Columbus and Suryawan 17 ), but the mechanism underlying this action remains unclear. Some evidence suggests that HMB regulates the expression of myogenesis-related genes( Reference Kornasio, Riederer and Butler-Browne 8 ); however, until now, no one has demonstrated any effect of HMB on global gene expression.
The horse is a valuable animal model for studying exercise physiology. Gene expression determines most of the phenotype; therefore, the present study focused on revealing the molecular background of HMB action in equine skeletal muscle by investigating the impact of HMB on global gene expression in differentiating equine satellite cells (ESC) in vitro. To our knowledge, this is the first study where HMB’s trancriptomic profile was described. This in vitro model can help identify and better understand the potential therapeutic options to promote muscle regeneration and energy metabolism in horses and other mammals.
Methods
Cell culture
Media and reagents
The following materials were used during cell culture: the Ca salt (monohydrate) of HMB (Ca-HMB) was purchased from Metabolic Technologies; Dulbecco’s Modified Eagle Medium (DMEM) (1×) with glutamax, fetal bovine serum (FBS), horse serum (HS) and antibiotics (AB) – penicillin–streptomycin and fungizone – were purchased from Gibco, Life Technologies; penicillium crystalicum (AB) was purchased from Polfa Tarchomin; PBS, protease from Streptomyces griseus and DMSO were purchased from Sigma Aldrich. Tissue culture flasks Primaria (25, 75 cm2) and Collagen I Cellware six-well plates were purchased from Becton Dickinson. Ca-HMB was transformed to the acid form by acidification with 1 N-HCl. HMB was then extracted four times with diethyl ether. The pooled organic layer was dried under vacuum for 24 h at 38 °C. The resulting free acid was 99 % HMB as assessed by HPLC.
Muscle sampling and satellite cells isolation
Semitendinosus muscle samples were collected ex vivo from six horses (6-month-old, healthy colts). Muscle sampling and ESC isolation are described in detail by Szcześniak et al.( Reference Szcześniak, Ciecierska and Ostaszewski 18 ). In brief, semitendinosus muscle samples were dissected free of surrounding tissues, sliced, washed in PBS with decreasing antibiotics concentration, suspended in FBS with 10 % DMSO, cooled to −80°C and stored in liquid N2. Before isolation, the samples were thawed, centrifuged and washed three times with PBS along with antibiotics. Samples were incubated with DMEM/AB/protease from S. griseus and sieved in order to separate tissue debris. The filtrates were centrifuged three times, re-suspended in proliferation medium (10 %FBS/10 %HS/DMEM/AB) and transferred to polypropylene Petri culture disks. One-and-a-half hours of preplating was performed to minimise possible fibroblast contamination. Subsequently, the supernatant containing ESC was transferred to Primaria culture flasks.
Cell culture and experimental design
The experimental design is presented in Fig. 1. Upon isolation, samples of ESC (n 6) were incubated for 10 d in Primaria culture flasks. The proliferation medium was changed every 2 d. On the 10th day, cells were trypsinised, and 30 000 cells (counted by Scepter Cell Counter; Merck Millipore) from each flask were transferred to the respective wells of two six-well plates. One plate was dedicated to HMB treatment and one served as the control. After obtaining 80 % of confluence, the proliferation medium was replaced with a differentiation medium (2 % HS/DMEM/AB). Immediately after 48 h of differentiation, the medium from one plate was replaced by a differentiation medium containing 50 µm of HMB, whereas in the second plate the standard differentiation medium was used as a control. After 24 h, the medium from each plate was discarded, plates were washed with PBS and stored at −80°C until further analysis. The concentration of HMB was based on the available literature values and cell viability colourimetric assay test with 3-(4,5-dimethylthiazol-2-yl)-2-5-diphenyltetrazolium bromide (data not shown).
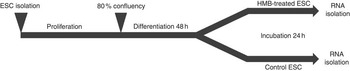
Fig. 1 Experiment design. Equine satellite cells (ESC) were cultured until they reached 80 % confluence; next, the proliferation medium was replaced with a differentiation medium. After the 2nd day of differentiation, cells were incubated for 24 h with β-hydroxy-β-methylbutyrate (HMB). Following the HMB treatment, differentiating cells were scraped and stored at −80°C until further analysis.
Microarray analysis and real-time quantitative PCR validation
RNA isolation, validation, labelling hybridisation and microarray analysis
Total RNA from HMB and control cells was isolated according to the protocol supplied with the miRNeasy Mini Kit (Qiagen). RNA quantity was measured spectrophotometrically using NanoDrop (NanoDrop Technologies). The analysis of final RNA quality and integrity was performed with BioAnalyzer 2100 (Agilent Technologies). To ensure optimal microarray data quality, only samples with the highest RNA integrity number (RIN)≥9·2 were included in the analysis.
Analysis of gene expression profiles was performed using Horse Gene Expression Microarray, 4×44K (Agilent Technologies). Low Input Quick Amp Labeling Kit (Agilent Technologies) was used to amplify and label total RNA (100 ng) to generate complementary RNA (cRNA). On each two-colour microarray, 825 ng of cRNA from HMB-exposed cells (labelled by Cy5, n 4) and 825 ng of cRNA from control cells (labelled by Cy3, n 4) were hybridised to the arrays (Gene Expression Hybridization Kit; Agilent Technologies) according to the manufacturer’s protocol.
RNA Spike-In Kit (Agilent Technologies) was used as an internal control to efficiently monitor microarray workflow for linearity, sensitivity and accuracy. Acquisition and analysis of hybridisation intensities were performed using the DNA microarray scanner (Agilent Technologies) and Feature Extraction software 10.7.3.1 according to the standard manufacturer’s procedures. Linear Lowess was applied for data normalisation and Cy5/Cy3 dye bias compensation.
Statistical analysis
Statistical analysis was performed using Gene Spring 13 software (Agilent Technologies) with the default setting for two-colour microarrays. The estimated significance level (P value) was corrected for multiple hypotheses testing using the Benjamini and Hochberg false discovery rate (FDR) adjustment. mRNA with FDR≤0·05 were selected as significantly differentially expressed genes (DEG).
The microarray experiment was performed according to Minimum information about a microarray experiment (MIAME) guidelines( Reference Brazma, Hingamp and Quackenbush 19 ). The data discussed in this publication have been deposited in National Center for Biotechnology Information’s (NCBI’s) Gene Expression Omnibus (GEO)( Reference Edgar, Domrachev and Lash 20 ) and are accessible through GEO Series accession number GSE74495 (http://www.ncbi.nlm.nih.gov/geo/query/acc.cgi?acc=GSE74495).
Complementary DNA synthesis and real-time quantitative PCR
To independently assess expression changes for a selected group of genes obtained from the microarray data, the real-time quantitative PCR (RT-qPCR) method was applied. The sequences of verified genes, complementary to those on microarrays, were obtained from Ensembl database. Primers were designed using Primer-Blast software (NCBI database) and then checked for secondary structures using the Oligo Calculator (http://www.basic.northwestern.edu/biotools/oligocalc.html). The secondary structures of the amplicon were examined using m-fold Web Server (http://mfold.rna.albany.edu/?q=mfold). The sequences of primers are listed in Table 1. The primers were purchased from Oligo IBB (Polish Academy of Science). Each primer pair was quality tested to ensure that a single product was amplified (dissociation curve analysis) and that there was no primer–dimer coupling.
Table 1 Sequences of primers used for real-time quantitative PCR
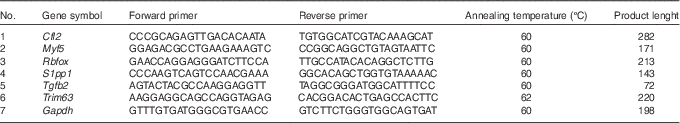
Cfl2, coffilin 2; Myf5, myogenic factor 5; Rbfox, RNA binding protein, fox-1 homolog C. elegans; S1pp1, secreted phosphoprotein 1; Tgfb2, transforming growth factor, β2; Trim63, muscle-specific RING finger protein 1; Gapdh, glyceraldehyde 3-phosphate dehydrogenase.
A quantity of 1 µg of total RNA from HMB-treated and control cells (n 6) was reverse transcribed using a Transcription First Strand cDNA Synthesis Kit (Agilent Technologies). All analyses were performed on individual samples of total RNA using a SensiFAST SYBR lo-ROX Kit (Blirt, Bioline) following the manufacturer’s protocol. Assays for each gene were conducted in duplicate in a Stratagene Mx3005p thermal cycler (Agilent Technologies) according to the following protocol: pre-incubation for 2 min at 95°C and amplification (forty cycles), with denaturation at 95°C for 5 s and annealing at the temperatures specified in Table 1 for 15 s. The dissociation curve setting was as follows: denaturation at 95°C for 0 s, annealing (at the temperatures specified in Table 1), continuous melting up to 95°C for 0 s (slope=0·1°C/s) and cooling at 40°C for 30 s. Glyceraldehyde 3-phosphate dehydrogenase (Gapdh) was used as a reference gene. The relative expression of the target gene was calculated according to the following formula:
 $${\rm \Delta \Delta }C_{T} \,{\equals}\,{\rm \Delta }C_{T} \,\left( {{\rm sample}} \right){\minus}{\rm \Delta }C_{T} \left( {{\rm control}} \right),$$
where ΔC
 $$_{T} $$
is the difference in C
T
between the targeted gene and the reference control. Results were calculated as
$$_{T} $$
is the difference in C
T
between the targeted gene and the reference control. Results were calculated as
 $$2^{{{\minus}\Delta \Delta C_{T} }} $$
using GenEx 6.0 (MultiD Analyses)(
Reference Livak and Schmittgen
21
). The amplification efficiency (E=10(−1/slope)–1) was determined using a comparative quantitation standard curve and was >0·9 for each target gene and the reference gene. Standard curves were generated using a four-point 1:10 dilution series starting with cDNA representing 10 ng of input total RNA. RT-qPCR analysis was conducted according to a standardised approach(
Reference Bustin, Benes and Garson
22
).
$$2^{{{\minus}\Delta \Delta C_{T} }} $$
using GenEx 6.0 (MultiD Analyses)(
Reference Livak and Schmittgen
21
). The amplification efficiency (E=10(−1/slope)–1) was determined using a comparative quantitation standard curve and was >0·9 for each target gene and the reference gene. Standard curves were generated using a four-point 1:10 dilution series starting with cDNA representing 10 ng of input total RNA. RT-qPCR analysis was conducted according to a standardised approach(
Reference Bustin, Benes and Garson
22
).
Functional analysis
The list of DEG was examined by the Functional Analysis tool in the Database for Annotation, Visualization and Integrated Discovery (DAVID version 6.7) to assign them to gene ontology (GO) terms and KEGG pathways (Kyoto Encyclopedia of Genes and Genomes)( Reference Huang, Sherman and Lempicki 23 ). Human background was used for this analysis, because far more human genes are annotated and more information in databases is available for humans than for horses. Enrichment of DEG was calculated by EASE score (modified Fisher exact test). For further analysis and visualisation of data, the Pathway Studio Web Mammalian was used. This database of functional relationships between mammalian proteins is compiled using Med Scan technology from over twenty-four million PubMed abstracts and over 3·5 million Elsevier full-text papers. All identified relations were filtered by reference count (≥2) to ensure maximal confidence levels, which means that the number of publications confirming each relationship was ≥2.
Results
Microarray analysis
Analysis of gene expression between HMB-treated and control cells revealed statistically significant (FDR≤0·05) differences in the case of 627 records. Within them were 361 unduplicated, identified transcript ID including 159 up- and 202 down-regulated DEG, in the HMB v. the control group. All array data are plotted and shown in the online Supplementary Material S1. Table 2 presents genes selected for discussion, presumably involved in HMB action on ESC.
Table 2 List of selected differentially expressed genes in β-hydroxy-β-methylbutyrate-treated v. control equine satellite cells (false discovery rate≤0·05, n 4)

Real-time quantitative PCR
According to the ontological classification and the literature, six genes – Cfl2 (coffilin 2, muscle), Myf5 (myogenic factor 5), Rbfox (RNA binding protein, fox-1 homolog C. elegans), S1pp1 (secreted phosphoprotein 1), Tgfb2 (transforming growth factor, β2) and Trim63 (muscle-specific RING finger protein 1) involved in the skeletal muscle development – were selected for RT-qPCR validation. Expression changes from RT-qPCR data overlapped microarray results and are presented in Fig. 2.
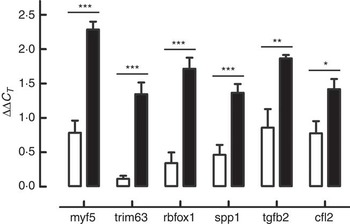
Fig. 2 Genes selected for real-time quantitative PCR (RT-qPCR) validation of microarray results: Cfl2 (coffilin 2, muscle), Myf5 (myogenic factor 5), Rbfox (RNA binding protein, fox-1 homolog C. elegans), S1pp1 (secreted phosphoprotein 1), Tgfb2 (transforming growth factor, β2) and Trim63 (muscle-specific RING finger protein 1). Expression changes from RT-qPCR data overlapped microarray results. * P≤0·05, ** P≤0·01, *** P≤0·001 are significant (n 6). ![]() , β-hydroxy-β-methylbutyrate (HMB);
, β-hydroxy-β-methylbutyrate (HMB); ![]() , Ctrl.
, Ctrl.
Functional analysis
DAVID functional analysis assigned DEG to seventy-five biological processes (BP), eleven cellular components and ten molecular functions as well as four KEGG pathways (EASE score P<0·05). All GO considered significant are shown in the online Supplementary Material S2. KEGG pathways and the most significantly enriched (EASE score <0·01) GO retrieved from DAVID are presented in Table 3, providing a comprehensive overview of important processes, most likely induced by HMB in differentiating ESC.
Table 3 Functional analysis of differentially expressed genesFootnote *

GO, gene ontology; KEGG, Kyoto Encyclopedia of Genes and Genomes; Aak1, AP2 associated kinase 1; Abca1, ATP-binding cassette, sub-family A, member 1; Abhd5, abhydrolase domain containing 5; Acot7, acyl-CoA thioesterase 7; Alad, aminolevulinate dehydratase; Ang, angiogenin, ribonuclease, RNase A family, 5; Arg2, arg2; Arhgap27, rho GTPase activating protein 27; B3gnt5, β-1,3-N-acetylglucosaminyltransferase 5; B4galt1, β-1,4-galactosyltransferase 1; B4galt3, β-1,4-galactosyltransferase 3; B4galt7, β-1,4-galactosyltransferase 7; Bag1, BCL2 associated athanogene 1; Bcat1, branched chain amino acid transaminase 1; Calm1, calmodulin 1 (phosphorylase kinase, delta); Cdc42ep3, CDC42 effector protein 3; Cdk19, cyclin-dependent kinase 19; Cep70, centrosomal protein 70; Chd7, chromodomain helicase DNA binding protein 7; Cul3, cullin 3; Cytip, cytohesin 1 interacting protein; Dmd, dystrophin; Edil3, EGF Like repeats and discoidin domains 3; Eif3i, eukaryotic translation initiation factor 3 subunit I; Esrra, estrogen related receptor α; F2r, coagulation factor II thrombin receptor; Fads1, fatty acid desaturase 1; Fosl2, FOS like antigen 2; Foxj1, forkhead box J1; Fst, follistatin; Galnt12, polypeptide N-acetylgalactosaminyltransferase 12; Gchfr, GTP cyclohydrolase I feedback regulator; Gdf10, growth differentiation factor 10; Gfer, growth factor, augmenter of liver regeneration; Ggct, γ-glutamylcyclotransferase; Gli1, GLI family zinc finger 1; Gna12, G protein subunit α 12; Gnb1, G protein subunit β 1; Gnptg, N-acetylglucosamine-1-phosphate transferase γ subunit; Gucy1a3, guanylate cyclase 1, soluble, α 3; Hmcn1, hemicentin 1; Hnrnpd, heterogeneous nuclear ribonucleoprotein D; Hoxb9, homeobox B9; Ilkap, ILK associated serine/threonine phosphatase; Ip6k2, inositol hexakisphosphate kinase 2; Itgb1bp2, integrin subunit β 1 binding protein 2; Kcnip3, potassium voltage-gated channel interacting protein 3; Kcnmb2, potassium calcium-activated channel subfamily M regulatory β subunit 2; Kcnq1, potassium voltage-gated channel subfamily Q member 1; Kiaa0368, ECM29 homolog, proteasome accessory protein; Kifap3, kinesin associated protein 3; Lama2; laminin subunit α 2; Lama5, laminin subunit α 5; Lpar2, lysophosphatidic acid receptor 2; Map1lc3b, microtubule associated protein 1 light chain 3 β; Mapk14, mitogen-activated protein kinase 14; Mef2a, myocyte enhancer factor 2A; Mef2c, myocyte enhancer factor 2C; Mgp, matrix Gla protein; Mll5, lysine methyltransferase 2E; Mrps24, mitochondrial ribosomal protein S24; Murc, muscle related coiled-coil protein; Myf5, myogenic factor 5; Nfatc3, nuclear factor of activated T-cells 3; Nkx2-2, NK2 homeobox 2; Nos2, nitric oxide synthase 2; Nsmaf, neutral sphingomyelinase activation associated factor; Pak3, P21 protein (Cdc42/Rac)-activated kinase 3; Pkig, protein kinase (CAMP-dependent, catalytic) inhibitor γ; Plcb1, phospholipase C β 1; Pmaip1, phorbol-12-myristate-13-acetate-induced protein 1; Ppargc1b, PPARG coactivator 1 β; Ppp1cc, protein phosphatase 1 catalytic subunit γ; Prkaa1, protein kinase AMP-activated catalytic subunit α 1; Prkab2, protein kinase AMP-activated non-catalytic subunit β 2; Prkg1, protein kinase, CGMP-dependent, type I; Psmd6, proteasome 26S Subunit, Non-ATPase 6; Ptpla, 3-hydroxyacyl-CoA dehydratase 1; Rest, RE1 silencing transcription factor; Rnf10, ring finger protein 10; Rpia, ribose 5-phosphate isomerase A; Rpp21, ribonuclease P/MRP subunit P21; Rps12, ribosomal protein S12; Rps14, ribosomal protein S14; Rps18, ribosomal protein S18; Rps26, ribosomal protein S26; Rps3, ribosomal protein S3; S1pr2, sphingosine-1-phosphate receptor 2; Saa1, serum amyloid A1; Samd4a, sterile α motif domain containing 4A; Scd5, stearoyl-CoA desaturase 5; Sfrs9, serine/arginine-rich splicing factor 9; Ski, SKI proto-oncogene; Slmap, sarcolemma associated protein; Smad1, SMAD family member 1; Smad5, SMAD family member 5; Smarca2, SWI/SNF related, matrix associated, actin dependent regulator of chromatin, subfamily a, member 2; Smg1, SMG1 phosphatidylinositol 3-kinase-related kinase; Sod2, superoxide dismutase 2, mitochondrial; Spp1, secreted phosphoprotein 1; St3gal6, ST3 β-galactoside α-2,3-sialyltransferase 6; Stk39, serine/threonine kinase 39; Svil, supervillin; Tagln3, transgelin 3; Tars2, threonyl-TRNA synthetase 2, mitochondrial (putative); Tgfb2, transforming growth factor β 2; Tlr1, toll like.
* Most significantly enriched ontologies (P<0·01) and KEGG pathways are presented.
Using Pathway Studio Web Mammalin Build Pathway Wizard Find Direct Links, we depicted all genes discussed in the present study that can directly or indirectly affect skeletal muscle cell functions (Fig. 3). Moreover, Pathway Studio Web Mammalian Build Pathway Wizard Find Common Targets algorithm allowed us to identify cell processes regulated by at least two of the DEG according to literature data. This resulted in fifty-six identified targets; among these, the twelve regulated by the highest number of genes were considered to be the most important for the HMB effect on ESC. A chart presenting these processes is presented in Fig. 4. From all targeted cell processes, we selected the most important relationships and are presented in Fig. 5. The online Supplementary Material S3 contains details of all identified relationships between DEG and cell processes.
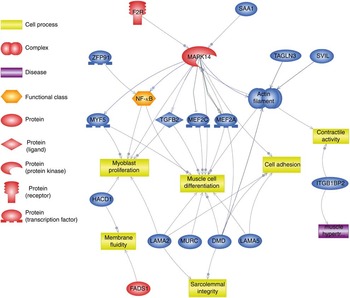
Fig. 3 Pathway depicting β-hydroxy-β-methylbutyrate (HMB)-modulated genes identified in the present analysis, which could directly or indirectly affect skeletal muscle cell functions. This pathway was created using Pathway Studio Web Mammalian. Genes are marked with red and blue colour for up- and down-regulation, respectively. F2R, coagulation factor II; SAA1, serum amyloid A1; TAGLN3, transgelin 3; SVIL, supervilin; MEF2a and MEF2c, myocyte enhancer factor 2a and 2c; TGFB2, transforming growth factor, β2; MAPK14, mitogen-activated protein kinase 14; ZFP91, zinc finger protein 91 homolog; MYF5, myogenic factor 5; HACD1, 3-hydroxyacyl-CoA dehydratase 1 (alias PTPLA); LAMA, laminins; MURC, muscle-related coiled-coil protein; DMD, dystrophin; ITGB1BP2, integrin β1 binding protein (melusin) 2; ![]() , direct regulation;
, direct regulation; ![]() , expression;
, expression; ![]() , promoter modification;
, promoter modification; ![]() , regulation.
, regulation.
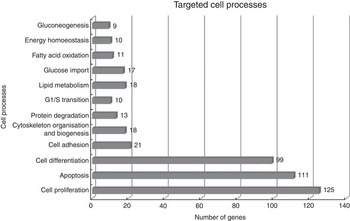
Fig. 4 Major cell processes regulated by differentially expressed genes (DEG) between β-hydroxy-β-methylbutyrate and control cells. Analysis was performed using Pathway Studio Web Mammalian. Only relations with confidence levels ≥2 were included in the analysis. Details of all identified relationships between DEG and targeted cell processes are contained in the online Supplementary Material S3.

Fig. 5 Relevance network over-viewing discussed relationships between β-hydroxy-β-methylbutyrate (HMB)-modulated genes and cell processes (Pathway Studio Web Mammalian). Genes are marked with red and blue colour for up- and down-regulation, respectively. F2R, coagulation factor II; SAA1, serum amyloid A1; NOS2, nitric oxide synthetase, inducible, 2; MEF2a and MEF2c, myocyte enhancer factor 2a and 2c; TGFB2, transforming growth factor, β2; DMD, dystrophin; Trim63, muscle-specific RING finger protein 1; ESRRA, oestrogen-related receptor α; ABHD5, abhydrolase domain-containing protein 5; PRKAB2, protein kinase, AMP-activated, β2 non-catalytic subunit; CUL3, cullin 3; LAMA2, laminins; MURC, muscle-related coiled-coil protein; MYF5, myogenic factor 5; ABCA1, ATP-binding cassette, sub-family A, member 1; PPARGC1B, peroxisome proliferator-activated receptor γ, coactivator 1 β; B4GALT1, β-1,4-galactosyltransferase 1; ST3GAL6, ST3 β-galactoside α-2,3-sialyltransferase 6; B4GALT3, β-1,4-galactosyltransferase 3; ![]() , expression;
, expression; ![]() , promoter binding;
, promoter binding; ![]() , promoter modification;
, promoter modification; ![]() , regulation.
, regulation.
Discussion
The objective of the present study was to identify the molecular background of HMB action on equine skeletal muscle. In order to cover all the salient points of functional analysis, only relations significant in DAVID and possessing the highest reference number in Pathway Studio analysis were considered to be important. To date, no official genome nomenclature has been established for the horse. According to the guidelines published by The International Society for Animal Genetics, for all genes with human orthologues, official human gene symbols (Human Genome Organisation (HUGO) Gene Nomenclature Committee) are applied.
We decided to use a primary SC model because of its stem cell potential. SC are able to differentiate into multiple mesenchymal lineages( Reference Asakura, Komaki and Rudnicki 24 ) and to self-renew( Reference Sacco, Doyonnas and Kraft 25 ), because of which they maintain extraordinary regenerative properties of skeletal muscles. However, the capacity of SC to proliferate and differentiate may vary depending on the origin of the muscle( Reference Ono, Boldrin and Knopp 26 ), cell surface markers expression( Reference Motohashi and Asakura 27 ), myogenic regulatory factors (MRF) expression( Reference Manzano, Toivonen and Calvo 28 ) and muscle fibre type( Reference Yada, Yamanouchi and Nishihara 29 ). In our study, all samples of ESC were isolated from semitendinosus muscle, which in horses is composed mainly of type II fast-twitch fibre muscle( Reference Essén, Lindholm and Thornton 30 ). SC originating from this type of muscle may have less adipogenic properties compared with SC from type I fibres( Reference Yada, Yamanouchi and Nishihara 29 ). Heterogeneity of the SC could limit in vivo significance of the data obtained in the present study.
In general, the present analysis underlined the role of HMB as a global regulator, which is shown by the strong over-representation of genes linked to the BP: ‘regulation of developmental process’ and ‘positive regulation of BP’. Moreover, functional analysis revealed significant enrichment in ontology terms associated with cellular responses (Table 3). The three main cellular processes include cell proliferation, apoptosis and differentiation, which suggest that HMB is an important cell growth regulator (Fig. 4 and 5).
In adult skeletal muscle, extracellular matrix proteins anchor SC between the basal lamina and the apical sarcolemma, which create a specialised micro-environment called a stem cell niche. It is able to produce factors controlling stem cell behaviour( Reference Bröhl, Vasyutina and Czajkowski 31 ). Impaired adhesion of SC to their niche can stimulate proliferation( Reference Bischoff 32 ). Thereby, enrichment of the terms ‘regulation of cell adhesion’ and ‘cellular localisation’ may suggest HMB’s ability to indirectly control ESC proliferation by affecting their localisation in the niche.
Muscle development
The term ‘muscle organ development’ is the most significantly enriched annotation among genes regulated in ESC exposed to HMB (Table 3). This indicates that at least at the mRNA level HMB may affect muscle development (summarised on Fig. 3). A total of fourteen DEG were annotated to this term; however, among them, Mapk14 (mitogen-activated protein kinase 14) possessed the highest potential to regulate other genes and cell processes (Fig. 3 and 5). Mapk14 is activated by extracellular stimuli such as pro-inflammatory cytokines or physical stress, leading to direct activation of multiple cellular processes such as proliferation, differentiation, apoptosis and transcription regulation( Reference Stelzer, Dalah and Stein 33 ). In SC, phosphorylation of MAPK14 may induce initiation( Reference Jones, Tyner and Nibarger 34 , Reference Troy, Cadwallader and Fedorov 35 ) or withdrawal( Reference Perdiguero, Ruiz-Bonilla and Gresh 36 ) from the cell cycle. The second can lead either to terminal differentiation or to programmed cell death( Reference Wang and Walsh 37 ) depending on the nature of the stimulant and cell type. In vitro studies suggest that the two isoforms of Mapk14, p38α and p38β, appear to have different effects on cardiomyocyte hypertrophy: p38β seems to be more potent in inducing hypertrophy, whereas p38α appears to be more important in apoptosis( Reference Wang, Huang and Sah 38 ). The contribution of Mapk14 in cellular responses to HMB has already been reported by Kornasio et al.( Reference Kornasio, Riederer and Butler-Browne 8 ), who suggested that the MAPK/ERK pathways mediate HMB’s effects on myoblast proliferation. HMB-related increase in phosphorylation of MAPK14 was also observed in dexamethasone-induced muscle atrophy in rats( Reference Aversa, Alamdari and Castillero 39 ).
Except for its ability to influence multiple cell processes, Mapk14 was reported to regulate many other genes from the analysis. One of them is Nos2 (nitric oxid synthase 2, inducible), interesting because of its lowest expression among all genes. Nos2 gene expression may be activated by Mapk14; however, it is assigned to shock signalling in inflammatory cells( Reference Kan, Zhao and Jiang 40 ) and its biological meaning in ESC remains unclear. Down-regulation of this gene by HMB has already been presented by Mitsutaka et al.( Reference Mitsutaka, Sumito and Hidetaka 41 ) in lipopolysaccharide-treated murine macrophages. This considered together may suggest an anti-inflammatory component of HMB action. Mapk14-dependent phosphorylation of transcription factors Mef2a and Mef2c (myocyte enhancer factor 2a and 2c) has been implicated in stress activation of immune, skeletal and cardiac muscle cells( Reference Cuenda and Cohen 42 , Reference Han and Molkentin 43 ). Among genes identified in our study, Mapk14 posseses two upstream promoters, Saa1 (serum amyloid A1) and F2r (coagulation factor II, thrombin receptor-like 2); however, so far, only the second gene has been implicated in striated muscle tissue development( Reference Pawlinski, Tencati and Hampton 44 , Reference Chevessier, Hantaï and Verdière-Sahuqué 45 ), which means that F2r may link HMB and Mapk14 (Fig. 3 and 5).
Another gene of particular importance to the ‘muscle organ development’ term is Myf5, belonging to the MRF family of transcription regulators( Reference Bentzinger, Wang and Rudnicki 46 ). The high expression of Myf5 in adult skeletal muscle features committed SC and decreases when differentiation to myotubes occurs( Reference Bentzinger, Wang and Rudnicki 46 , Reference Hansen 47 ). Accordingly, decreased expression levels of Myf5 in ESC at the beginning of differentiation may indicate that HMB enhanced withdrawal of equine myoblasts from the cell cycle, compared with control cells. This finding is accompanied by previous reports presenting an HMB-dependent increase in mRNA and protein levels of muscle differentiation markers such as MyoD and myogenin( Reference Kornasio, Riederer and Butler-Browne 8 , Reference Alway, Pereira and Edens 16 ). However, at the time of our analysis, none of the differentiation markers reached significance criteria in ESC, which may emphasise the need for time-course studies in the future. Another down-regulated gene in HMB-treated cells was Tgf-β2. Activity of Tgf-β2 has been recently linked with increased proliferation and delayed differentiation in C2C12( Reference De Mello, Streit and Sabin 48 ); thus, its down-regulation may confirm HMB-mediated enhancement of differentiation in ESC.
Other ‘muscle organ development’ annotated genes such as Dmd (dystrophin), Lama2 and Lama5 (laminins) encode protein complexes located in muscle sarcolemma and the basal lamina, respectively, protecting sarcolemma from mechanical damage during muscle contraction( Reference García-Pelagio, Bloch and Ortega 49 , Reference Kuang, Xu and Vilquin 50 ) and, as described above, contribute to SC anchor in their niche( Reference Bröhl, Vasyutina and Czajkowski 31 ). This could be linked to HMB’s ability to decrease post-exercise muscle cell damage in vivo ( Reference Ostaszewski, Kowalska and Szarska 13 , Reference Miller, Sandberg and Fuller 14 ); however, in cultured ESC, its expression was decreased. The remaining genes annotated to the ‘muscle organ development’ term by DAVID include the following: Zfp91 (zinc finger protein 91 homolog), acting as an activator of the non-canonical NF-κB pathway( Reference Stelzer, Dalah and Stein 33 ); Itgb1bp2 (integrin β-1-binding protein 2, melusin 2)( Reference Stelzer, Dalah and Stein 33 ); Svil (supervilin), involved in myosin II assembly, cell migration and focal adhesions( Reference Stelzer, Dalah and Stein 33 ); Murc (muscle-related coiled-coil protein) controlling myofibrillar organisation( Reference Stelzer, Dalah and Stein 33 ); and Tagln3 (actin cross-linking/gelling protein) involved in contractile properties and early cell differentiation( Reference Stelzer, Dalah and Stein 33 ).
Muscle protein metabolism
One of the first described mechanisms of HMB action was the effect on muscle protein metabolism. Preliminary studies suggest that HMB protects the skeletal muscle by inhibiting protein degradation( Reference Ostaszewski, Kostiuk and Balasinska 5 ) and by stimulating protein synthesis( Reference Smith, Mukerji and Tisdale 6 ); however, this issue is subjected to constant research( Reference Kao, Columbus and Suryawan 17 ). Functional analyses have demonstrated significant DEG enrichment of terms associated with cellular protein maintenance (Table 3, Fig. 4). The three most important genes of this group are Cul3 (cullin 3), Trim63 and Mapk14 (Fig. 5). Cul3 is a scaffold protein of E3 ubiquitin-protein ligase complexes, which mediate the ubiquitination and subsequent proteasomal degradation of target proteins. Cul3 also interacts with Kelch family proteins, and disturbances in functioning of this complex are implicated in muscle myopathies( Reference Gupta and Beggs 51 ). E3 Ubiquitin ligase produced by Trim63 regulates the proteasomal degradation of muscle proteins and inhibits de novo skeletal muscle protein synthesis under amino acid starvation, consequently leading to muscle atrophy( Reference Eddins, Marblestone and Kumar 52 ). As observed in the present study, down-expression of Trim63 mediated by HMB confirms the results obtained by Aversa et al.( Reference Aversa, Alamdari and Castillero 39 ) in a dexamethasone-induced muscle atrophy model; however, in two most recent studies, the authors failed to demonstrate a similar effect on Trim63 expression upon fasting in human and pig muscles( Reference Kao, Columbus and Suryawan 17 , Reference Rittig, Bach and Thomsen 53 ). This indicates that the effect of HMB on this gene expression could be species and/or condition related. Multiple studies suggest that Mapk14 signalling may be involved in HMB-mediated stimulation of protein synthesis in catabolic conditions( Reference Kornasio, Riederer and Butler-Browne 8 , Reference Aversa, Alamdari and Castillero 39 , Reference Pimentel, Rosa and Lira 54 ), which may be confirmed by the up-regulation of this gene in HMB-treated ESC.
Lipid metabolism and energy homoeostasis
Recent studies have revealed that HMB supplementation may alter metabolism, as evidenced by improved aerobic performance and increased fat loss during exercise( Reference Vukovich and Dreifort 11 , Reference Bruckbauer, Zemel and Thorpe 12 ). This is confirmed in our study, which showed influence of DEG on cell processes such as ‘energy homoeostasis’, ‘lipid metabolism’, ‘glucose import’, ‘fatty acid oxidation’ and ‘gluconeogenesis’ (Fig. 4 and 5). An extensive amount of research describing the positive role of Mapk14 on glucose uptake( Reference Somwar, Perreault and Kapur 55 ) and gluconeogenesis( Reference Cao, Collins and Becker 56 ) has been published. Thereby, we postulate that apart from the established role of Mapk14 in HMB-dependent influence on protein metabolism and cell growth it can mediate HMB influence on energy homoeostasis as well. The rate of post-exercise muscle glycogen synthesis is 2–3-fold slower in horses compared with other mammals( Reference Waller and Lindinger 1 ); therefore, the positive impact of HMB on glucose uptake could enhance this process in equine skeletal muscles. This is an interesting aspect of our study, which deserves more attention in future investigations. Another salient point of HMB influence on metabolism may be the transcription factor Esrra (oestrogen-related receptor α), controlling vast gene networks involved in all aspects of energy homoeostasis, including lipid and glucose metabolism as well as mitochondrial biogenesis and function( Reference Huss, Torra and Staels 57 ). Common targets algorithm showed its strong association with ‘fatty acid oxidation’ and ‘lipid metabolism’ (Fig. 5). Essra is targeted by Ppargc1b (peroxisome proliferator-activated receptor γ, coactivator 1 β) (PPAR-γ coactivator), a well-established regulator of β-oxidation of fatty acids and oxidative phosphorylation in mitochondria, which is highly induced during myogenic differentiation( Reference Shao, Liu and Liu 58 ). Prkab2 (protein kinase, AMP-activated, β2 non-catalytic subunit) is essential for the regulation of a multitude of metabolic processes maintaining energy homoeostasis, especially in tissues with high metabolic rates, such as skeletal muscle( Reference Towler and Hardie 59 ). Bruckbauer et al.( Reference Bruckbauer, Zemel and Thorpe 12 ) reported that HMB increases the activity of Prkab2 in adipocytes and muscle cells; however, our results showed that HMB slightly decreased its expression in ESC at the time of the analysis. Prkab2 senses cellular energy levels. In response to low cellular ATP levels, Prkab2 switches off ATP-consuming anabolic pathways (mechanistic target of rapamycin (mTOR) kinase pathway), which results in inhibition of cell growth, proliferation and macromolecules synthesis, and at the same time Prkab2 switches on catabolic pathways that generate ATP (e.g. glucose uptake, glycolysis, fatty acid oxidation)( Reference Towler and Hardie 59 ).
In regulation of the cellular process ‘lipid metabolism’, two genes appear to take the lead – Abca1 (ATP-binding cassette, sub-family A, member 1), encoding a membrane-associated protein belonging to the ATP-binding cassette transporters superfamily and Abhd5 (abhydrolase domain-containing protein 5). The analysis indicated up-regulation of both in ESC. The latter encodes a co-activator of adipose triglyceride lipase, thereby enhancing adipocyte and muscle lipolysis( Reference Sanders, Madoux and Mladenovic 60 ). Abca1 is a key regulator of the reverse cholesterol transport process and HDL biogenesis. Increased Abca1 expression was demonstrated in skeletal and cardiac muscles in response to training( Reference Ghanbari-Niaki 61 ), which indicates the role of Abca1 in the reduction of CVD risk by physical exercise.
Several reports have established HMB’s role in supporting muscle cell membrane integrity during exercise( Reference Ostaszewski, Kowalska and Szarska 13 , Reference Miller, Sandberg and Fuller 14 ). However, as already mentioned, our analysis showed that at least at mRNA levels HMB decreased the expressions of genes encoding sarcolemmal scaffold proteins (Dmd, Lama2, Lama5). Alternatively, functional analysis enrichment of terms associated with lipid maintenance, as well as KEGG pathways ‘biosynthesis of unsaturated fatty acids’ and ‘glicosphingolipids biosynthesis’, may indicate HMB’s ability to support cell membrane integrity by decreasing its rigidity( Reference Blondelle, Ohno and Gache 62 ). Moreover, this may have an indirect impact on the inflammatory processes, signal transduction and myoblast differentiation( Reference Blondelle, Ohno and Gache 62 , Reference Cambron and Leskawa 63 ) (Fig. 3).
Conclusions
The results presented in this study suggest the capability of HMB to influence ESC proliferation, differentiation and apoptosis as well as inflammatory response, protein anabolism, sarcolemma integrity, and cell energy utilisation and storage. As we have summarised in Fig. 5, most of the above-mentioned processes could be controlled by the Mapk14 gene, which suggests that at least at the mRNA level HMB triggers its cellular responses by stress signalling pathways. It should be noted that in vivo response of ESC to HMB may differ from the presented results because of the heterogeneity of the SC population and undefined postprandial HMB concentrations in equine skeletal muscle. Moreover, transcription is only one step in the regulatory pathway that leads to functional protein synthesis, therefore, further research on the proteomic, biochemical and pharmacodynamic level is highly recommended.
In conclusion, this study demonstrated for the first time that HMB has the potential to influence ESC by controlling its global gene expression. Transcriptomic profile analysis identified valuable gene targets of HMB in ESC, which may support the role of HMB in improving skeletal muscle growth and regeneration in horses; however, the overall role of HMB in equine skeletal muscle remains equivocal and requires further research.
Acknowledgements
The authors gratefully acknowledge Richard Nicholson for his assistance in the writing of this manuscript.
This research was funded by National Science Centre (Poland), grant no. 2011/03/B/NZ5/05697. Publication of this manuscript was supported by KNOW (Leading National Research Centre) Scientific Consortium ‘Healthy Animal – Safe Food’, a decision of the Ministry of Science and Higher Education, no. 05-1/KNOW2/2015.
K. A. S. carried out muscle sampling, RT-qPCR validation of microarray results, ontological analysis, interpretation of the obtained data and wrote the manuscript. A. C. carried out equine satellite cell isolation and culture analysis, RNA isolation and microarray analysis. P. O. participated in the study design and helped in manuscript revision. T. S. participated in the study design, supervised the project, performed muscle sampling and statistical analysis of microarray and RT-qPCR data, as well as assisted in the manuscript revision. All the authors read and approved the final manuscript.
The authors declare that they have no conflicts of interest.
Supplementary Material
For supplementary material/s referred to in this article, please visit http://dx.doi.org/10.1017/S000711451600324X


 Open access