


Introduction
The world is inundated with non-communicable diseases (NCDs) which have emerged as one of the most serious public health concerns (Biswas et al., Reference Biswas, Townsend, Islam, Islam, Gupta, Das and Al Mamun2019; Bista et al., Reference Bista, Dhungana, Chalise and Pandey2020). NCDs are any illness that lasts a long time or has lengthy consequences and is caused by a non-infectious and non-transmissible aetiology (WHO, 2020). NCDs are the prime and most important causes of mortality and infirmity worldwide (Vos et al., Reference Vos, Lim, Abbafati, Abbas, Abbasi, Abbasifard, Abbasi-Kangevari, Abbastabar, Abd-Allah, Abdelalim and Abdollahi2020). Therefore, reducing the incidence of NCDs is one of the most significant priorities of the UN Sustainable Development Goals (SDGs). In addition, NCDs are responsible for approximately 41 million deaths worldwide annually, with approximately 77% of those occurring in low- and middle-income countries (WHO, 2022). More than one-third of these deaths (15 million people out of a total of 41 million) occurred in people aged 30–69 years (WHO, 2020). Moreover, it is anticipated that the number of victims will increase from 38 to 52 million between 2012 and 2030 (Bigna and Noubiap, Reference Bigna and Noubiap2019). Based on the projections by the Harvard Public Health School, the accumulated production loss caused by NCDs will exceed approximately US$47 trillion by 2030 (Bloom et al., Reference Bloom, Cafiero, Jané-Llopis, Abrahams-Gessel, Bloom, Fathima, Feigl, Gaziano, Mowafi, Pandya, Prettner, Rosenberg, Seligman, Stein and Weinstein2011). The increased life expectancy and declining fertility in South Asia caused by demographic transition and economic growth elevated the incidence of NCDs (Islam et al., Reference Islam, Purnat, Phuong, Mwingira, Schacht and Fröschl2014). The crucial risk factors for the rapid growth of NCDs comprise high cholesterol, elevated blood pressure, unsatisfactory intake of fruit and vegetables, expanded fat in the blood, unhealthy diet, overweight or obesity, physical inactivity, smoking, and overconsumption of alcohol (Saeed, Reference Saeed2013). In a progression of steps, these risk factors constitute severe NCDs, such as respiratory diseases, diabetes, cardiovascular diseases, and cancers, which are the ‘group of four’ and are liable for 80% of all fatalities brought on by NCDs (Bista et al., Reference Bista, Dhungana, Chalise and Pandey2020). On the contrary, most of these risk factors can be prevented or controlled (Zaman et al., Reference Zaman, Bhuiyan, Karim, Rahman, Akanda and Fernando2015). The worldwide strategic programme of WHO for the control and prevention of NCDs concentrated on nine elective global objectives with a target of achieving a 25% considerable decline in early death from cardiovascular diseases, cancer, diabetes, or chronic respiratory diseases concerning premature mortality from NCDs by 2025 (WHO, 2013).
As one of the most densely populated countries with a population of over 169 million, Bangladesh recently graduated to a lower-middle-income country (BBS, 2022). NCDs are the leading cause of mortality and morbidity in Bangladesh, accounting for 67% of total deaths (WHO, 2016). In the past few decades, the incidence of NCDs has grown at an alarming rate in Bangladesh (Islam et al., Reference Islam, Rahman, Roy, Tawabunnahar, Jahan, Ahmed and Maniruzzaman2021). In addition, Bangladesh is currently in a more aggressive manifestation of epidemiological transition, and the number of deaths caused by NCDs is anticipated to rise (Islam et al., Reference Islam, Rahman, Roy, Tawabunnahar, Jahan, Ahmed and Maniruzzaman2021). Recent evidence from a community-based survey revealed an expansion in the occurrence of NCDs as compared with preceding years (Khalequzzaman et al., Reference Khalequzzaman, Chiang, Choudhury, Yatsuya, Al-Mamun, Al-Shoaibi, Hirakawa, Hoque, Islam, Matsuyama and Iso2017). Notably, 26%, 21%, and 5% of the population are overweight and have hypertension and diabetes, respectively (Zaman et al., Reference Zaman, Bhuiyan, Karim, Rahman, Akanda and Fernando2015). The Bangladesh Demographic and Health Survey (BDHS) 2011 revealed that the incidence rate of hypertension, diabetes as well as overweight or obesity was 48.0%, 11.0%, and 25.3%, respectively (Al Kibria et al., Reference Al Kibria, Hashan, Hossain, Zaman and Stennett2021). Catastrophic health expenditure for screening, diagnosis, and treatment of NCDs deter various individuals in developing countries like Bangladesh from seeking the care they need (Fottrell et al., Reference Fottrell, Ahmed, Shaha, Jennings, Kuddus, Morrison, Akter, Nahar, Nahar, Haghparast-Bidgoli and Khan2018).
Similar to other developing countries, NCDs are a widespread threat to public health in Bangladesh. Thus, it is now one of the government’s top priorities and various international organisations working in Bangladesh to reduce the morbidity and mortality caused by NCDs (Riaz et al., Reference Riaz, Islam, Islam, Zaman, Hossain, Rahman, Khanam, Amin and Noor2020). Although Bangladesh has made progress in various aspects towards achieving SDGs, NCDs continue to pose a significant challenge to its general public health (Khalequzzaman et al., Reference Khalequzzaman, Chiang, Choudhury, Yatsuya, Al-Mamun, Al-Shoaibi, Hirakawa, Hoque, Islam, Matsuyama and Iso2017). A number of studies have investigated the prevalence and risk factors of NCDs in Bangladesh using traditional techniques such as univariate, bivariate, and, in some instances, regression analysis to understand the situation (Saeed, Reference Saeed2013; Khalequzzaman et al., Reference Khalequzzaman, Chiang, Choudhury, Yatsuya, Al-Mamun, Al-Shoaibi, Hirakawa, Hoque, Islam, Matsuyama and Iso2017; Russell et al., Reference Russell, Sturua, Li, Morgan, Topuridze, Blanton, Hagan and Salyer2019; Bista et al., Reference Bista, Dhungana, Chalise and Pandey2020; Yosef, Reference Yosef2020). Most of the work focused on a specific burden. To date, however, no studies have yet investigated the coexistence of multiple NCDs and made predictions using the machine learning (ML)-based algorithms. While the traditional methods are widely used, the insight from these types of analysis is limited to exploratory and inferential analyses. To control the health risk, however, it is important to predict the prevalence of these diseases using ML-based methods in addition to conventional techniques. Recently, disease prediction has increased substantial devotion from the information learning research community. Recently, the presence of multiple diseases is common in the human body and this is significantly increasing worldwide. The double and the triple burden of NCDs (DBNCDs and TBNCDs) as a form of the presence of multiple diseases in a body are relatively recent phenomena, and only a limited number of studies have investigated the risk factors of DBNCDs and TBNCDs (Al-Zubayer et al., Reference Al-Zubayer, Ahammed, Sarder, Kundu, Majumder and Islam2021). Although the use of ML has significantly improved the diagnosis, treatment, and prognosis of several diseases, the application of ML-based approaches for predicting the DBNCDs and TBNCDs has not yet been properly investigated (Maniruzzaman et al., Reference Maniruzzaman, Rahman, Ahammed and Abedin2019; Maniruzzaman et al., Reference Maniruzzaman, Rahman, Ahammed, Abedin, Suri, Biswas, El-Baz, Bangeas, Tsoulfas and Suri2020; Islam et al., Reference Islam, Talukder, Awal, Siddiqui, Ahamad, Ahammed, Rawal, Alizadehsani, Abawajy, Laranjo and Chow2022). Thus, this research was inspired to simultaneously study on both DBNCDs and TBNCDs to overcome the challenges of NCDs in Bangladesh. Therefore, this study aimed to: (i) explore the prevalence of DBNCDs and TBNCDs, (ii) identify the most significant determinants of DBNCDs and TBNCDs, and (iii) suggest an ML-based classifier to predict the DBNCDs and TBNCDs.
This study has made significant technical contributions to the field of NCDs. A novel methodology has been implemented to assess the risk factors associated with DBNCDs and TBNCDs in Bangladesh, thereby addressing a critical research gap. It has utilised a range of ML techniques to predict DBNCDs and TBNCDs and has pioneered a balanced dataset generation method for enhancing model accuracy. Additionally, a robust 10-fold cross-validation (CV) process has been established to rigorously evaluate the model performance. A comprehensive set of performance metrics has been applied, ensuring a thorough assessment of the classifier efficacy. These contributions have significantly advanced NCDs research in Bangladesh and in similar jurisdictions, providing a valuable framework for further research in public health domains.
Materials and methods
Study design
This study used secondary data extracted from the BDHS 2017–2018, which was a nationwide representative cross-sectional household survey. The survey was administered by the National Institute of Population Research and Training between October 2017 and March 2018. It collected individual participant data using a two-stage stratified cluster sampling process. First, a total of 675 enumeration areas (EAs) (250 in urban regions and 425 in rural areas) were selected based on a probability that was proportionate to the size of each EA. Second, 30 households were selected from each EA. This was done to obtain a statistically reliable assessment of important demographic and health characteristics for the whole country. The procedure is described in depth in the BDHS 2017–2018 report (NIPORT and ICF, 2020). The survey selected a total of 20,250 households and information from 89,819 individuals within those households was gathered. All the adult males and females who were at least 18 years old had their blood glucose and blood pressure levels checked. Finally, the participants in the study were limited to 12,151 adults (5,238 and 6,913 men and women, respectively) aged 18 years and above. Finally, BDHS-2011 dataset was also used to check the efficiency of our proposed system.
Outcome variable
The study primarily used two outcome variables, namely DBNCDs and TBNCDs, which were calculated from three NCDs including diabetes, hypertension as well as overweight and obesity. If any two of the diseases existed in a person’s body, he/she was classified to have DBNCDs. On the contrary, if a person suffered from the considered three diseases of diabetes, hypertension, and being overweight or obese, then the person was classified as having TBNCDs.
Diabetes
The respondents’ fasting plasma glucose levels and whether they took any diabetic medication were taken into account to determine whether or not the person had diabetes. If an individual had a fasting plasma glucose reading of more than 7.0 mmol/L and/or she/he was taking any medication for diabetes, then the subject was classified to have diabetes disease; otherwise, the subject was classified as normal (WHO, 2016).
Hypertension
The value of blood pressure was utilised to assess hypertension. The interviewers took the respondents’ blood pressure thrice over the course of each interview: at the very start, at the exact centre and at the final closing of the session. The average value of these measurements was included in the BDHS, 2017–2018 dataset, which was used to measure hypertension. A respondent was classified to have hypertension if she/he had an average systolic blood pressure of ≥ 140mmHg and/or average diastolic blood pressure of ≥ 90 mmHg and/or was taking any medicine or drug to lower blood pressure (Ahammed et al., Reference Ahammed, Maniruzzaman, Talukder and Ferdausi2021).
Overweight and obesity
Body mass index (BMI) was estimated by taking participants’ weight in kilograms and dividing it by the square of their height in metres. An adult BMI of 25.0 to <30 kg/m2 is considered overweight, and 30.0 or higher is obese. In this study, if a respondent’s BMI is ≥25 kg/m2, then the respondent is classified as overweight or obese otherwise stated not (Bista et al., Reference Bista, Dhungana, Chalise and Pandey2020; NIPORT and ICF, 2020; Ahammed et al., Reference Ahammed, Sarder, Kundu, Keramat and Alam2022).
Explanatory variables
Several explanatory variables were included in this study to find the associated risk factors for DBCNDs and TBNCDs in Bangladesh (Saeed, Reference Saeed2013; Khalequzzaman et al., Reference Khalequzzaman, Chiang, Choudhury, Yatsuya, Al-Mamun, Al-Shoaibi, Hirakawa, Hoque, Islam, Matsuyama and Iso2017; Russell et al., Reference Russell, Sturua, Li, Morgan, Topuridze, Blanton, Hagan and Salyer2019; Bista et al., Reference Bista, Dhungana, Chalise and Pandey2020; Yosef, Reference Yosef2020). The variables which were considered for the analysis were respondent’s age (<35, 35–44, 45–54, 55–64, and ≥65 years), sex (male and female), marital status (never married, currently married, and formerly/ever married), education level (no education/preschool, primary, secondary, and higher), employment status (working and not working), family size (≤4 and >4), wealth index (poorest, poorer, middle, richer, and richest), height (short, medium, and tall), caffeinated drink (no and yes), smoking status (no and yes), place of residence (urban and rural), regionality (Barisal, Chittagong, Dhaka, Khulna, Mymensingh, Rajshahi, Rangpur, and Sylhet), community poverty (low and high), and community literacy (low and high). The community poverty and community literacy were generated by aggregating the wealth index and education level, respectively, and then categorised as high or low depending on the distribution of the ratio values that were evaluated for each cluster. Moreover, the ratio value was examined using a histogram, and if the data were normally distributed, then the mean value was used as the cut-off point for the category; otherwise, the median value was utilised (Al-Zubayer et al., Reference Al-Zubayer, Ahammed, Sarder, Kundu, Majumder and Islam2021).
Risk factors selection techniques
The selection of risk factors is either through variable selection, feature selection, or a subset of features in the fields of statistics and ML. Several risk factor selection techniques are used to choose the variables that provide the most valuable information to enhance the performance of ML-based algorithms. Thus, it is important to select the most important and significant factors for easy operation of an ML-based system, and these include clear interpretation of the findings, minimise the amount of expense and time spent on computations, removing the dimensionality issue, optimise the accuracy of the classification, and minimise the problem of over-fitting (James et al., Reference James, Witten, Hastie and Tibshirani2013; Liu and Motoda, Reference Liu and Motoda2012; Maniruzzaman et al., Reference Maniruzzaman, Shin and Hasan2022). Chi-square analysis was used in this study to measure the association of explanatory variables with DBNCDs and TBNCDs. A multilevel logistic regression (LR) model was used to select the important risk factors for DBNCDs and TBNCDs. All the risk factors were selected using a p-value of <0.05.
Imbalanced maintenance procedure and formation of balanced datasets
A dataset is imbalanced if one class label exceeds the other class label in size. The imbalanced outcome variable in data poses practical challenges for the community of ML-based research (Libbrecht and Noble, Reference Libbrecht and Noble2015). An ML-based system favours the majority class when classifying imbalanced data. Therefore, this study adopted a combination of oversampling and under-sampling techniques to address this issue. Oversampling is an approach in which samples from the minority class are randomly chosen with replacements and added to the training dataset. Consequently, ML-based classifier performance is enhanced (Matsuoka, Reference Matsuoka2021; Maniruzzaman et al., Reference Maniruzzaman, Shin and Hasan2022). Under-sampling is another strategy in which samples from the majority class are randomly chosen without replacement until the label’s balance is attained (Bunkhumpornpat et al., Reference Bunkhumpornpat, Sinapiromsaran and Lursinsap2011).
The study used a mixture of over- and under-sampling strategies to balance the outcome variables category label (No vs. Yes) for both DBNCDs and TBNCDs. In the case of DBNCDs, the database that was used for the investigation included a total of 1,735 (14.3%) and 10,416 (85.7%) individuals who had and who did not have DBNCDs, respectively. Herein, the ratio between yes and no was 1:6. The study took 3.501 times the positive class (Yes) (3.501 × 1735) = 6,075 respondents having DBNCDs using oversampling and took 6,076 respondents who did not have DBNCDs from 10,416 using under-sampling to minimise the disparity between the numbers of samples found in each category. In terms of TBNCDs, the database that was used for the investigation consisted of a total of 278 (2.3%) and 11,873 (97.7%) respondents who had and did not have TBNCDs, respectively. Herein, the ratio between Yes and No was too imbalanced. Thus, the study took 21.85 times the number of individuals in the positive class (Yes) (21.85 × 278) = 6,075 respondents having TBNCDs using oversampling and also took 6,076 respondents who did not have TBNCDs from 11,873 using under-sampling to lessen the difference between the numbers of samples found in each category.
Data partitioning
The process of data partitioning is the CV protocol. It was used to create two distinct subsets from the original dataset, which are the training and the validation/test sets. Several CV techniques are available that may be used to partition the dataset into smaller segments to minimise variability (Maniruzzaman et al., Reference Maniruzzaman, Rahman, Ahammed, Abedin, Suri, Biswas, El-Baz, Bangeas, Tsoulfas and Suri2020; Islam et al., Reference Islam, Talukder, Awal, Siddiqui, Ahamad, Ahammed, Rawal, Alizadehsani, Abawajy, Laranjo and Chow2022). The 10-fold CV procedure was frequently used to partition the data (Maniruzzaman et al., 2020; Islam et al., Reference Maniruzzaman, Rahman, Ahammed, Abedin, Suri, Biswas, El-Baz, Bangeas, Tsoulfas and Suri2022). This protocol involves dividing the dataset into 10 equivalent portions, 9 of which were utilised as a training set, while the remaining portion served as a validation/test set. Then, ML-based methods were trained on the training set and predicted the class label on the test set, and then the classification accuracy of each protocol was computed. This procedure was repeated 10 times to minimise the variability and then computed the average classification accuracy of ML-based methods. This procedure is the K10 CV protocol, wherein 10 represents the total number of partitions that occur throughout the ML-based process. Similarly, K2 and K5 data partition protocols were the most popular data splitting procedures, which were based on the training set’s accessible percentage of 50% as well as 80%, respectively, whereas the remaining portions were the validation or test set. Three partition protocols were employed in the present study, sequentially labelled as K2, K5, and K10.
ML approach
The application of an ML-based technique is to make predictions about DBNCDs and TBNCDs. Several ML-based techniques can be potentially employed for classification and regression. Among them, the study implemented the following six classifiers: decision tree (DT) (Quinlan, Reference Quinlan1986), logistics regression (LR) (Maniruzzaman et al., Reference Maniruzzaman, Rahman, Al-MehediHasan, Suri, Abedin, El-Baz and Suri2018), k-nearest neighbours (KNN) (Hastie et al., Reference Hastie, Tibshirani, Friedman and Friedman2009), naïve Bayes (NB) (Hossain and Chetty, Reference Hossain and Chetty2011), random forest (RF) (Breiman, Reference Breiman2001), and extreme gradient boosting (XGBoost) (Bentéjac et al., Reference Bentéjac, Csörgő and Martínez-Muñoz2021). The considered ML-based techniques were the most popular and essential classification method for biomedicine investigations (Liao et al., Reference Liao, Ju and Zou2016; Shah et al., Reference Shah, Luo, Kanakasabai, Tuason and Klopper2019) and also specify dummy indicators and may be extended for the classification of different NCDs such as diabetes, hypertension, and overweight or obesity (Maniruzzaman et al., Reference Maniruzzaman, Rahman, Al-MehediHasan, Suri, Abedin, El-Baz and Suri2018). Finally, the seven performance parameters were applied to measure the performance of the classifiers, which are accuracy (ACC), sensitivity (SE), specificity (SP), positive predictive value (PPV), negative predictive value (NPV), F-measure (FM), and area under the curve (AUC).
Performance evaluations
Several statistical parameters can be used to evaluate the performance of different ML-based classifiers. This study primarily used accuracy (ACC) and AUC. In addition, SE, SP, PPV, NPV, and FM were used to measure the performance of ML-based classifiers. However, all the parameters were calculated using true positives (TPs), true negatives (TNs), false positives (FPs), and false negatives (FNs). The statistical parameters of the classifiers were defined as follows:
 $${\rm{ACC}}\;\left( \% \right)\;\; = {{{\rm{TP}}\; + {\rm{TN}}} \over {{\rm{TP}} + {\rm{TN}} + {\rm{FP}}\; + {\rm{FN}}}} \times 100$$
 $${\rm{SE}}\;\left( \% \right)\;\; = {{{\rm{TP}}} \over {{\rm{TP}} + {\rm{FN}}}} \times 100$$
 $${\rm{SP}}\;\left( \% \right)\; = {{{\rm{TN}}} \over {{\rm{TN}} + {\rm{FP}}}} \times 100$$
 $${\rm{PPV}}\;\left( \% \right) = {{{\rm{TP}}} \over {{\rm{TP}} + {\rm{FP}}}} \times 100$$
 $${\rm{NPV}}\;\left( \% \right) = {{{\rm{TN}}} \over {{\rm{TN}} + {\rm{FN}}}} \times 100$$
 $${\rm{F}} - {\rm{measure}}\;\left( \% \right)\; = {{2{\rm{TP}}} \over {2{\rm{TP}} + {\rm{FP}} + {\rm{FN}}}} \times 100$$
 $${\rm{AUC}} = {\rm{\;\;}}\mathop \int \nolimits_0^1 {\rm{ROC}}\left( {\rm{t}} \right){\rm{dt}}$$
where ROC is the receiver operating character, t = (1 – specificity), and ROC (t) is sensitivity. The value of AUC ranged from 0 to 1.
Statistical analysis
A summary of the entire analysis system is exhibited in Fig. 1, while the overall flowchart of the proposed ML-based approach is shown in Fig. 2. For all the explanatory variables, the basic characteristics of the current study are shown as frequency and percentage. Then, the dataset was properly verified and weighed for further analysis. The weighted prevalence of DBNCDs and TBNCDs was presented in the bivariate analysis. Chi-square tests showed the initial relationship between DBNCDs and TBNCDs with explanatory variables. Furthermore, a multilevel LR analysis was conducted after adjusting the covariates to examine the explanatory variables’ associations with DBNCDs and TBNCDs. Multilevel analysis is beneficial when samples are produced from a complicated survey design that includes multistage sampling such as the BDHS data because it exposes more accurate findings and lessens the effects of dependence across sampling clusters (Merlo et al., Reference Merlo, Yang, Chaix, Lynch and Råstam2005; Rabe-Hesketh and Skrondal, Reference Rabe-Hesketh and Skrondal2006; Ma et al., Reference Ma, Sakai, Wakabayashi, Kwon, Lee, Liu, Wan, Sasao, Ito, Nishihara and Wang2017). The multilevel LR results were presented using a p-value (<0.05). Finally, the significant variables obtained from multilevel LR analysis were further incorporated into ML-based algorithms to predict the performance of classifiers for both DBNCDs and TBNCDs. All the statistical analyses of this study were performed using Stata 16 and R version 4.2.2.

Figure 1. Overview of the entire analysis system.

Figure 2. The training/test set paradigm of the ML-based system.
Results
Basic characteristics of DBNCDs and TBCNDs
The basic characteristics of the respondents are presented in Table 1. Approximately, 45% of individuals were below 35 years old. More than half of the adults in the survey were females (56.9%). Most adults (80%) were currently married and working in some capacity (61%). Primary education was completed by 30.3% of respondents, while about one-fifth of respondents belonged to the richest quintile (22.2%). Approximately half of the respondents had more than four family members (57.6%) and had medium height (48.6%). Most adults neither consume caffeine (92.8%) nor were involved in any source of smoking (84.8%). Moreover, nearly two-thirds of respondents resided in rural areas (64.2%), while most adults (13.8%) came from the Dhaka division. Furthermore, the study found that 10%, 27.4%, and 24.3% of respondents had diabetes, hypertension, and overweight or obesity, respectively.
Table 1. Basic characteristics and prevalence of DBNCDs and TBNCDs in Bangladesh

Bold refers to significant results.
Herein, Table 1 revealed that the prevalence of DBNCDs and TBNCDs was 14.3% (95% CI: 13.5%–15.2%) and 2.3% (95% CI: 2.0%–2.6%), respectively. The prevalence of DBNCDs and TBNCDs were higher among respondents aged 45–54 years (21.9% and 4.4%), female (16.0% and 2.4%), formerly/ever married (17.4% and 2.8%), not working (16.8% and 2.7%), richest families (27.7% and 6.1%), short-heighted (15.8% and 2.2%), and those who drank caffeine (21.9% and 4.7%). Higher educated respondents (16.5%) and family size of less than four (14.6%) had the maximum prevalence of DBNCDs, whereas the TBNCDs were superior among the secondary-educated respondents (2.7%) and those with a family size of greater than four (2.2%). Consequently, DBNCDs and TBNCDs were both greatly prevalent among urban respondents (18.9% and 3.4%), adults with low community poverty (18.3% and 3.3%) and high community literacy (18.4% and 3.3%). DBNCDs were higher among the respondents in the Chittagong division (18.5%), whereas TBNCDs were the most prevalent among the respondents in the Dhaka division (3.3%).
Associated risk factors of DBNCDs and TBNCDs
This study focuses on the two-step analysis to find out the associated factors of DBNCDs and TBNCDs. First, the findings from the Chi-square analysis found that all factors were significantly associated with either DBNCDs or TBNCDs, except smoking status (Table 1). Then, a multilevel LR model was used to select the potential risk factors for both DBNCDs and TBNCDs. Results of multilevel LR analysis for both DBNCDs and TBCNDs were presented in Table 2. Age, sex, marital status, wealth index, education and major administrative region significantly predicted DBNCDs and TBNCDs (p < 0.05). Moreover, family size and community literacy were associated with only DBNCDs, whereas caffeinated drinks and community poverty were linked only with TBNCDs (p < 0.05). These significant factors were entered into ML-based algorithms for predicting both DBNCDs and TBNCDs.
Table 2. Two-level logistic regression analysis of study factors associated with DBNCDs and TBNCDs
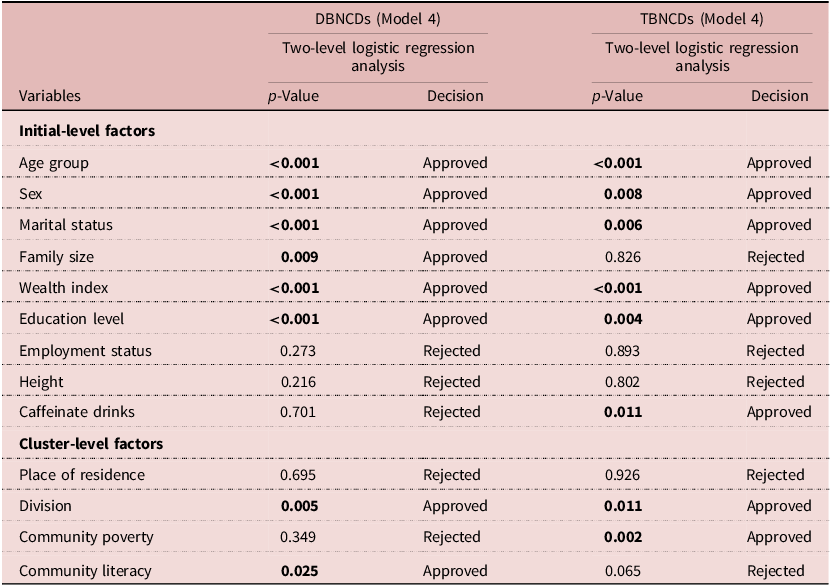
Bold refers to significant results.
Performance evaluation of six ML-based techniques
Figure 3 demonstrates the comparison of the accuracy of six different classifiers for three protocols (K2, K5, and K10). The findings were presented with the value of average classification accuracy. The results showed that with an increase in the number of protocols from K2 to K5 to K10, the classification accuracy of most of the classifiers also increased. In addition, the study found that the RF-based classifier performed better comparing the others considered classifier for the three protocols to predict both DBNCDs and TBNCDs. The RF-based classifier provided the highest classification accuracy as compared to other classification models for both DBNCDs and TBNCDs. Moreover, the RF-based classifier archived a classification accuracy of 77.88%, 80.19% and 81.06% for K2, K5 and K10 for DBNCDs, whereas the classification accuracy of 87.39%, 88.54% and 88.61% for K2, K5 and K10 was obtained by the RF-based classifier for TBNCDs. The correspondence results of both DBNCDs and TBNCDs and their violin plots of accuracy were also presented in Table 3 and Fig. 4, respectively. As shown in Fig. 4, the RF-based classifier delivered the highest accuracy, followed by XGBoost, whereas DT offered the lowest accuracy for both DBNCDs and TBNCDs.

Figure 3. Comparison of accuracy of six classifiers for DBNCDs and TBNCDs over K2, K5, and K10 protocols.
Table 3. Comparison of ACC (in %) and AUC of six classifiers for DBNCDs and TBNCDs over K2, K5, and K10 protocols

Bold refers to significant results.

Figure 4. Violin plot of the three partitions (K2, K5, and K10) CV for DBNCDs and TBNCDs.
Table 4 represents the other five performance assessment parameters, denoted as SE, SP, PPV, NPV, and FM, for six different classifiers of three different partition systems for DBNCDs and TBNCDs. In the case of the K10 partition protocol, the RF-based classifier gives the highest SE (82.38% and 92.12%), SP (79.76% and 85.16%), PPV (80.00% and 85.92%), NPV (82.16% and 91.67%), and FM (81.18% and 88.92%). On the contrary, DT had the lowest SE (43.02% and 49.98%), NPV (58.47% and 63.20%), and FM (52.30% & 60.28%) for both DBNCDs and TBNCDs. Furthermore, K2 and K5 partition protocols also provided almost similar results for both DBNCDs and TBNCDs.
Table 4. Five other performance evaluation parameters (in %) for six classifiers of DBNCDs and TBNCDs over K2, K5, and K10 protocols

Bold refers to significant results.
Receiver operation characteristics (ROC) evaluation
Figure 5 represents the ROC curves of six classifiers of three different protocols (K2, K5, and K10) for both DBNCDs and TBNCDs. The RF-based classifier performed a better AUC of each protocol for both DBNCDs and TBNCDs as compared to other classification models and their correspondence AUC values were illustrated in Table 3. As shown in Table 3, for K10 partition protocol, the RF-based classifier gave the highest AUC of 0.93, followed by XGBoost (0.86), KNN (0.81), LR (0.74), NB (0.69), and DT (0.64) for DBNCDs. In addition, the RF-based classifier gave the highest AUC of 0.97 for TBNCDS. However, results of AUC for K2 and K5 partition protocols, and RF classifier provide the highest AUC.

Figure 5. ROC curves of six classifiers for DBNCDs and TBNCDs over K2, K5, and K10 protocols.
Validation of methods
This study also utilised the BDHS 2011 dataset to validate the suggested procedure. The dataset consisted of a total of 5,223 participants, where the prevalence of DBNCDs and TBNCDs was 10.0% and 1.7%, respectively. Table 5 depicts the validation accuracy of the suggested method for DBCNDs and TBNCDs for all three protocols (K2, K5, and K10). In the case of K10, the RF-based classifier contributed to a better accuracy of 73.36% for DBNCDs and 83.80% for TBNCDs compared to DT, LR, KNN, NB, and XGBoost. Thus, the study may claim that the suggested procedure is a better classifier for DBNCDs and TBNCDs. It implies that the RF classifier is good and reliable for predicting both DBNCDs and TBNCDs.
Table 5. Validation of our proposed method using BDHS-2011 data over K2, K5, and K10 protocols

Bold refers to significant results.
Discussion
The increasing prevalence of NCDs and the associated burden have become a major public health concern for society and national governments across all countries including Bangladesh. Extant literature focused on the identification of risk factors and prediction of individual NCDs such as diabetes, hypertension, as well as overweight and obesity. Thus, this study primarily aimed to find out the most significant factors of DBNCDs and TBNCDs and their prediction using an ML-based technique. The two most popular methods, Chi-square test and two-level LR model, were used to find out the most significant factors of DBNCDs and TBNCDs. Furthermore, the study included six ML-based classifiers for prediction.
The prevalence of diabetics, hypertension as well as overweight and obesity was 10.0%, 27.4% and 24.3%, respectively. Moreover, DBNCDs and TBNCDs were prevalent among 14.3% and 2.3% of adults, which was greater than a preceding study conducted in Bangladesh, where except for diabetes (12%), the prevalence of hypertension and overweight and obesity were 27% and 22%, and the outcome of related types such as DBNCDs and TBNCDs accounted for 14% and 1.3%, respectively (Biswas et al., Reference Biswas, Townsend, Islam, Islam, Gupta, Das and Al Mamun2019).
Six ML-based classifiers delivered an accuracy ranging from 61.10% to 81.06% for DBNCDs and an AUC that ranged from 0.64 to 0.93, whereas for TBNCDs, the classification accuracy ranged from 67.26% to 88.61% and AUC ranged from 0.76 to 0.97 in the case of K10 protocol. RF-based classifiers achieved a remarkably higher accuracy of 81.06% and 88.61% and an AUC of 0.93 and 0.97 for DBNCDs and TBNCDs, respectively.
Limited research has been conducted to predict individual NCDs such as diabetes, hypertension, and overweight in Bangladesh (Guo et al., Reference Guo, Wu, Chumlea and Roche2002; Maniruzzaman et al., Reference Maniruzzaman, Rahman, Ahammed and Abedin2019; Islam et al., Reference Islam, Talukder, Awal, Siddiqui, Ahamad, Ahammed, Rawal, Alizadehsani, Abawajy, Laranjo and Chow2022). However, the prediction of DBNCDs and TBNCDs using 2017–2018 BDHS data has not yet been employed. For instance, a study was conducted in Bangladesh to detect and classify diabetes using the BDHS 2011, and among six ML-based classifiers, bagged classification and regression tree (Bagged CART) classifiers provide the highest ACC and AUC of 94.3% and 0.60, respectively (Islam et al., 2020). In another study conducted in the Kurmitola General Hospital, Bangladesh, DT, KNN, RF, and NB classifiers were used to categorise diabetes (Pranto et al., Reference Pranto, Mehnaz, Mahid, Sadman, Rahman and Momen2020). In that study, RF and NB classifiers performed well on diabetes datasets. A study adopted classifiers such as NB, DT, Adaboost, and RF classifiers to predict diabetic patients using the 2009–2012 National Health and Nutrition Examination Survey dataset in the USA. The combination of LR-based feature selection and RF-based classifier gives the highest accuracy of 94.25% and AUC of 0.95 for the K10 protocol (Maniruzzaman et al., Reference Maniruzzaman, Rahman, Ahammed and Abedin2019). Moreover, the RF-based classifier can better predict diabetes with an AUC value of 0.999 (Cheng et al., Reference Cheng, Ting, Ho and Ho2020).
Previously, some studies were conducted in Bangladesh as well as elsewhere to predict hypertension using ML techniques. BDHS 2017–2018 data were considered to predict hypertension using artificial neural network (ANN), DT, RF, and gradient boosting (GB) techniques. The performance of the GB technique gives the maximum accuracy of 66.98% and AUC of 0.669 as compared to others (Islam et al., Reference Islam, Rahman, Roy, Tawabunnahar, Jahan, Ahmed and Maniruzzaman2021). Another study conducted in a private university of Vitoria da Conquista, Bahia, Brazil, predicted that increased blood pressure was related to hypertension and found that classification tree analysis performed best (Golino et al., Reference Golino, Amaral, Duarte, Gomes, Soares, Reis and Santos2014). Another study also found that neural network models perform better in predicting hypertension (AUC = 0.766) in several rural villages of Xinxiang County, Henan province in Central China (Zhang et al., Reference Zhang, Yuan, An, Zhao, Wu, Li, Wang, Sun, Li, Ding and Zeng2020). In Hyderabad and India, researchers sought to develop an ML-based algorithm for the risk stratification of NCDs diseases like diabetes and hypertension. The study considered five ML-based models, namely DT, KNN, Adaboost, RF, and LR, as well as the results indicated that the highest performance scores were outperformed for both diseases by the RF-based model (Boutilier et al., Reference Boutilier, Chan, Ranjan and Deo2021). In addition, another study was carried out to predict hypertension in three South Asian countries of Bangladesh, Nepal, and India using GB, RF, DT, and ANN ML-based techniques. The GB provided the highest accuracy (66.98%), FM (78.99%), and AUC (0.669) as compared to other methods (Islam et al., Reference Islam, Rahman, Roy, Tawabunnahar, Jahan, Ahmed and Maniruzzaman2021).
In modern times, being overweight and obese has become a significant threat worldwide; hence, their early prediction is very important. A study in Bangladesh used KNN, RF, LR, multilayer perceptron, support vector machine (SVM), NB, adaptive boosting, DT, and GB classifier to predict obesity and found that the LR algorithm achieves the highest accuracy of 97.09% as compared to the other classifiers (Ferdowsy et al., Reference Ferdowsy, Rahi, Jabiullah and Habib2021). Meanwhile, another study on obesity was conducted in the United Kingdom using its millennium cohort data and found that the multilayer perceptron algorithm resulted in a minority class accuracy of 54% for the imbalanced dataset but jumped over 90% in the case of balanced data (Singh and Tawfik, Reference Singh and Tawfik2020). Furthermore, another study predicts obesity using publicly available genetic profiles. Some most popular ML techniques, including GB, generalised linear model, CARTs, KNN, SVMs, RF, and multilayer perceptron neural network, are used to predict obesity and found that SVM generated the highest AUC value of 90.5% (Montañez et al., Reference Montañez, Fergus, Hussain, Al-Jumeily, Abdulaimma, Hind and Radi2017). A study on overweight or obesity conducted in China found that GB machine (ACC = 0.9454) performed best when compared among the considered ML-based techniques including LR, DT, SVM, RF, KNN, gradient boosting machine (GBM), XGBoost, light gradient boosting machine (LGBM), and NB (Wang et al., Reference Wang, Yang, Pang, Xue, Zhang, Zhang and Niu2022).
Another study was also conducted in Bangladesh based on NCDs and found that the gradient boosting decision tree (GBDT)-based model yielded the greatest AUC of 0.91 with an accuracy of 67.5% (Hu et al., Reference Hu, Nohara, Wakata, Ahmed, Nakashima and Nakamura2018). Meanwhile, another study focused on smoking-induced NCDs prediction and used the National Health and Nutrition Examination Survey datasets from South Korea (KNHANES) and the United States (NHANES). The study included the following three feature selection techniques and six classifiers: LR, RF, KNN, MLP, NN, and XGBoost. Under hybrid feature selection, XGBoost provided the highest accuracy of 88.12% with an AUC value of 0.84 (Davagdorj et al., Reference Davagdorj, Pham, Theera-Umpon and Ryu2020). Further study concentrated on predicting and diagnosing NCDs by adopting six classifiers (ANN, SVN (RBF), DT, LSTM, NB, and RF). The study used a total of 26 attributes and found that DT provided the highest accuracy of 99% (Fatou et al., Reference Fatou, Ibrahima, Camara and Alassane2020).
Strengths and limitations of this study
In addition to validated indicators as well as biomarker analyses of the wealth index, the principal strengths of the present investigation were the utilisation of a demographically representative survey that gathered information on blood glucose, blood pressure, body height, and weight measurements by qualified professionals based on established standards. Second, from the latest available information, this study utilises a two-level LR approach on DBNCDs and TBNCDs. Finally, the use of the three-partition CV protocol with selected classifiers provided an accurate performance measurement of NCDs. However, despite the various positive aspects of the study, there are also some drawbacks. First, the causal route of this study could not be constructed because it was a cross-sectional study; thus, it simply provides the association between explanatory and outcome variables. Second, the information on fruit and vegetable consumption was not accessible considering that is one of the nine voluntary agreed-upon global objectives that the WHO has announced. Third, BMI was the only procedure that was used to ascertain the dietary status of individuals following the WHO standards. However, this procedure is not as accurate as some of the others that are available, such as DEXA methods, waist–hip ratio as well as bioelectrical impedance, which are used to measure the status of being overweight and obese.
Conclusion
This study offered the latest and most detailed knowledge related to NCDs in Bangladesh and concludes that age group, sex, marital status, wealth index, education level, and division were significantly associated with both DBNCDs and TBNCDs. Moreover, family size and community literacy were substantially related to DBNCDs, whereas a notable connection was observed between TBNCDs with caffeinate intake and community poverty. Furthermore, the use of an RF-based classifier on all three CV protocols (K2, K5, and K10) provided the best performance for both DBNCDs and TBNCDs by considering the selected risk factors. Thus, a population-based approach utilises the healthcare sector and draws attention to the trend of these illnesses within demographics to detect and treat diseases at an early stage, as well as lower the possibility of getting DBNCDs or TBNCDs. In addition, non-health strategies such as multisectoral partnership, information and knowledge management, as well as innovations need to be set as priorities to address determinants of DBNCDs and TBNCDs.
Acknowledgements
The authors of this study would like to thank the DHS programme, ICF International for providing us with the dataset for analysis. The authors also would like to acknowledge the contribution of Statistics Discipline, Science, Engineering and Technology School, Khulna University, Khulna-9208, Bangladesh.
Funding statement
This research received no specific grant from any funding agency, commercial entity, or not-for-profit organisation.
Competing interests
The authors have no conflicts of interest to declare.
Ethical standard
The BDHS data collected from secondary sources and obtained the required ethical approvals from National Ethics Committee of the Bangladesh Medical Research Council. We registered and requested access to data from the DHS website. DHS programmes collect data following written informed consent from each individual. The survey was conducted in accordance with relevant guidelines and regulations.


