


Introduction
Several observations by the space probe Cassini have shown that Saturn's moon Enceladus has the potential to bear extraterrestrial life; at its active south polar region jets of gas and ice grains containing organic compounds (Waite and others, Reference Waite2017) escape through fractures located in four large parallel valleys called tiger stripes. The material of these jets, called plumes, originates from a global saline ocean below the moon's thick icy crust (Parkinson and others, Reference Parkinson, Liang, Yung and Kirschivnk2008; Thomas and others, Reference Thomas2016). With temperatures of up to 165 K (Spencer and others, Reference Spencer2006), the tiger stripes are significantly warmer than the average surface temperature of 75 K which hints toward a hydrothermal source of energy (Choblet and others, Reference Choblet2017). This region is considered a promising candidate for the search for extraterrestrial life.
Because of this potential, the German Aerospace Center (DLR) space administration started the Enceladus Explorer (EnEx) initiative in 2012 to develop base technologies for a future space mission to Enceladus (Kowalski and others, Reference Kowalski2016), to search minimally invasively for extraterrestrial life. In the mission's scenario, a lander is deployed on the surface of Enceladus in the region of the tiger stripes carrying a maneuverable melting probe. Since landing close to the water-bearing fractures is too risky, the landing site has to be at a safe distance (Konstantinidis and others, Reference Konstantinidis2015). After landing, the maneuverable melting probe is then deployed by the lander and has to navigate several 100 m toward the fractures searching for a water-filled crevasse close to the surface. Since the local conditions on Enceladus are unknown and the communication has a latency of 70 and 90 min (Durst and others, Reference Durst, Feighery and Scott2000), all devices involved have to operate autonomously. Once the crevasse is reached, the probe minimally invasively penetrates the ice–water interface for taking an uncontaminated water sample and analyses the sample in-situ for signs of microbiological life. Such a maneuverable probe, the EnEx probe (IceMole), together with in-ice navigation technologies have been developed and demonstrated within the joint EnEx project between 2012 and 2015 (Dachwald and others, Reference Dachwald2014; Kowalski and others, Reference Kowalski2016). The IceMole is a 2 m long melting probe with an on-board navigation system including acoustic sensors. It utilizes an ice screw and differential heating allowing movement against gravity and curved trajectories. With a maximum forward heating power of 2.88 kW it reaches a melting speed of up to 1 m h−1. This initial joint EnEx project was followed by several specifically focused projects to further increase the technology readiness level of the developed technology.
One of those projects was Robust autonomous Acoustic Navigation in Glacial icE (EnEx-RANGE). A central goal of EnEx-RANGE was to improve the navigation capabilities of the IceMole. The main concept is the introduction of a network of melting probes with acoustic instrumentation into the ice around the trajectory of the IceMole as shown in Figure 1. All systems are connected to a surface station, called Range-Control-System (RCS). These melting probes are referred to as the Autonomous Pinger Units (APUs). The APUs are brought into the ice volume together with the IceMole and once deployed set up an acoustic navigation network; the APUs send and receive acoustic signals and measure the transit times. By using these transit times, external supporting information and trilateration algorithms, the position of all APUs in the acoustic navigation network is determined. Once the network is set up, it is used by the IceMole as a reference system for trajectory planning. Similar to the APUs, the IceMole is equipped with acoustic sensors and its position is determined using trilateration algorithms as well. The acoustic navigation network autonomously optimizes the positions of the APUs for optimal localization of the IceMole. The network descends with the IceMole into the ice.
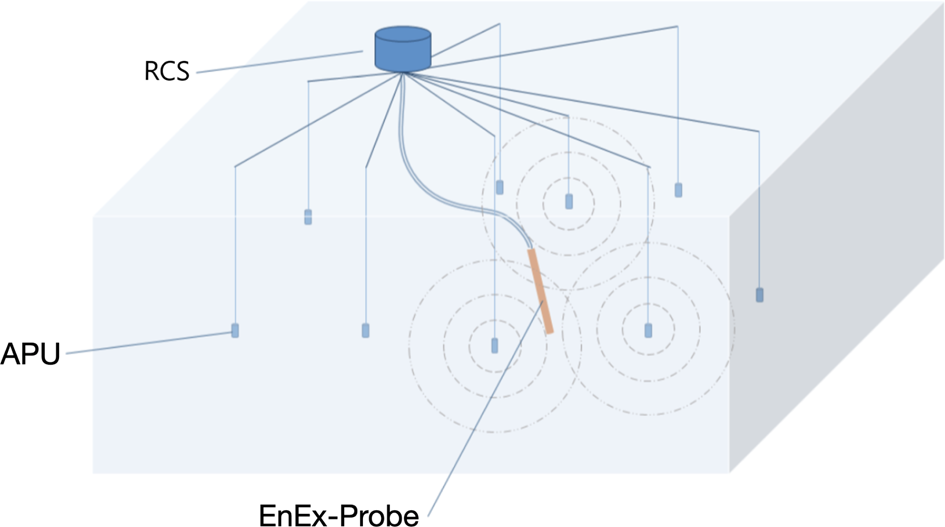
Fig. 1. Schematic mission scenario; the lander deploys the IceMole that navigates through the ice using a network of APUs.
The Autonomous Pinger Unit
The APU is a melting probe equipped with a powerful acoustic emitter and sensitive receivers. Its melting system utilizes heating cartridges in combination with a novel-shaped, high efficient melting head made from a copper alloy (Heinen and others, Reference Heinen, Linder, Zierke and Wiebusch2021). A data system with various auxiliary sensors is used to monitor the internal state of the APU and delivers input for position estimation.
As mentioned before, the APUs measure the transit times of acoustic signals between each other or between the APUs and the IceMole for position measurements. All APUs and the IceMole are time synchronized using dedicated synchronization modules which allow the probes to start the emission of an acoustic signal and the data acquisition synchronously. Thus, the precise measurement of transit times between the probes is possible. With these transit times and the speed of sound in ice the distances d x,y within the configuration are determined as illustrated in Figure 2. Then, using trilateration methods as in Zierke (Reference Zierke2019), the positions of the APUs and the IceMole are reconstructed. Additionally, the APUs analyze the acoustic signals gathering information about the instrumented ice volume. Based on the optimization target, e.g. the size of the navigation volume, the precision of the localization or the signal quality for the planned trajectory of the IceMole, the APUs change their position accordingly by melting deeper into the ice volume.
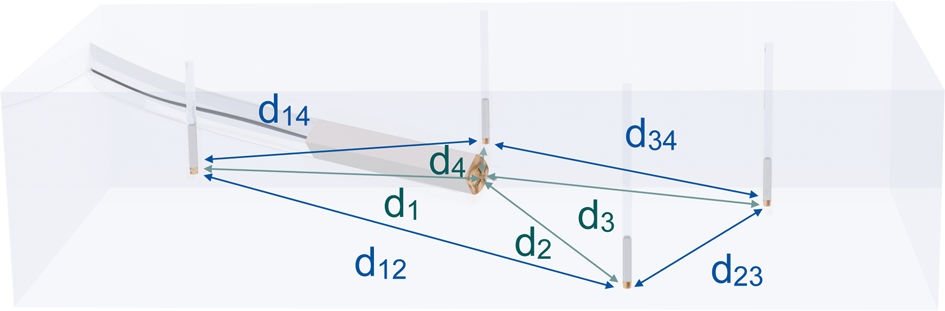
Fig. 2. Illustration of trilateration within the acoustic network consisting of four APUs and the IceMole.
A cross-section and closed view of an APU is shown in Figure 3 giving an overview of the components inside the pressure housing. The block diagram in Figure 4 shows the connections between all components. The APU requires 230 VAC line voltage connection for power, synchronization and power line communication. The probe can be connected to line voltage using the external connector. The line voltage from the connector is fed into a power line communication adapter for Ethernet connection. This Ethernet connection is used to communicate with a MicroZed System-on-Chip (SoC) module (Avnet, Reference Avnet2015) that executes the software controlling all tasks required for operation. The SoC module is connected to a carrier board that provides several serial interfaces for the MicroZed to control and communicate with the other components of the APU. This carrier board also generates and distributes the low voltage power supply and hosts auxiliary sensors that can be accessed over a serial data bus (I2C). Acoustic signals are received by three side receivers and read out via an SPI serial bus by the MicroZed SoC module. The pinger is used as a front receiver as well. The waveform data for emission are sent over an I2C bus to the pinger front end, where the signal is generated with up to ±300 V to drive the acoustic emitter. The required power is derived from the line voltage by the pinger power supply and can be adjusted by an on-board controller. For synchronization the APU utilizes a dedicated synchronization module. This module also hosts a power monitor that monitors the input current and voltage of the external line voltage connector. The line voltage is also used by the melting system which can be controlled over I2C. The whole system is contained in a cylindrical housing with an outer diameter of 80 mm and has a total length of about 0.9 m. The hull is made from 2 mm thick stainless steel and is sealed with o-rings providing a pressure sealing of up to 20 bar. The probe is connected to its power and communication source via a water-tight 3-pin connector.

Fig. 3. Components of an APU: (1) melting head with acoustic emitter (pinger), (2) heater TRIAC ring, (3) side receivers with front end electronics, (4) front receiver front end electronics, (5) pinger front end electronics, (6) heater controller, (7) pinger power supply, (8) MicroZed SoC module, (9) SoC carrier board, (10) power monitor and synchronization module, (11) low voltage power supply, (12) power line communication adapter, (13) sealing end with back heater, (14) pinger hull, (15) main hull and (16) external connector (cabling omitted for clarity).
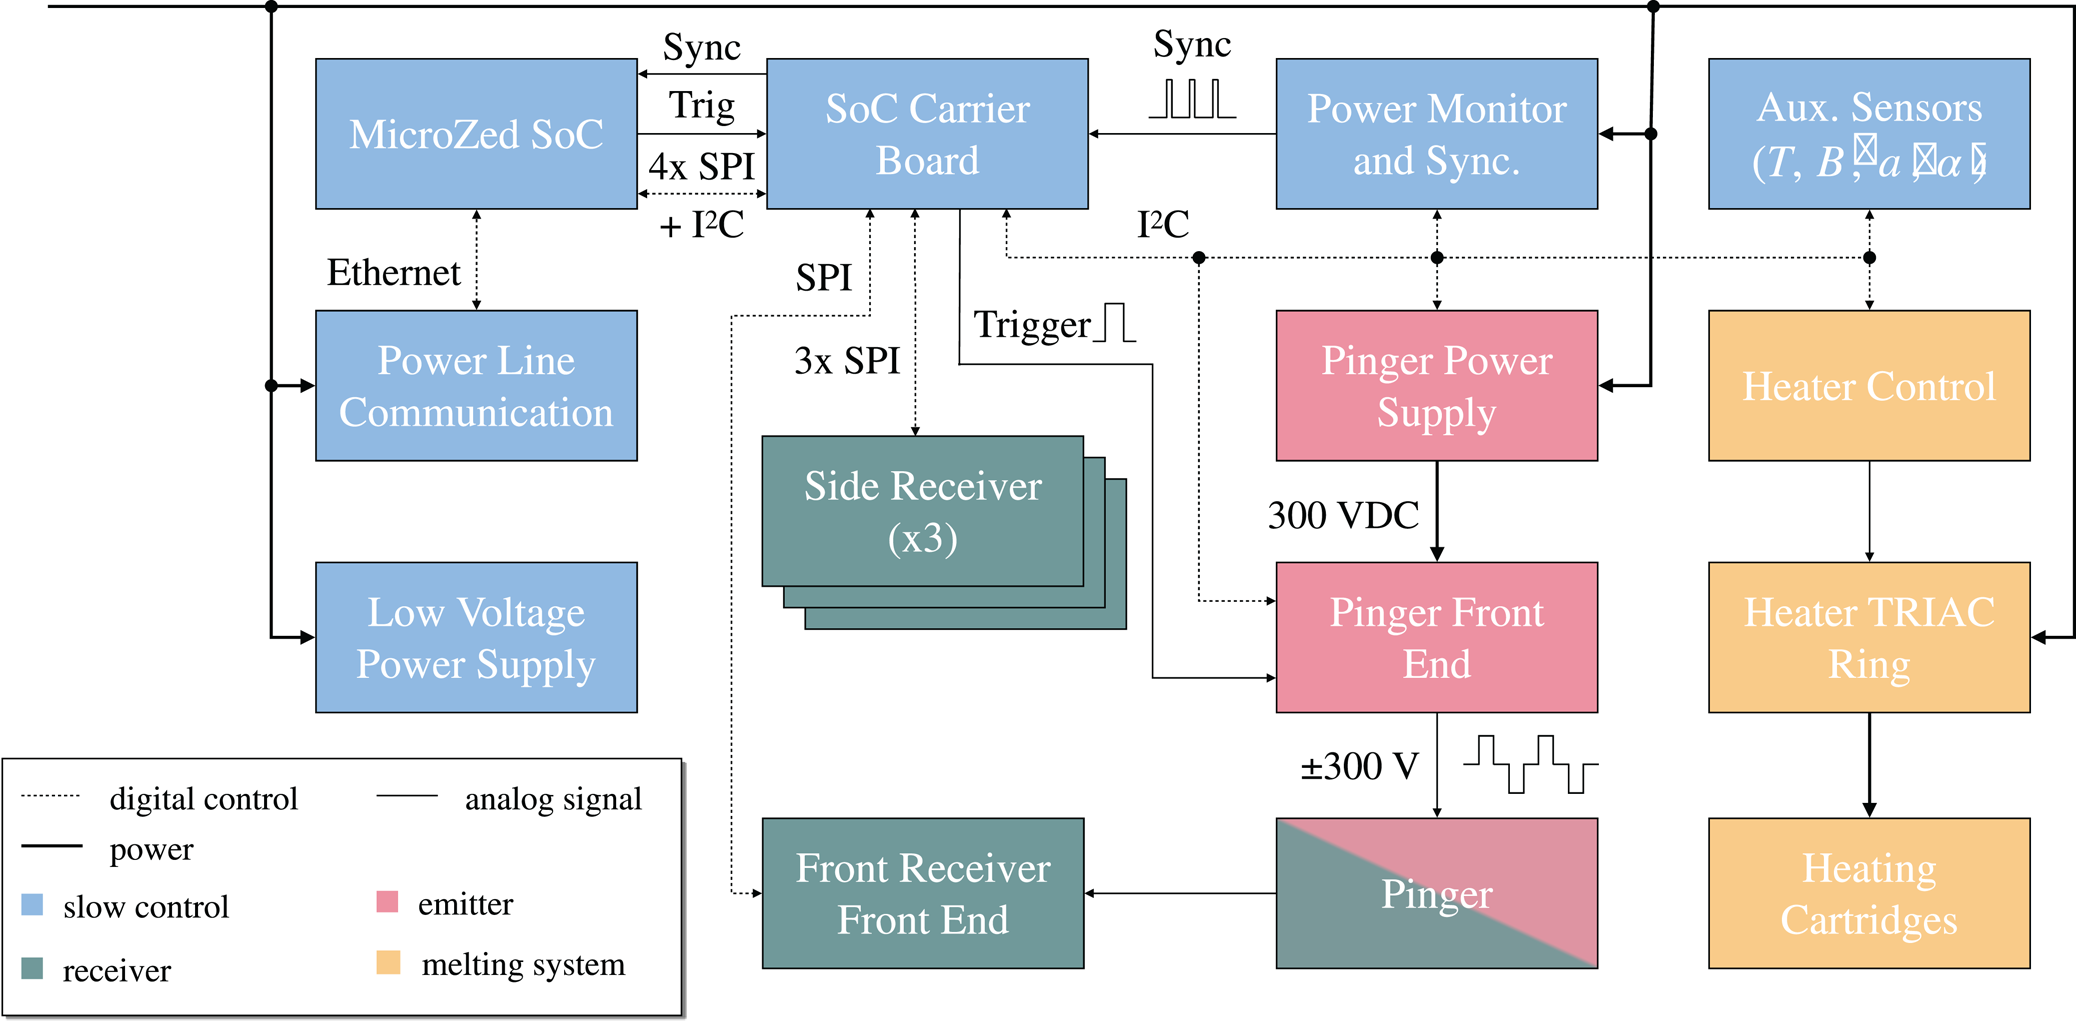
Fig. 4. Block diagram of an APU containing slow control, emitter, receiver and melting system; low voltage power supply connections (12, 5 and 3.3 V) are omitted for clarity.
The following sections describe the functionality and performance of the APU custom developed hardware in more detail. For a detailed description of the design of the hardware, technical drawings and schematics see Weinstock (Reference Weinstock2019); Zierke (Reference Zierke2019). More information on the navigation technology and position reconstruction is given in Zierke (Reference Zierke2019). For further details on the acoustic systems developed by the joint EnEx project refer to Eliseev (Reference Eliseev2018); Heinen (Reference Heinen2018).
Melting system
The melting head of the APUs uses 12 embedded 200 W heating cartridges and is made from a copper alloy for good heat distribution. Each heating cartridge is protected from overheating with a thermo switch and switches off at 100°C with a hysteresis of 30°C. The novel shape of the melting head was developed and a patent application filed during EnEx-RANGE and allows for an optimized heat flow (Linder and others, Reference Linder, Zierke, Heinen and Wiebusch2018). This results in a typical melting speed of v m = 3.5 m h−1 at a maximum power consumption of P max = 2400 W in-situ (Heinen and others, Reference Heinen, Linder, Zierke and Wiebusch2021). The 12 heating cartridges are organized in five groups such that the output power of the melting system can be increased in steps of 200 W. Each group is supplied with 230 VAC line voltage that is controlled by TRIACs located on the heater TRIAC ring including a compact driver circuit. The groups can be switched on and off individually by the heater control. In addition to the melting head the APU is also equipped with back heaters consisting of three 200 W heating cartridges placed in the stainless steel sealing end of the probe. These heaters are used to recover the APUs in the case of a slight reduction of the melt channel due to refreezing of the water. A freezing of the power cable or hull was not observed on alpine glaciers. For polar environments, where the melt water will wick into the firn, a special version of the APU was developed, where the sidewalls are equipped with heater foils and the power cable is covered in a water-repellent material (Heinen and others, Reference Heinen, Linder, Zierke and Wiebusch2021). For cold, water-filled holes a uncoiling of the cable from the inside of the probe is necessary in order to guarantee advancement, even if the melt channel is completely frozen.
Auxiliary sensors
The APU utilizes several auxiliary sensors to monitor its internal state and assist the position estimation. The sensors are accessed by the MicroZed via an I2C interface provided by the carrier board as shown in Figure 4. The monitored parameters will be briefly discussed in the following sections.
Temperature
Six temperature probes are distributed throughout the APU and used as a control feedback. Three sensors are placed inside the melting head monitoring the heat generated by the melting system. A high rise in temperature indicates poor heat flow caused by insufficient contact to the ice. The melting system can then lower the power or shut down to avoid damage to the heating cartridges. The other three temperature probes monitor the heat distribution inside the APU and are placed on the sensor ring, the barrier board, and the power monitor and synchronization module. The sensors used are the DS18S20 and DS18B20 1-Wire temperature probes by Maxim Integrated. They provide a precision of 0.5°C for a temperature range from − 10 to 85°C (total operating range − 50 to 125). A 1-Wire-to-I2C bridge (DS2482-100 by Maxim Integrated) is used to make the sensors available over I2C.
Pressure
A pressure sensor LPS25HB by STMicroelectronics on the carrier board is used to measure the internal pressure. The nominal pressure inside the APU is typically 400 mbar and deviations from this value indicate a leak or insufficient pressure tightness. In such a case during a lab or field test, the APU is recovered to avoid damage to the internal electronics. The LPS25HB provides an operating range of 260–1260 hPa with an accuracy of ±1 hpa over a temperature range of 0–80°C.
Inertia and magnetic field
The carrier board is also equipped with a small inertial measurement unit to assist the navigation; the MPU-9250 by TDK IvenSense features a three axis accelerometer, gyroscope and magnetometer. The data provided by these sensors are used in an attitude and heading reference system (AHRS) algorithm (Madgwick and others, Reference Madgwick, Harrison and Vaidyanathan2011) to calculate position information.
Power monitor
The power consumption of the APU is monitored at the line voltage input. During the melting procedure, the power consumption is dominated by the current draw of the heating cartridges. Thus, the power monitor is used to verify the functionality of the melting system and assist the position estimation of the APU. The input current is measured by an ACS714 hall-effect-based current sensor by Allegro while the input voltage is attenuated by a voltage divider and sampled by an ADC.
Front and side receiver
The APU is equipped with three acoustic side receiver and the pinger is also used as a front receiver. The side receivers use three small PIC255 piezo ceramic discs by PI Ceramic (PI Ceramic, Reference PI Ceramic2016). The discs have a diameter of 10 mm and a thickness of 3 mm. The contact surface on the inner hull is flattened and polished to provide an even contact area for the piezo discs, which are glued to the APU hull using epoxy glue. The front end electronics are mounted on a holding ring and contact the piezo discs using spring contacts. The whole assembly is shown in Figure 5. The signal from the piezo discs is amplified by 60 dB and split into two signal paths. One signal path uses a band pass filter with a small bandwidth (f c = 10 kHz) while the other uses a band pass filter with a wider bandwidth (f −3 dB = 1 kHz…80 kHz). The magnitude of the frequency response of both filters is shown in Figure 6 and was measured using the UPV Audio Analyzer by Rohde & Schwarz. The filtered signals are then digitized separately by their own Analog-to-Digital Converters (ADCs). The ADCs are read out by the data system using SPI at a maximum sample rate of 3 MS s−1.

Fig. 5. Detail view of the APU front and side receivers.
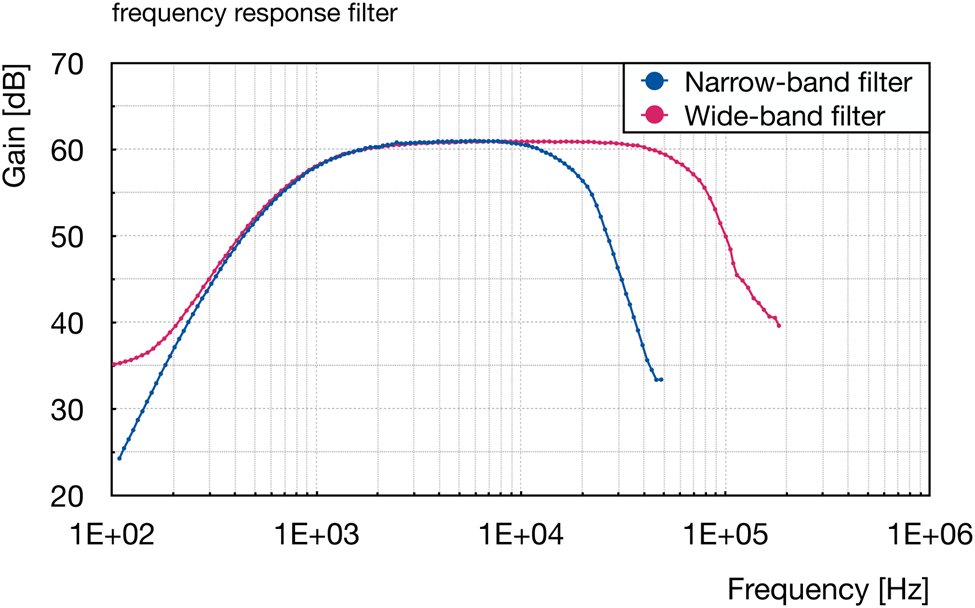
Fig. 6. Frequency response of the acoustic side receiver front end electronics.
The design of the front receiver front end is similar to the side receivers’; the signal is amplified by an adjustable factor of 60–92 dB and also split into two channels. The gain can be set using an I2C interface. The amplifier circuit is additionally protected by resistors and over-voltage protection diodes to shield the sensitive electronics from the high voltage pulses generated by the pinger front end during operation of the pinger. Like the side receiver front ends, the two ADCs of the front receiver are read out by the data system using SPI.
Emitter system
The emitter system allows the APU to send acoustic signals over long distances and consists of three components; the pinger power supply provides the power for the pinger front end to drive the acoustic emitter, or pinger, as shown in Figure 4. All these components and their performance are described in detail in Weinstock (Reference Weinstock2019).
Pinger power supply
The pinger power supply is a primary side controlled single switch forward converter that converts the 230 VAC line voltage to a regulated output voltage ranging from 100 to 300 VDC and provides galvanic isolation. The power supply controller can be accessed via I2C which allows adjustment and monitoring of the output voltage. Large electrolytic storage capacitors with a total capacitance of C tot = 900 μF are charged with the resulting output voltage at a peak output power of P max = 130 W. This capacitance is needed to provide an average power of $\bar {P} = 770\, {\rm W}$ over the maximum period of t max = 10 ms at a voltage drop of U out = 300 V…270 V for the emission of acoustic signals.
Pinger front end
The pinger front end is a high-power, MOSFET-based full bridge driver that drives the acoustic emitter. The front end produces rectangular pulses with voltage levels of − 300, 0 and 300 V at a sample rate of up to 2 MS s−1 which can be used to approximate arbitrary waveforms. Without electrical load, the output pulses reach rising and falling edges of t rise/fall = 100 ns. With these performance characteristics the pinger front end can also be used as a class-D amplifier (Gaalaas, Reference Gaalaas2006). The data system transfers the waveforms to the pinger front end via I2C and emits an acoustic signal using a separate trigger line.
Piezoelectric acoustic transducer
The acoustic emitter of the APU, the pinger, is a Tonpilz-style transducer (Sherman and Butler, Reference Sherman and Butler2019) with a resonance frequency of f res = 9 kHz and high output power. A Tonpilz transducer uses a tail mass, a driving stack and a head mass to decouple sound into the acoustic medium. The pinger utilizes the melting head as a head mass which ensures optimal coupling to the acoustic medium. The driving stack consists of eight Sonox P4 punched piezo disks (CeramTec, Reference CeramTec2010) and is inserted between head and tail mass. The disks are electrically connected in parallel and mechanically in series. To increase the efficiency of the transducer, a mechanical pretension of T A = 19.6 MPa is applied to the driving stack using a threaded rod and a countered nut. The pretension nut is buffered using a Belleville washer. A cross-section of the assembly is shown in Figure 7.
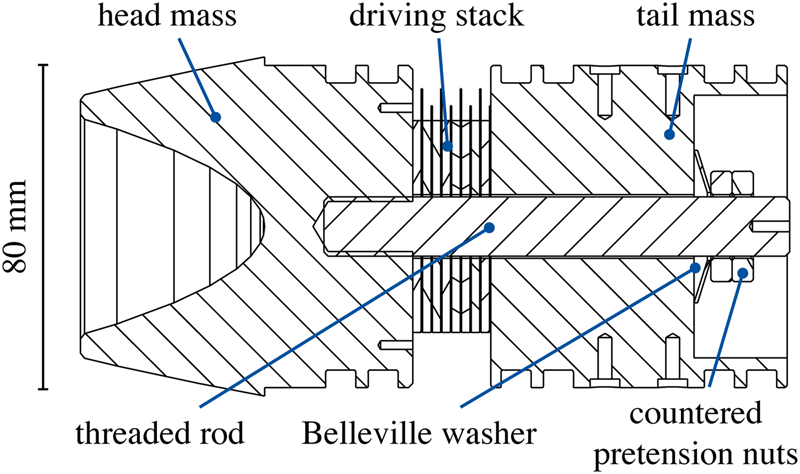
Fig. 7. APU melting head including the tonpilz transducer assembly in cross-sectional view.
For use on Alpine glaciers, measurements of the acoustic attenuation (Meyer and others, Reference Meyer2019) have indicated that a resonance frequency of the pinger of about 10 kHz or lower is favorable. The analysis and optimization of the pinger is based on simulations using the electromechanical equivalent circuit for Tonpilz-transducers. The results of these simulations and the measurements of the conductivity of an unloaded pinger are shown in Figure 8. Simulation and measurement are in good agreement around the main resonance. The higher resonances are not observed since they are not taken into account by the model. The measurements show a main resonance of f r = 9 kHz which meets the requirements.
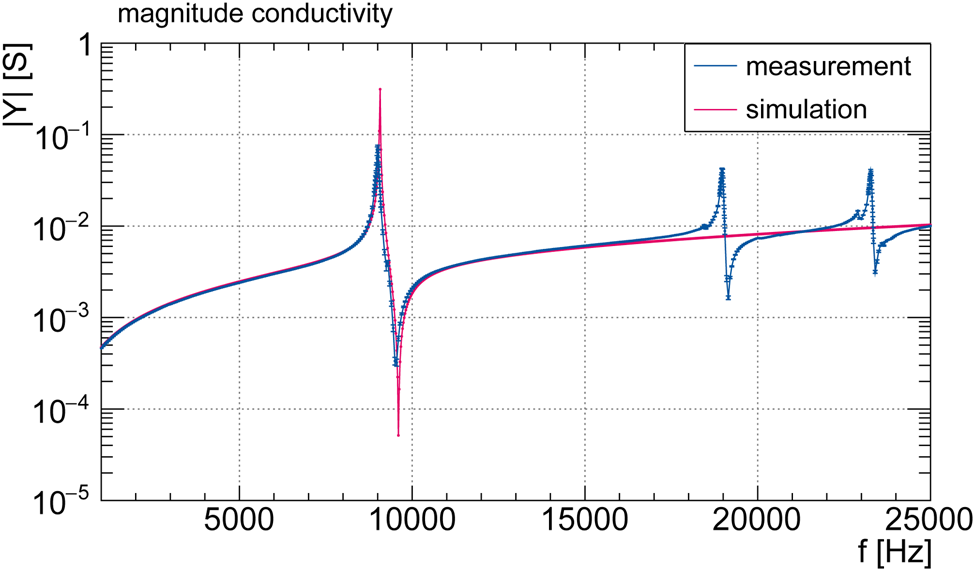
Fig. 8. Simulation and measurement of the electrical conductivity showing the (anti-)resonances of the pinger; also the absolute off-resonance conductivity is correctly predicted over the full range. The two visible higher order resonances have not been included in the simulation.
Data system
The data system runs the system software and provides a user interface to control the APU. It manages the acoustic signal emission and data acquisition, reads the auxiliary sensors to monitor its internal state, and controls the melting process.
Hardware
In order to meet the requirements of the APU and manage the high data throughput during acoustic measurements, it was decided to use a System-on-Chip module for the data system. The module used in the APU is the MicroZed AES-Z7MB-7Z020-SOM-G by Avnet. The main component of this module is the chip XC7Z020-1CLG400C from Xilinx. In addition to this SoC, the module contains two DDR3 memory chips providing a total 1 GB RAM and an Ethernet interface. The module contains pin headers, which are driven by the main chip's general purpose I/O pins and accessible through the carrier board. The board features several connectors for the APU subsystems, a microcontroller, that monitors the I2C bus, the low voltage distribution for the subsystems, and multiple auxiliary sensors for slow control and housekeeping, as described previously.
Under normal operation, an SoC-based embedded system does not require an additional processor or embedded PC. This is achieved through the self-sufficient internal structure the SoC, which includes two important parts; one (or more) microprocessor core(s) including all necessary processor core peripherals, which is called the Processor System (PS), and a FPGA-like partition of Programmable Logic (PL).
Software and firmware
The PS and PL are used in this application for fundamentally different tasks; the PL runs the operating system (official Linux kernel from Xilinx (Xilinx, Reference Xilinx2020) with a Debian root file system), provides access to the standard Linux drivers (I2C, Ethernet, etc.) as well as custom developed, PL-specific drivers (communication with those logic modules implemented in the PL), and executes higher level software applications. The logic modules implemented in the PL are used for time-critical tasks like the acoustic data acquisition (time-synchronous readout and transport to RAM), signal processing (averaging with a set factor), time synchronization (acquisition of synchronization pulses and their enumeration) and the emission of time-precise trigger signals for the pinger front end. Communication between the PS and PL partitions of the SoC is done using AXI-Stream for waveform data transfer and AXI-Lite for controls interfaces (Crockett and others, Reference Crockett, Enderwitz, Elliot and Stewart2014). The structure of the firmware is shown in Figure 9.
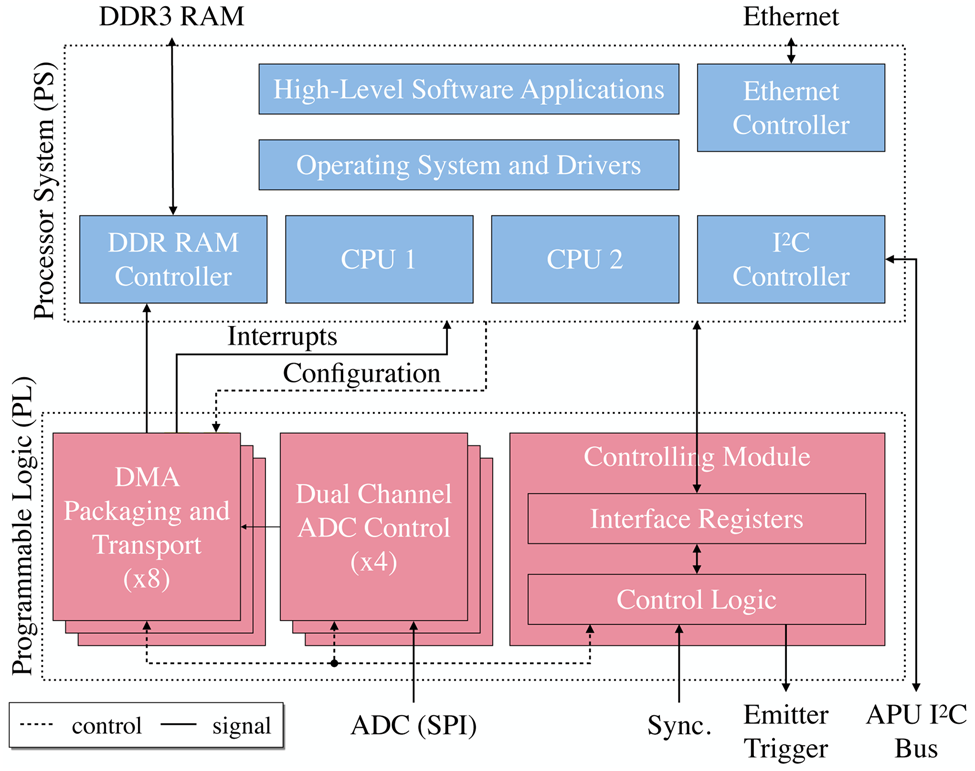
Fig. 9. Structure of the implemented firmware modules in the programmable logic.
In total, eight acoustic channels, two for each acoustic receiver front end, are read out via SPI with a sample rate of 2 MS s−1. The successive ADC samples can be averaged with an averaging factor directly in the PL, that can be set via software. This results in a higher ADC resolution, though with a consequently lower total sampling rate. The resulting samples are buffered in RAM. The data transport from the sensor's ADCs to the RAM is provided without any utilization of the PS processor cores. The core component for each transport chain, instanced in the PL, is the AXI-DMA (Crockett and others, Reference Crockett, Enderwitz, Elliot and Stewart2014). After the acoustic waveforms of a required length are stored in RAM, an interrupt is issued to the PS. The interrupt notifies the PS that the stored data can be analyzed by higher level software. Looking back at the PL functionality, it is important to mention that the configuration of data transport paths (the length of the digitization window, averaging parameters, etc.) as well as switching the data transmission on and off, is carried out by the control signals from the module for general control. This module also contains a 64-bit system clock with a granularity of 10 ns, a counter for the recorded synchronization pulses, and other logic units. For this purpose, the module for general control contains the interface registers, accessible from the software in the PS through the custom developed drivers.
The I2C bus is driven by an I2C controller which is present in the PS among other periphery. The I2C controller can be addressed by a standard Linux driver from the software level. The high-level control software, which runs on the Linux operating system in the PS, consists of several individual modules that communicate with each other via the local area network. The submodules of the system software perform individual dedicated tasks, e.g. address the Linux drivers, take part in the synchronization process via the Network Time Protocol (NTP) (Mills, Reference Mills1991), or implement the autonomy and trilateration algorithms. All data are sent to a central hub on the surface, the RANGE Control System (RCS). From here it can be accessed and displayed through a local area network by a web interface, which allows monitoring and controlling the APUs by multiple clients.
Synchronization
As the first step, the system clocks of all systems are synchronized via the local area network. The NTP used here achieves an accuracy in the order of milliseconds, but for the acoustical position determination a higher accuracy is required. Therefore as a second step, the common 230 VAC line voltage is used in the APUs to generate a signal that is synchronous in time in all systems. To do this, the synchronization module detects the zero crossing of the 230 VAC line voltage via a comparator circuit with adjustable threshold value and generates a logic level synchronization signal. This synchronization signal is fed to the SoC and the clock cycles since system startup are counted. Differences in the counted clock cycles are corrected on each rising edge of the signal via network communication by correcting all systems to the highest clock count. Individual synchronization modules can be synchronized with each other by manually adjusting the threshold value to achieve an accuracy in the order of a hundred nanoseconds. A comparison between two synchronization signals at two APUs measured in the laboratory before the assembly shows the variation of rising edges of the synchronization signal of 39 ns (see Fig. 10). This jitter is more than 2 orders of magnitude smaller than the acoustic sample time and thus it will not affect the transit time determination. Data acquisition and signal generation will be activated by the SoC when a rising edge of the synchronization signal is detected that belongs to a clock count previously defined by the control software. As a result, each transmitted acoustic pulse is synchronous with an edge of the synchronization signal and no shifting occurs between the systems over a longer period of time.
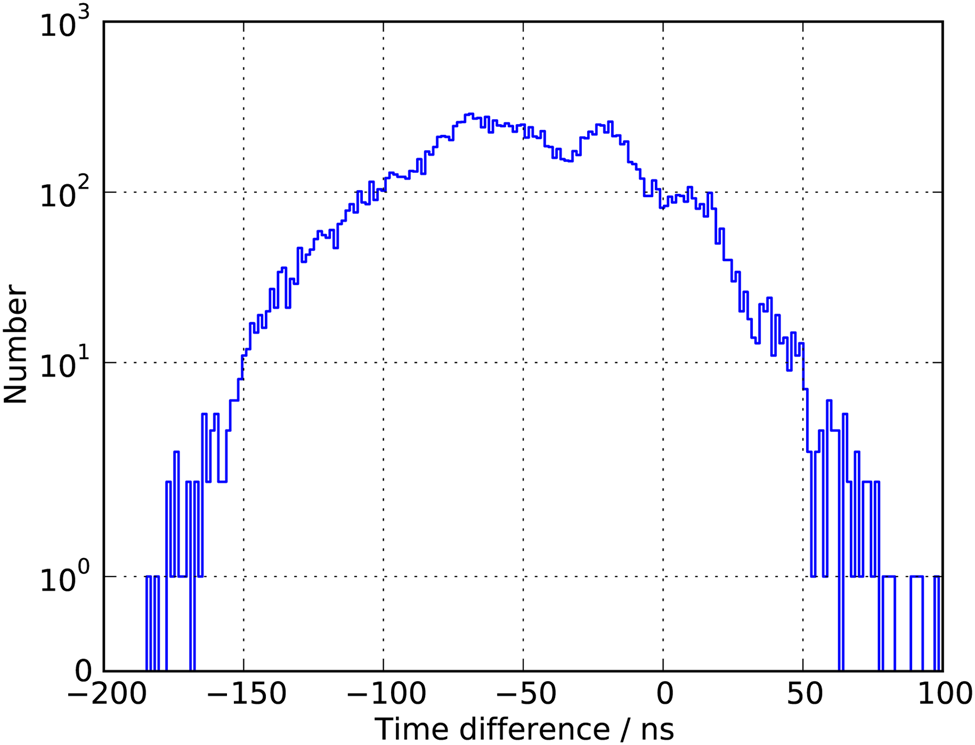
Fig. 10. Distribution of the time difference between the rising edges of the synchronization signals of two different synchronization modules used for the APUs and the APS; the standard deviation is 39 ns.
Field test performance results
Field test configuration
The APUs were tested on several glaciers in the Alps and on the Ross Ice Shelf in Antarctica, an overview of these tests and the melting performance is discussed in Heinen and others (Reference Heinen, Linder, Zierke and Wiebusch2021). The final field test of the EnEx-RANGE project was conducted in August 2018 on the Langenferner glacier in Lombardy, Italy, in collaboration with the Cybernetics Lab IMA & IfU of RWTH Aachen University, the University of Bremen (EnEx-CAUSE)Footnote 1 and the Technical University of Braunschweig (EnEx-MIE)Footnote 2. Additionally, the field test was performed with the assistance of the FH Aachen University of Applied Sciences and the company GSIFootnote 3 as contractors. The main goal of the field test was to demonstrate the navigation capabilities and performance of the acoustic navigation network with the IceMole in a terrestrial analog scenario. For this analog scenario the Langenferner glacier was chosen because of the available ice volume and existing infrastructure in proximity of an alpine hut. The ice volume instrumented for the field test scenarios was located in the ablation zone of the glacier with a volume of roughly 30 m × 40 m × 10 m. These dimensions are smaller than the expected ice volume on Enceladus reflecting the smaller attenuation lengths on the Langenferner glacier (Meyer and others, Reference Meyer2019) compared to the assumptions for Enceladus. However, the results of the performance determined on the Langenferner can be extrapolated to different mission scenarios as on Enceladus as well as on other terrestrial sites such as Antarctica.
A camp was built on the glacier to accommodate the devices and infrastructure required for the measurements; a tent for the operator to control and monitor the state of the probes, a generator tent containing the infrastructure required for the IceMole including three generators and the RCS. The RCS is the central hub to which all APUs are connected during operation. It contains a server for data storage and runs a web interface to monitor and control the probes as well as to visualize data for the operator. The RCS also provides local area network infrastructure, slow control sensors to monitor the state of the hardware and power distribution of the generated line voltage for the APUs and other loads (e.g. camp illumination). The APUs are connected to the RCS via dedicated connectors including separate on/off switches. All components of the RCS are mounted inside a flight case making it a rugged and transportable system. The APUs were secured with a carabiner hook, and a polypropylene rope. The hook is securely mounted to an eye screw on the sealing end of the probe. After each scenario all probes were successfully recovered.
Transfer characteristics
In addition to the navigation capabilities the transfer characteristics of acoustic signals between APUs in glacial ice were measured using a network of nine APUs. Two of the nine probes were used to emit signals while the others worked as receivers. This setup results in the measurement of acoustic signals over 16 distances ranging from about 10 to 30 m. The sending APU emits sine bursts with the signal frequency f sig and a total duration of T tot = 4 ms while the other APUs synchronously start the data acquisition of the acoustic receivers. Each acquisition time window includes a pre-trigger acquisition of 1 ms. The frequencies range from 5 to 34 kHz and for each frequency f sig 64 single measurements were taken.
The quality of signal transfer is quantified by the RMS of the received waveform calculated from the start of the signal t sta to the end of the signal t sto = t sta + T tot. To determine the start mark a leading edge discriminator with a 5σnoise threshold based on the noise level is used. The noise level σnoise is calculated from the pre-trigger acquisition region of the recorded waveform ranging where no signal is expected. The recorded signals are then processed to suppress random and correlated noise. To determine t sta the leading edge discriminator is applied to the envelope of the filtered signal as shown in Figure 11. Based on all measurements for a single distance d i, the average start mark $\bar {t}_\rm {sta}$ is calculated and used to determine the RMS of the signal A(f sig, d i) for each frequency f sig at this distance.
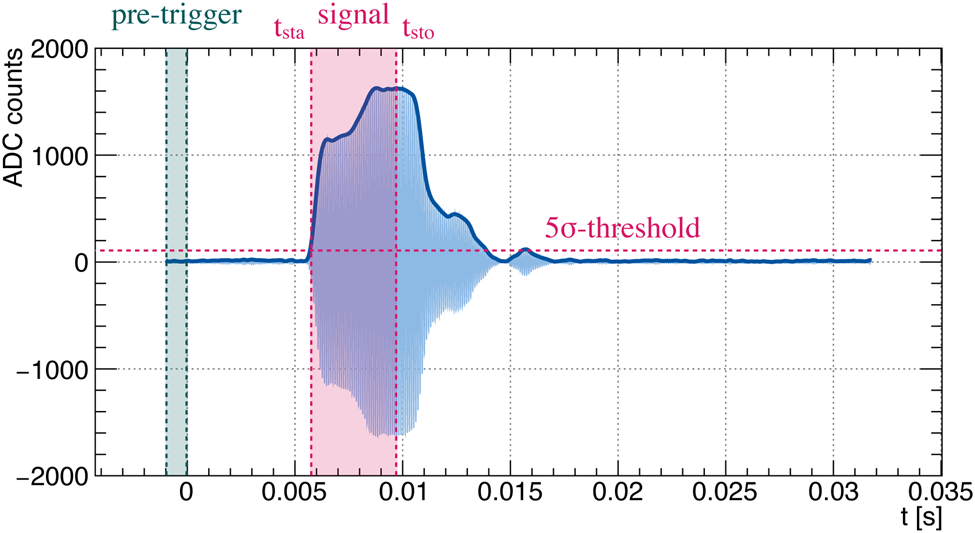
Fig. 11. Waveform of the processed acoustic signal at the distance d = 19.41 m with the signal frequency f sig = 10.1 kHz; the pre-trigger and the signal region are highlighted in green and red respectively.
In order to compare the signals A(f sig, d i) over all distances the relative RMS A rel(f sig, d i) is calculated using

where A max(d i) is the maximum signal RMS measured for the distance d i for all frequencies. The transfer characteristic of the APU network is then calculated with the weighted mean of the relative RMS $\bar {A}_\rm {rel}( f_\rm {sig},\; d_i)$ over all distances. The resulting average is shown in Figure 12; the main resonance at f r = 10.1 kHz is within 1 kHz of the prediction shown in Figure 8, as well as the secondary resonance at 19 kHz. Note, that the displayed errors of this transfer characteristics include the uncertainty of the estimation of t sta and the electronic noise of the digitizer but do not include small systematic variations within the averaged data set that cannot be well estimated. These are e.g. variations of the couplings of the receivers and emitters to the acoustic medium and variations of the acoustic medium between different APUs.
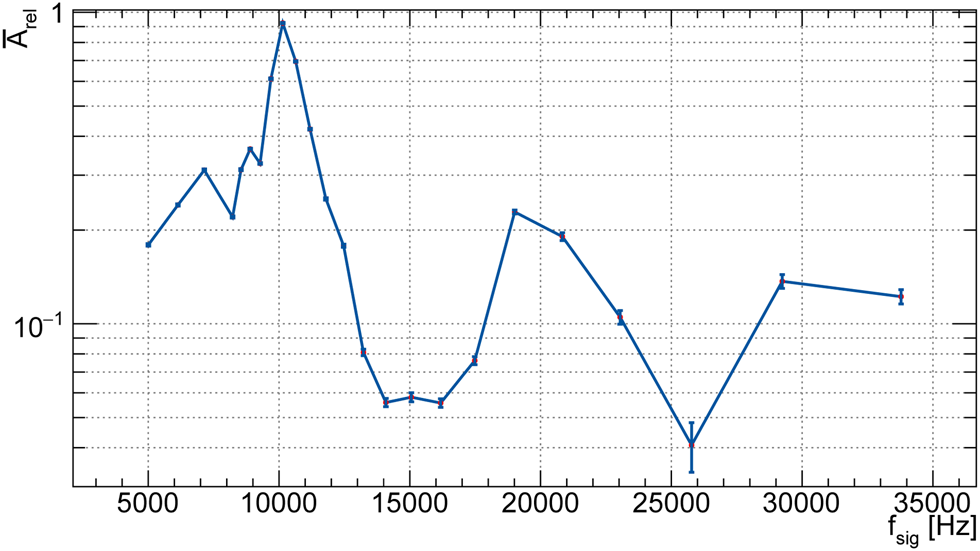
Fig. 12. Transfer characteristic of acoustic signals in the acoustic navigation network between APUs in glacial ice.
The properties of the ice on Enceladus will differ from the glacial ice of the terrestrial test scenario and strongly influence the range and quality of the acoustic signal transfer between the APUs. The data recorded during the field test can be used to estimate the maximum range at a given signal-to-noise ratio depending on the attenuation length in ice and the number of averages taken for a single measurement. The range estimation in Figure 13 uses a signal-to-noise ratio; = 5 : 1, the attenuation length λ = 8.7 m at f sig = 10 kHz (Meyer and others, Reference Meyer2019), and the data from the transfer characteristics at resonance frequency. Figure 13 shows that with attenuation lengths λ > 300 m (e.g. as observed in cold ice in Antarctica by Abbasi and others (Reference Abbasi2011)) ranges of several hundred meters can be achieved easily with the current system.
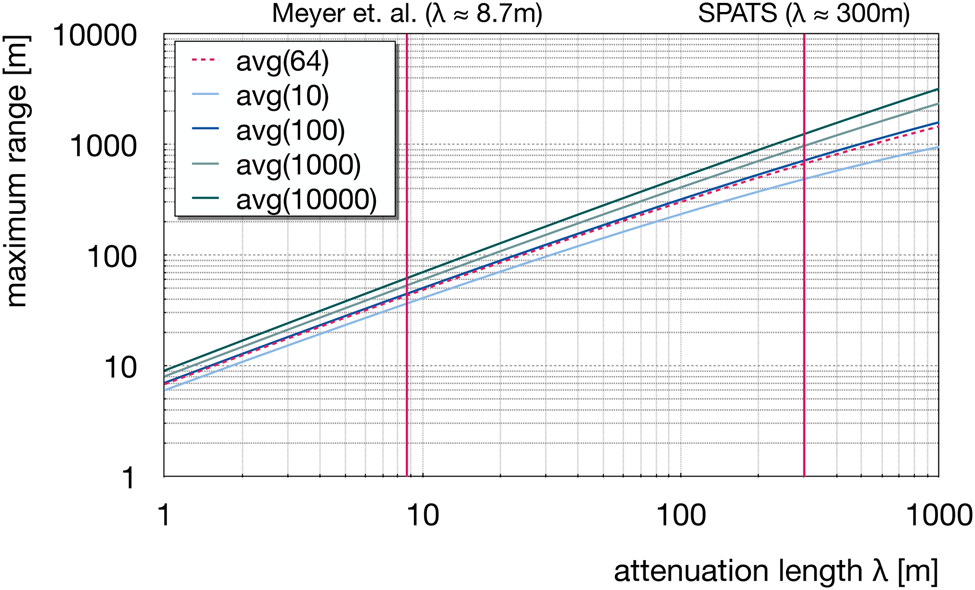
Fig. 13. Range estimation with respect to the attenuation in ice; shown are different curves for the different number of averages. The dotted red line shows the configuration used in EnEx-RANGE. The solid red lines mark the attenuation lengths measured at the Langenferner glacier (Meyer and others, Reference Meyer2019) and the cold ice of Antarctica (Abbasi and others, Reference Abbasi2011).
Navigation verification and performance
In order to demonstrate the navigation capabilities of the acoustic navigation network and measure its overall performance the IceMole traveled along a downward trajectory into the glacial ice through a network of ten APUs; the IceMole melted into the ice at an angle of about 15° along a straight line for about 22 m. Based on this planned trajectory the positions of the APUs and the IceMole were determined. An overview of the test setup is shown in Figure 14 based on GPS coordinates recorded in the field test. The acoustic navigation network was set up, one APU after the other melting into the ice and optimizing for signal quality. Once the network was up and running the IceMole started its trajectory into the ice. The run took about 24 h with 75 stops and ended with the successful extraction of the IceMole and all ten APUs. During each stop a measurement sequence started to determine the position of the IceMole using the acoustic navigation network; each APU consecutively sent 64 sine-bursts at resonance frequency f sig = 10 kHz. The four acoustic receivers inside the IceMole head synchronously started acquiring data.

Fig. 14. 2D projection of the experimental setup for the navigation verification; shown are the APUs of the acoustic navigation network with their corresponding number (blue), the start position of the IceMole (red) and the planned trajectory (dotted line).
To ensure a robust acoustic position reconstruction the methods for acoustic transit time determination from the joint EnEx project were evaluated and refined (Zierke, Reference Zierke2019); the recorded 64 waveforms are averaged to increase the signal-to-noise ratio. The averaged waveforms are then filtered and the transit time is extracted using a 5σ threshold. The uncertainties on the measurements are based on a bootstrapping method. Using the transit times and the speed of sound in ice the distance between the APUs and the IceMole was determined.
An overview of the achieved acoustic performance during the field test is presented in Figure 15. Shown is the received signal amplitude (blue points) corrected for the 1/r distance dependency for all signals sent and received between the APUs. The decrease of amplitude (red line) corresponds to a fit of an exponential attenuation of the average signal strength resulting in a fitted attenuation length of λ = 6.6 m. This is within the assumed uncertainty well compatible with the measurement (Meyer and others, Reference Meyer2019). All signals in the grey shaded region are excluded due to clipping of too large signals and are not used for further analysis. The solid and dotted lines correspond to the minimally detectable signal amplitudes for low and average noise of the sensors measured during the field test respectively, also corrected for the 1/r distance dependency. Only signals above these lines can be detected reliably. Signals for distances over 30 m are not shown in the diagram, since they were not measured during the field test. It can be easily seen that the range of the acoustic signals between the APUs is limited to several 10 m due to the strong exponential attenuation. Lower attenuation, as expected in cold ice, would result in ranges of several 100 m for the same configuration.
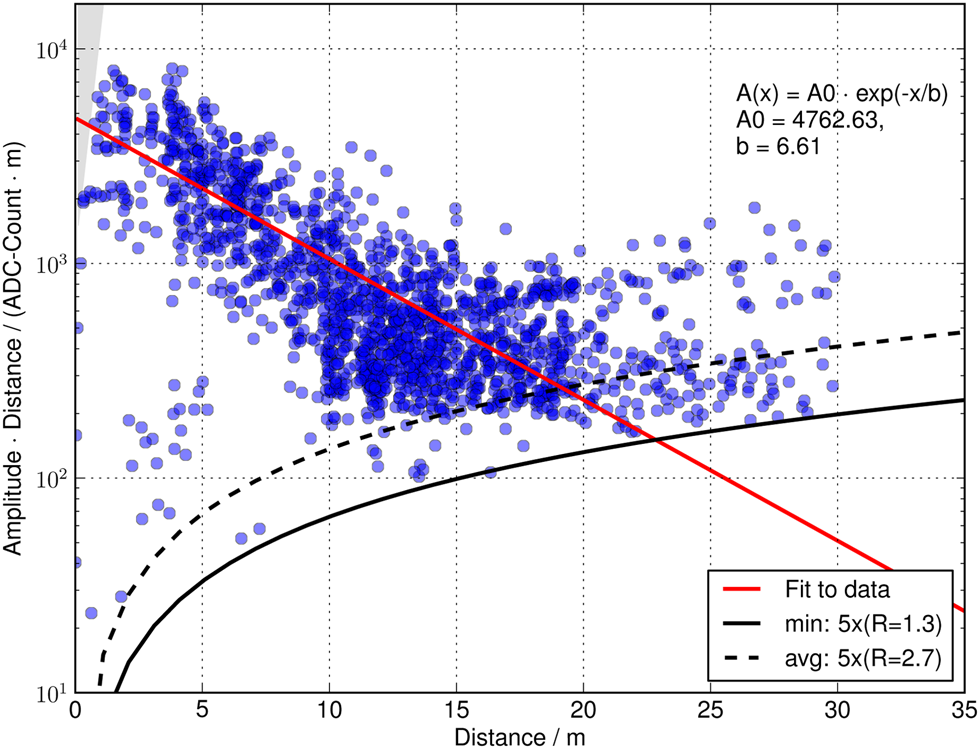
Fig. 15. Visualization of the overall performance of the APU network during the field test 2018; See text for details.
The reconstruction of the trajectory uses the positions of the APUs, the distances based on the travel time measurements, and trilateration algorithms (Zierke, Reference Zierke2019). Only plausible distances are used for reconstruction while negative distances and distances larger than the dimensions of the acoustic navigation network are the result of an erroneous measurement due to noise, low signal or electromagnetic interference and are discarded. Additionally all measurements of the four acoustic sensors of the IceMole are checked for consistency for each measurement sequence and every emitter. If the transit time measured by one of the four sensors deviates more than 555 μs (2 m travel distance in ice with a speed of sound of 3600 m s−1) from the median, this measurement is discarded as well. The results of the reconstruction of the trajectory of the IceMole using the preselected data is shown in Figure 16 in north-east and east-up view. The reconstructed trajectory agrees with the planned trajectory and the average deviation of the reconstructed point to the trajectory is Δd = 0.32 m. The reconstructed speed of v reco = (0.85 ± 0.08) m h−1 also agrees with the measurements based on the propulsion of the IceMole at v s = 0.93 m h−1.
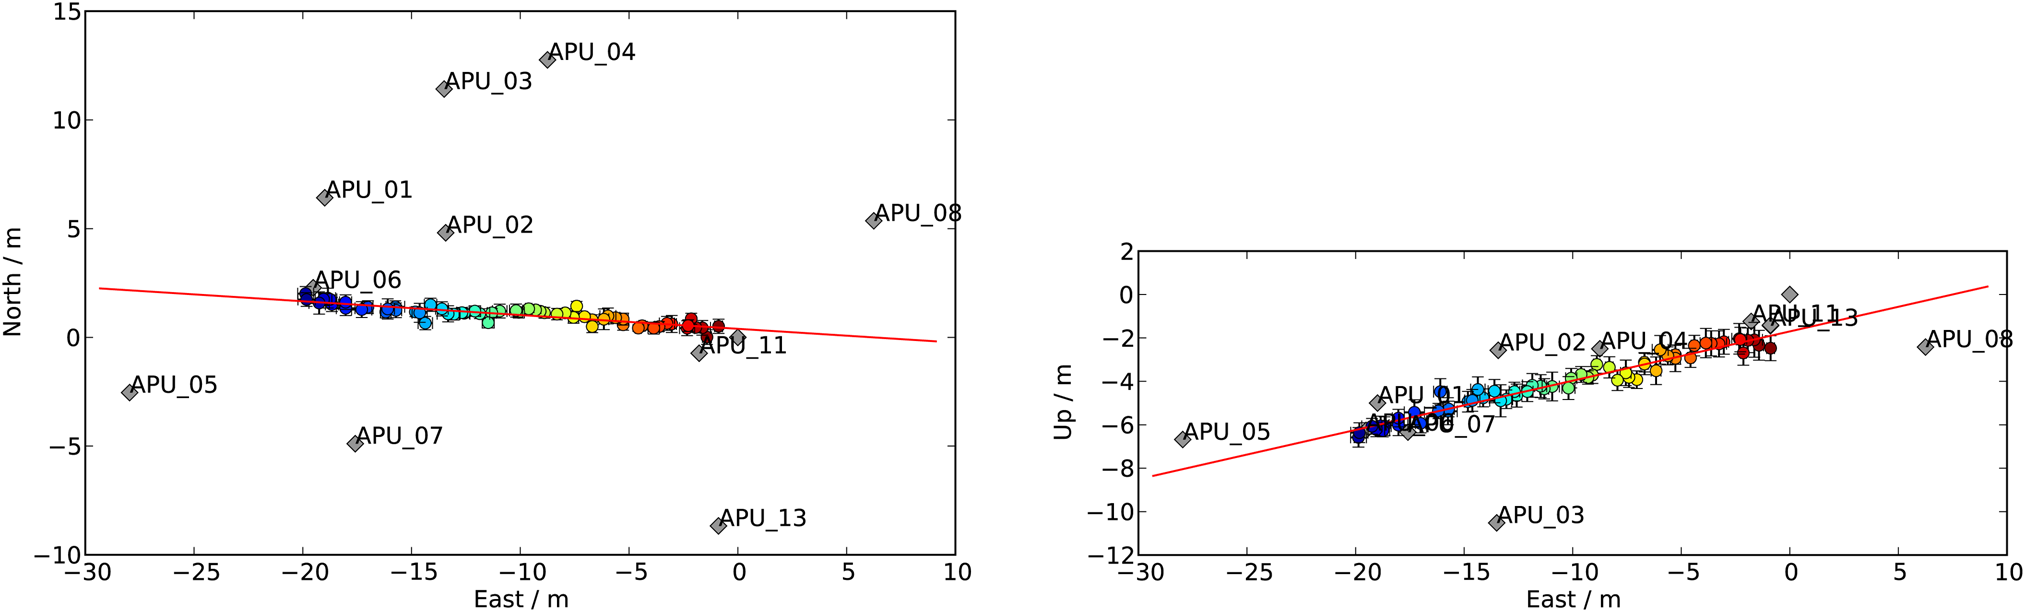
Fig. 16. Reconstruction of the positions of the IceMole during the EnEx-RANGE field test; the reconstructed positions are represented by the colored dots. The colors encode the time increasing from red to blue. The grey diamonds labeled with APU_01 to APU_13 are the positions of the emitters. The red line represents the resulting trajectory.
Conclusion and outlook
During the project EnEx-RANGE novel autonomous melting probes with acoustic instrumentation were developed. The novel melting head, a state-of-the-art data system, various auxiliary sensors and its custom designed acoustic instrumentation makes the APU a robust melting probe for acoustic navigation in glaciers. The performance of the acoustic navigation network has been demonstrated in several field tests on alpine glaciers as terrestrial analog scenario for the long-term goal of a future space mission for the sub-surface exploration of Saturn's moon Enceladus. On the Langenferner glacier, a network of ten APUs was successfully deployed and retrieved. The network allowed testing the performance of the APUs in ice and evaluating the transfer characteristics for exchanged acoustic signals over large distances. The network was able to reliably determine the position of the IceMole on its trajectory through the ice volume of the test field with a precision of 0.32 m.
The technologies developed during EnEx-RANGE are utilized in other earthbound projects. One example is the IceCube Neutrino Observatory (Aartsen and others, Reference Aartsen2017) that instruments a volume of about 1 km3 at a depth between 1.5 and 2.5 km at the geographic South Pole with optical sensors detecting light from rare neutrino interactions. For the upcoming upgrade it is planned to add new acoustic calibration devices that are based on the here presented APUs with the goal of an improved localization of the sensors based on acoustic trilateration.
Several steps are still required prior to the start of a mission to Enceladus; one big challenge is enhancing the system to a higher level of autonomy as, for example, the start of the APUs and the cable tracing were manually handled by operators in the field. All manual interventions need to be automated for the final system. Due to the long distance to Enceladus the total payload will be very limited (Konstantinidis and others, Reference Konstantinidis2015), therefore the overall system needs to be reduced in weight. An important point of discussion in Konstantinidis and others (Reference Konstantinidis2015) is the choice of the power source which will affect the total mass and overall design of the system. The CASSINI space craft was powered by radioisotope thermoelectric generators (RTGs). The heat generated by the RTGs could be used for melting. Another approach could be a small size nuclear reactor, but those reactors are not flight proven. The position of the energy source, either within the melting probe or inside the lander, opens up another question; what kind of connection is needed between the lander and the probes for communication and power? The melting system needs to be adapted to Enceladus ice properties and environmental conditions. In preparation of this adaption simulations (Schüller and Kowalski, Reference Schüller and Kowalski2019) of the melting behavior in low gravity, low pressure and at low temperatures are currently being carried out. Additionally, the system for the EnEx mission needs to be refitted in accordance to the space standards (ECSS or NTSS) for robustness, radiation hardness and an extended temperature range.
Another possible application of the EnEx-RANGE technology is planned within the TRIPLE Project Line (Waldmann and others, Reference Waldmann2018), where technologies for the exploration of Jovians moon Europa are in focus. Similar to Enceladus, Europa's subglacial ocean is a possible habitat for life. The APU is the base for the development of a new melting probe, the TRIPLE-IceCraft (Heinen and others, Reference Heinen, Linder, Zierke and Wiebusch2021). The TRIPLE-IceCraft is a modular carrier system for transporting standardized payloads through several hundred meters of ice, penetrating into an ocean or subglacial lake and later returning to the surface. It will be equipped with a forefield reconnaissance system (TRIPLE-FRS) using a combination of radar and a sonar that is based on the acoustic system of the APU. For a terrestrial demonstration TRIPLE aims to explore a subglacial lake in Antarctica in the Dome C region.
Acknowledgments
We thank Stefan Wickmann for his contributions to the system software, Franziska Scholz and Marion Funken for their contributions to the field test planning and transducer development, and Jürgen Borowka for proofreading the manuscript. We also thank the colleagues from the Cybernetics Lab IMA & IfU at the RWTH Aachen for the collaboration within the EnEx-RANGE project as well as our colleagues from the EnEx-MIE (Technische Universität Braunschweig), EnEx-CAUSE (Universität Bremen), the FH Aachen University of Applied Sciences and the GSI – Gesellschaft für Systementwicklung und Instrumentierung mbH for the close cooperation during the field tests. This work has been accomplished within the framework of the Enceladus Explorer Initiative that is managed by the DLR Space Administration. The EnEx-RANGE project was funded by the German Federal Ministry of Economics and Energy (BMWi) by resolution of the German Federal Parliament under the funding code 50NA1501.


 Open access